Download as PDF, PPTX


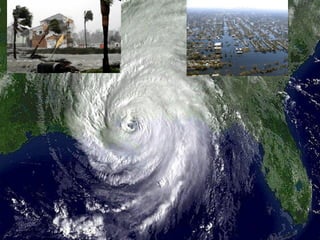
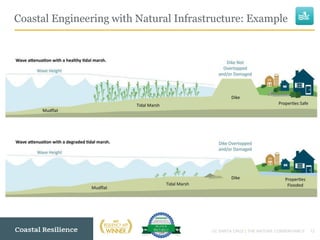
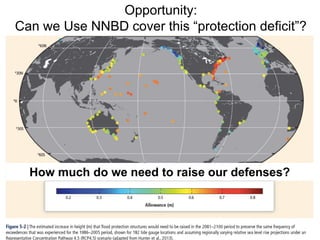
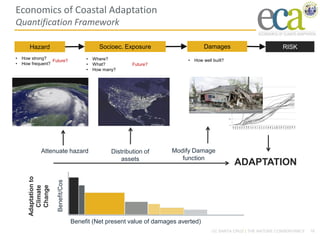

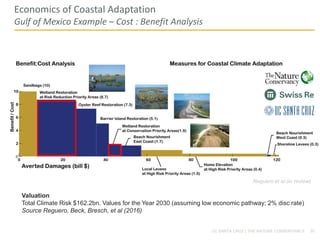
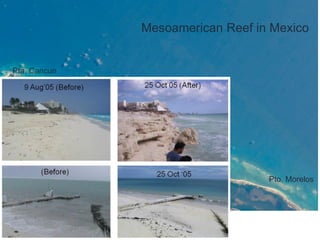
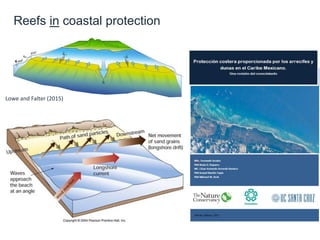
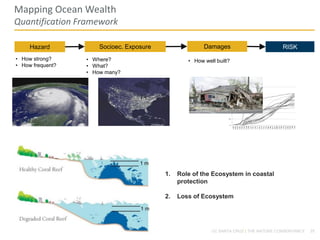
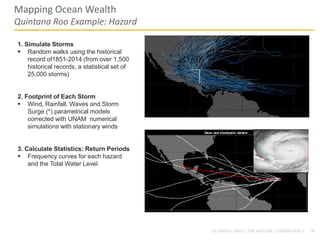
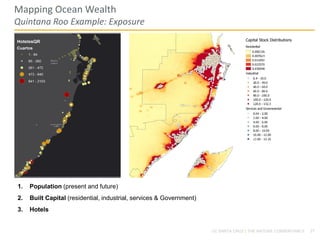
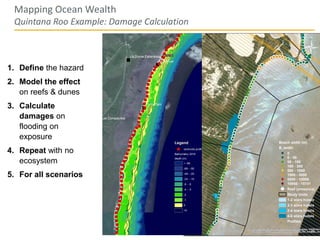
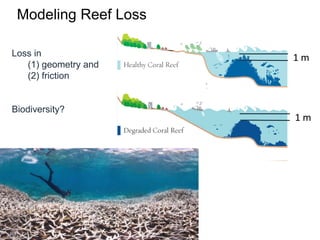
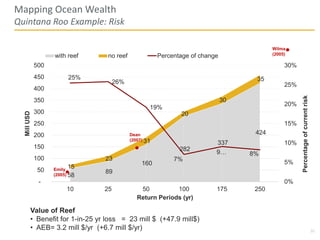
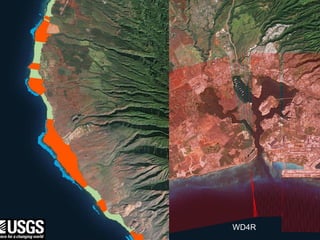
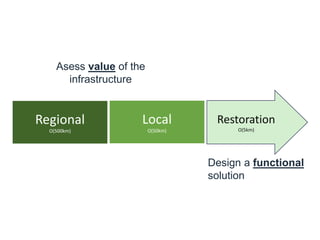
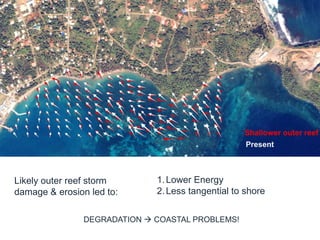
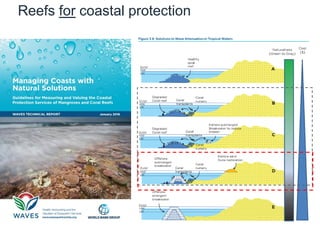
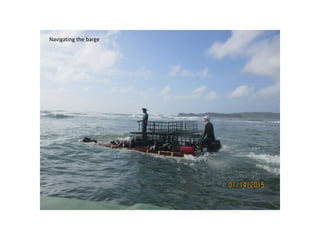

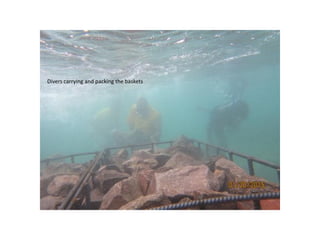
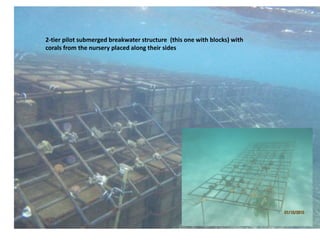
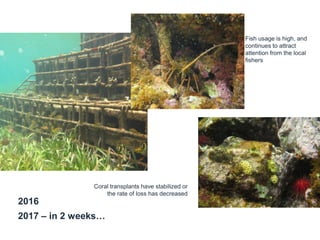

1) Natural infrastructure like coral reefs can help sustain coastal populations by reducing risks from hazards. Coral reefs attenuate wave energy and storms surges, providing coastal protection. 2) Assessing the risk reduction and economic benefits of natural infrastructure requires quantifying hazards, exposure, damages with and without the ecosystem. For example, modeling showed reefs in Mexico reduced risk of 1-in-25 year losses by $23 million. 3) Restoration of degraded reefs can help regain their coastal protection functions. A pilot project in Mexico transplanted corals to stabilize shorelines and decrease erosion, showing restoration provides benefits within a few years.