CBO’s new health insurance simulation model creates synthetic firms that mimic the real-world variations between firms to model employers’ decisions about whether to offer employment-based health insurance.
Presentation by Alexandra Minicozzi, a Unit Chief in CBO’s Health, Retirement, and Long-Term Analysis Division, at the 8th Annual Conference of the American Society of Health Economists.
CBO's analyses of the distribution of household income rely on the Census Bureau's Current Population Survey (CPS) for information about receipt of government transfers, particularly means-tested transfers. CPS respondents underreport their receipt of those transfers, and that underreporting has increased over the past few decades. This presentation shows how CBO adjusts for the underreporting of means-tested transfers in its distributional analyses.
HISIM2 is an updated version of the model CBO uses to generate estimates of health insurance coverage and premiums for people under age 65. The model is used along with other models to develop CBO’s baseline budget projections (which incorporate the assumption that current law generally remains the same). It is also used to estimate the effects of proposed changes in policies that affect health insurance coverage.
Deloitte UK State of the State Report 2016-17Deloitte UK
This year’s State of the State finds the UK Government moving from an era of challenge around one objective – eliminating the budget deficit – into an era of multiple and complex challenges. The next five years will see additional demands on the public sector as it manages the UK’s departure from the EU, continues to drive major reforms and maintains business as usual.
Transportation Directions: Where Are We Heading? (Jack Basso) - ULI Fall Meet...Virtual ULI
Authorization of the next surface transportation bill has
languished in Congress. Learn about prospects for a
breakthrough and how states are dealing with continued
uncertainty and planning for a future with diminished federal
resources.
Presentation at the Fifth Biennial Conference of the American Society of Health Economists, by Allison Percy, Health, Retirement, and Long-Term Analysis Division
FRB-Richmond_ unsustainable fiscal policy_ implications for monetary policyFred Kautz
Economic research suggests that high debt levels ultimately could overwhelm a central bank’s efforts to keep prices stable. This essay will argue that these outcomes should be avoided in the United States by putting fiscal policy on a sustainable path.
Presentation by Adebayo Adedeji and Heidi Golding, analysts in CBO's National Security Division, at the Annual Conference of the Western Economic Association International.
CBO and the Joint Committee on Taxation use HISIM2 to estimate the major sources of health insurance coverage and associated premiums for the U.S. population under age 65.
HISIM2 is used in conjunction with other models (for example, those for related taxes, Medicaid, and Medicare) to develop baseline insurance coverage projections and their associated budgetary costs. It is also used to estimate the effects of proposed changes in policies that affect health insurance coverage.
CBO uses HISIM2 to model firms’ decisions to offer health insurance as well as households’ decisions to enroll in health insurance. Like all of CBO’s models, HISIM2 is regularly updated. This slide deck describes the analytical methods used in HISIM2 to model firms’ decisions in CBO’s baseline budget projections as of March 6, 2020.
Presentation by Kathleen Burke, John McClelland, and Jennifer Shand, analysts in CBO’s Tax Analysis Division, to the National Association of Legislative Fiscal Offices.
Presentation by Chapin White, CBO's Deputy Director of Health Analysis, to the Leadership Fellowship Program at the National Hispanic Medical Association.
This presentation provides information about spending by federal, state, and local governments on investment and estimates from the economics literature about how state and local governments use federal funds to replace funds they would have provided for such investment.
Presentation by Sheila Campbell, an analyst in CBO’s Microeconomic Studies Division, to the National Federation of Municipal Analysts on January 31, 2019.
Budget 2013--Response by Rt Hon Said Musapupbelize
A debate on the budget is an opportune time to review the state of the Belizean economy and the state we are in as a country 31 years after we achieved political independence as a nation.
The Barrow Administration came into office in 2008 with great promise. They promised a 6% annual growth after inheriting an economy that had more than doubled to $2.5 billion dollars in goods and services under the PUP government (1998-2008). During the PUP years, the annual average growth rate was 5%. Even if we take account of the 5% GDP growth in 2012 claimed by the Prime Minister, the average growth rate for their five years is 2.6%.
CBO uses its microsimulation tax model to simulate the effects of tax rules for a representative sample of tax filers in each year of the budget window. The model informs much of CBO’s analysis of the individual income and payroll tax system.
At 78 percent of gross domestic product (GDP), federal debt held by the public is now at its highest level since shortly after World War II. If current laws generally remained unchanged, CBO projects, growing budget deficits would boost that debt sharply over the next 30 years; it would approach 100 percent of GDP by the end of the next decade and 152 percent by 2048. That amount would be the highest in the nation’s history by far. The prospect of large and growing debt poses substantial risks for the nation and presents policymakers with significant challenges.
Presentation by Alice Burns and Jaeger Nelson, analysts in CBO’s Budget Analysis Division and Macroeconomic Analysis Division, to the National Tax Association.
Presentation by Heidi Golding, an analyst in CBO’s National Security Division, at the Southern Economic Association Annual Meeting.
In this presentation, CBO provides background information on the VA health care system and past spending and describes 10-year projections by CBO on VA health spending under three different scenarios. CBO finds that, under certain assumptions, future spending required to treat veterans may be substantially higher (in inflation-adjusted dollars) than recent appropriations.
Jana treek Jana treek Jana treek Jana treek Jana treek Jana treek Jana treek Jana treek Jana treek Jana treek Jana treek Jana treek Jana treek Jana treek Jana treek Jana treek Jana treek Jana treek Jana treek Jana treek Jana treek Jana treek Jana treek Jana treek Jana treek Jana treek Jana treek Jana treek Jana treek Jana treek
Jana treek Jana treek Jana treek Jana treek Jana treek Jana treek Jana treek Jana treek Jana treek Jana treek Jana treek Jana treek Jana treek Jana treek Jana treek Jana treek Jana treek Jana treek Jana treek Jana treek Jana treek Jana treek Jana treek Jana treek Jana treek Jana treek Jana treek Jana treek Jana treek Jana treek
Defending Defense: Setting the Record Straight on U.S. Military Spending Requ...The Heritage Foundation
Since the end of the Cold War, administrations of both political parties have underfunded the military, first harvesting a “peace dividend” by reducing the size of the force and then repeatedly postponing investments needed to replace worn out equipment and preserve the technological advantages that have been a traditional source of American strength. Now, just as this strain on the military—engaged in today’s persistent irregular wars, yet unable to prepare fully for the wars of the future—reaches a point of crisis, come new calls to cut the Defense Department’s budget, amplified by the fears of a faltering economy, the federal government’s desire to boost spending elsewhere, and its inability to rein in other spending. Yet the arguments frequently made for Pentagon spending cuts are concocted from a mix of faulty analysis and out-of-context “facts.”
Ports-to-Plains Energy Summit
Omni Interlocken Resort
Broomfield, CO
April 7, 2011
The Ports-to-Plains Corridor has a diversified energy portfolio, and biofuels are a growing industry throughout the region. Learn about innovative developments in the industry in the corridor.
Comments on Interim Guidance on State Freight Plans and State Advisory Commit...Ports-To-Plains Blog
The U.S. Department of Transportation (DOT) requested comments related to the interim guidance on state freight plans and state advisory committees. In response to the Notice, the Ports-to-Plains Alliance respectfully submitted these comments.
Ports-to-Plains Alliance
Lunch with Board of Directors
July 13, 2012
Limon Community Building, Limon, CO
Living in a Dry Land
An overview of Lincoln County and its Economy
Patricia Vice, Executive Director, Lincoln County Economic Development
Transportation Challenges – How are Ports-to-Plains Alliance Jurisdictions Addressing the Issues?
The Ports-to-Plains region fuels North America with Alberta, home of the world’s third largest proven oil reserves, and 7 of the top 10 oil producing US states. While the production is a boom to the local economies, it is placing a strain on the transportation infrastructure. Transportation leaders from Alberta, Texas and North Dakota will tell how they are facing the challenge.
In the report that follows, the Council has provided what it considers critical
path recommendations for organizational modernization and performance improvement
throughout TxDOT.
After the US dollar replaced gold, the US debt became the attention worldwide, thus the demand for the US dollar continued, furthermore the extremely low interest of the dollar. This helped the US government to borrow great amounts of debt as well as kept the creditors pleased. Due to the pandemic, the US economy retrograded because of the tax cut and unproductive rescue spending plan plus surpassing spending of the government. The rising inflation starts to increase to high levels, which certainly the government must cut back spending or its patterns, while this will lead to uncertain consequences for the long future. This paper discusses several different perspectives on the US government's sustainability as its ability to settle the debt in future, the fate of growth burdened with that debt through the neoclassical mode of growth, and also the effect of anxiety of defaults and unfunded obligations. Inversely, it explores the strength of the dollar with a low-interest rate and its sustainability worldwide. We also propose ways helping of strengthen the fiscal government position and solutions to help the economy recover in long term and to easiest the situation. In the synopsis, we propose something that could affect and shake the global market.
Assignment1. Figure 12-9 on page 272 displays real investmentarleanemlerpj
Assignment:
1. Figure 12-9 on page 272 displays real investment spending as a percentage of global real GDP since the mid-1990s for developed versus emerging nations. The figure shows that in recent years, decreases in planned investment expenditures as a percentage of global real GDP have occurred in highly developed countries. In contrast, planned investment spending as a percentage of global real GDP has been rising for nations with emerging economies.
Global real GDP has increased every year except for a brief dip during 2009. Consequently, planned real investment has risen in all nations in most years. What Figure 4 depicts, therefore, is a shift toward relatively greater increases in planned investment in emerging nations compared with developed countries.
Within any nation’s economy, variations in planned real investment spending operate through the multiplier to bring about changes in equilibrium real GDP. Thus, a country that experiences a larger upward shift in its planned investment function than another nation will, if both countries’ multipliers have close to the same values, observe a greater increase in its equilibrium real GDP
This relatively larger increase in investment spending helps to explain why countries such as China, India, South Korea, and Singapore are emerging from a status of less developed toward eventual classification among developed nations. Relatively higher planned real investment expenditures in these nations are, through multiplier effects, boosting real GDP per year. Thus, flows of real GDP are expanding faster in these emerging-economy countries than in developed ones.
a. If interest rates, or opportunity costs of investment, happened to be the same in both developed countries and emerging economy nations, what could account for faster upward shifts in the latter group’s planned investment functions?
b. Are stocks of productive capital currently growing at a faster pace in developed countries or in emerging-economy nations? Explain.
Resources
To track real investment spending as a percentage of real GDP in recent years for individual nations, go to
Spending vs GDP
.
For links to economic data for both developed countries and emerging-economy nations, go to
IMF.org
.
2.
Paying off State Debts instead of Boosting Expenditures
Figure 13-7 on page 292 of your textbook displays two sets of data. One is the cumulative quantity of grants of discretionary funds transmitted from the federal government to state governments since late 2008. The other is the net amount of borrowing by state governments.
As grants of federal funds to state governments accumulated after 2008, the net borrowing of state governments declined. Many state governments were heavily in debt at the end of 2008, with borrowings in excess of $160 billion. For these states, the receipt of discretionary federal grants beginning in 2009 was a godsend, because it allowed them to start paying off a number of existing debts.
Debt Rep ...
OBJECTIVE
The Budget of the United States Government is a collection of documents that contains the budget message of the President, information about the President's budget proposals for a given fiscal year, and other budgetary publications that have been issued throughout the fiscal year. The budget for the Fiscal Year 2021 was issued by the Office of Management and Budget on February 10th 2020. This webinar shall highlight the backdrop of the budget proposals and the subsequent outcome.
CBO estimates that the federal budget deficit in 2020 will be $1.0 trillion, or 4.6 percent of gross domestic product (GDP). It would increase to 5.4 percent of GDP in 2030 if current law did not change. In CBO’s projections, federal debt held by the public reaches $17.9 trillion at the end of 2020. That amount equals 81 percent of GDP—more than twice its average over the past 50 years. By 2030, debt is projected to reach $31.4 trillion, or 98 percent of GDP, a larger percentage than at any time since just after World War II. It would continue to grow after 2030, reaching 180 percent of GDP by 2050.
Inflation-adjusted GDP is projected to grow by 2.2 percent this year, largely because of continued strength in consumer spending and a rebound in business fixed investment. Output is projected to be higher than the economy’s maximum sustainable output in 2020 to a greater degree than it has been in recent years, leading to higher inflation and interest rates after a period in which both were low, on average. CBO projects that continued strength in the demand for labor will keep the unemployment rate low and drive employment and wages higher. Then over the coming decade, the economy is projected to expand at an average annual rate of 1.7 percent, roughly the same rate as its potential rate of growth.
This presentation provides an overview of the agency’s most recent budget and economic projections, which incorporate the assumption that current laws governing taxes and spending generally remain unchanged. In those projections, federal debt held by the public grows sharply over the next 30 years, reaching unprecedented levels. The presentation also includes a discussion of the effects of the 2017 tax act and recent changes to federal spending policy on the projections. In addition, the presentation touches on budgetary outcomes under scenarios that include future changes to current law.
Presentation by John McClelland, CBO’s Assistant Director for Tax Analysis, at the International Tax Policy Forum.
If current laws governing taxes and spending did not change, the condition of the federal budget would worsen considerably over the next three decades. Growth in federal spending would continue to outpace growth in federal revenues, leading to ever larger budget deficits.
Federal spending is projected to rise noticeably in relation to the economy because of growth in spending in Social Security, the major health programs, and interest on the government’s debt. Federal revenues would also increase if current laws remained generally unchanged, but they would increase much more slowly than federal spending.
Presentation by Keith Hall, CBO Director, at the 19th annual meeting of the Retirement Research Consortium.
The non-partisan Committee for a Responsible Federal Budget (CRFB) has compiled a brief background on the scope of our nation's fiscal challenges and the drivers of our debt and deficits, while outlining some of the types of solutions available to address the problems. This Powerpoint is meant to offer an objective, easily-accessible view of our country's fiscal situation as an educational tool meant to help foster open and honest discussion about these issues.
CBO estimates that the federal budget deficit in 2020 will be $1.0 trillion, or 4.6 percent of gross domestic product (GDP). It would increase to 5.4 percent of GDP in 2030 if current law did not change. In CBO’s projections, federal debt held by the public reaches $17.9 trillion at the end of 2020. That amount equals 81 percent of GDP—more than twice its average over the past 50 years. By 2030, debt is projected to reach $31.4 trillion, or 98 percent of GDP, a larger percentage than at any time since just after World War II. It would continue to grow after 2030, reaching 180 percent of GDP by 2050.
Inflation-adjusted GDP is projected to grow by 2.2 percent this year, largely because of continued strength in consumer spending and a rebound in business fixed investment. Output is projected to be higher than the economy’s maximum sustainable output in 2020 to a greater degree than it has been in recent years, leading to higher inflation and interest rates after a period in which both were low, on average. CBO projects that continued strength in the demand for labor will keep the unemployment rate low and drive employment and wages higher. Then over the coming decade, the economy is projected to expand at an average annual rate of 1.7 percent, roughly the same rate as its potential rate of growth.
Presentation by Joe Kiely, Vice President of Operations at Ports-to-Plains Alliance at Northern Ports-to-Plains Work Group Meeting in Wainwright, AB on June 21, 2013
Energy Development Impact on Transportation Infrastructure presented by TxDOT at Ports-to-Plains Alliance Annual Meeting in Washington DC on April 26, 2013.
Wind Energy's Future and the Impact on U.S. Manufacturing presentation at Ports-to-Plains Alliance Energy Conference in Washington DC on April 26, 2013.
Fuels Policy, Ethanol and RFS Reform Political and Policy Implications on Gas...Ports-To-Plains Blog
Fuels Policy, Ethanol and RFS Reform
Political and Policy Implications on Gasoline Prices.
Presented at Ports-to-Plains Alliance Energy Conference, Washington Dc on April 26, 2013
Dear Governor Heineman:
Thank you for approving the new route for the Keystone XL Pipeline. The project will allow America to gain independence from Middle East and Venezuelan oil by increasing supplies from our loyal, stable and secure ally in Canada. It will also be a major economic development booster for our country and region, not only in the construction of the pipeline, but in further development of Alberta’s oil resources. For every two Canadian jobs created by the oil sands, a third is created in the US. Alberta oil sands development is projected to generate more than $500 billion in US economic impact over the next 25 years.
Letter supporting the Findings of nebraska Department of Environmental Quality for the Keystone XL Pipeline Evaluation by 125 elected officials and community leaders in the Ports-to-Plains region.
Jack Schenendorf, Ports-to-Plains Alliance Transportation Consultant, in Washington will address the following topics:
The 2012 elections, the politics of 113th Congress, and the new leaders handling transportation.
Fiscal cliff: how bad is it and what is likely to happen?
Transportation's fiscal cliff: what are we going to do about it?
MAP-21 implementation and reauthorization in 113th Congress.
Jack Schenendorf’s practice concentrates on transportation and legislation with a particular focus on legislative strategy, legislative procedure, and the federal budget process. For nearly 25 years, Mr. Schenendorf served on the staff of the Committee on Transportation and Infrastructure of the U.S. House of Representatives. He was Chief of Staff from 1995 to 2001.
Jack represents the Ports-to-Plains Alliance in Washington, DC. In addition he has represented Associated General Contractors, American Association of State Highway and Transportation Officials, Association of Equipment Manufactures, United Airlines and others
The international trade data comes from Bureau of Transportation Statistics North American Transborder Freight Data (http://www.bts.gov/programs/international/transborder/TBDR_QA.html). domestic data is from the Freight Analysis Framework by Center for Transportation Analysis in the Oak Ridge National Laboratory under funding from the Federal Highway Administration (http://faf.ornl.gov/fafweb/Extraction2.aspx).
Interim Guidance on State Freight Plans and State Freight Advisory CommitteesPorts-To-Plains Blog
DEPARTMENT OF TRANSPORTATION
Office of the Secretary of Transportation
Interim Guidance on State Freight Plans and State Freight Advisory Committees
Federal Register / Vol. 77, No. 199 / Monday, October 15, 2012 / Notices
Statement on TBD Colorado Recommendations on Transportation
Ports-to-Plains Alliance Northern Working Group Strategic Plan October 2012Ports-To-Plains Blog
Members of the Ports-to-Plains Alliance, organizations and individuals from North Dakota, Montana, Alberta and Saskatchewan met in Regina on October 10 and 11, 2012 to develop a northern plan to enhance the Ports-to-Plains Corridor.
The international trade data comes from Bureau of Transportation Statistics North American Transborder Freight Data (http://www.bts.gov/programs/international/transborder/TBDR_QA.html). domestic data is from the Freight Analysis Framework by Center for Transportation Analysis in the Oak Ridge National Laboratory under funding from the Federal Highway Administration (http://faf.ornl.gov/fafweb/Extraction2.aspx).
The Impact of Artificial Intelligence on Modern Society.pdfssuser3e63fc
Just a game Assignment 3
1. What has made Louis Vuitton's business model successful in the Japanese luxury market?
2. What are the opportunities and challenges for Louis Vuitton in Japan?
3. What are the specifics of the Japanese fashion luxury market?
4. How did Louis Vuitton enter into the Japanese market originally? What were the other entry strategies it adopted later to strengthen its presence?
5. Will Louis Vuitton have any new challenges arise due to the global financial crisis? How does it overcome the new challenges?Assignment 3
1. What has made Louis Vuitton's business model successful in the Japanese luxury market?
2. What are the opportunities and challenges for Louis Vuitton in Japan?
3. What are the specifics of the Japanese fashion luxury market?
4. How did Louis Vuitton enter into the Japanese market originally? What were the other entry strategies it adopted later to strengthen its presence?
5. Will Louis Vuitton have any new challenges arise due to the global financial crisis? How does it overcome the new challenges?
This comprehensive program covers essential aspects of performance marketing, growth strategies, and tactics, such as search engine optimization (SEO), pay-per-click (PPC) advertising, content marketing, social media marketing, and more
New Explore Careers and College Majors 2024.pdfDr. Mary Askew
Explore Careers and College Majors is a new online, interactive, self-guided career, major and college planning system.
The career system works on all devices!
For more Information, go to https://bit.ly/3SW5w8W
NIDM (National Institute Of Digital Marketing) Bangalore Is One Of The Leading & best Digital Marketing Institute In Bangalore, India And We Have Brand Value For The Quality Of Education Which We Provide.
www.nidmindia.com
1. DRAFT DOCUMENT
ALL NUMBERS ARE FC STAFF ESTIMATES BASED ON CBO AND OTHER SOURCES
$200 BILLION IN ILLUSTRATIVE SAVINGS
(In billions; savings rounded to nearest $0.1)
2015 SAVINGS
DOMESTIC: $100.2 BILLION
DEFENSE: $100.1 BILLION
TOTAL: $200.3 BILLION
LEADING BY EXAMPLE
1. Reduce Congressional & White House budgets by 15 percent.1
doubled from FY2000 through FY2010.
Like most areas of
government, the budgets for Congress and the Executive Office of the President have
grown significantly in recent years. For example, legislative branch appropriations almost
2
In order to tackle our fiscal imbalance, everyone must
sacrifice. That should include those at the top. This proposal would cut the budgets for Congress
and the White House by 15 percent, saving about $800 million in 2015.
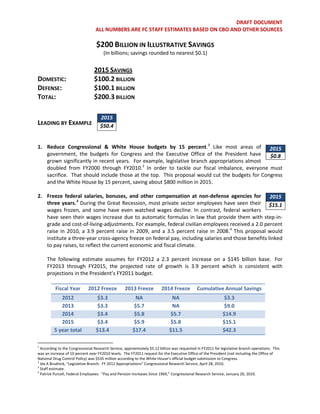
2. Freeze federal salaries, bonuses, and other compensation at non-defense agencies for
three years.3
have seen their wages increase due to automatic formulas in law that provide them with step-in-
grade and cost-of-living-adjustments. For example, federal civilian employees received a 2.0 percent
raise in 2010, a 3.9 percent raise in 2009, and a 3.5 percent raise in 2008.
During the Great Recession, most private sector employees have seen their
wages frozen, and some have even watched wages decline. In contrast, federal workers
4
This proposal would
institute a three-year cross-agency freeze on federal pay, including salaries and those benefits linked
to pay raises, to reflect the current economic and fiscal climate.
The following estimate assumes for FY2012 a 2.3 percent increase on a $145 billion base. For
FY2013 through FY2015, the projected rate of growth is 3.9 percent which is consistent with
projections in the President’s FY2011 budget.
Fiscal Year 2012 Freeze 2013 Freeze 2014 Freeze Cumulative Annual Savings
2012 $3.3 NA NA $3.3
2013 $3.3 $5.7 NA $9.0
2014 $3.4 $5.8 $5.7 $14.9
2015 $3.4 $5.9 $5.8 $15.1
5 year total $13.4 $17.4 $11.5 $42.3
1
According to the Congressional Research Service, approximately $5.12 billion was requested in FY2011 for legislative branch operations. This
was an increase of 10 percent over FY2010 levels. The FY2011 request for the Executive Office of the President (not including the Office of
National Drug Control Policy) was $535 million according to the White House’s official budget submission to Congress.
2
Ida A Brudnick, “Legislative Branch: FY 2011 Appropriations” Congressional Research Service, April 28, 2010.
3
Staff estimate.
4
Patrick Purcell, Federal Employees: “Pay and Pension Increases Since 1969,” Congressional Research Service, January 20, 2010.
2015
$50.4
2015
$0.8
2015
$15.1
2. DRAFT DOCUMENT
ALL NUMBERS ARE FC STAFF ESTIMATES BASED ON CBO AND OTHER SOURCES
3. Cut the federal workforce by 10 percent (2-for-3 replacement rate).5
federal workforce has climbed back over 2 million Full-Time Equivalents (FTE).
The government's
civilian, nonmilitary work force peaked in the late 1960s at about 2.3 million. In the 1990s it
began to drop, reaching a low of 1.778 million in 2000. Recently, however, the size of the
6
This proposal would
reduce the federal workforce by 200,000 by 2020.7
Under this proposal, the government could hire two new workers for every three who leave
service.8
Thus the bill is not a rigid hiring freeze, but a workforce reduction plan that allows the
government to continue bringing in new workers at a slower pace. To decrease the impact on
overall national employment levels, this proposal would not take effect until 2012. All agencies
would be subject to the hiring restrictions. However the president would have discretion to exempt
certain agencies if national security were impacted, as long as the overall workforce targets
continued to decline and reach the target of 200,000 by 2020.
4. Eliminate 250,000 non-defense service and staff augmentee contractors.9
During the
1990s the total size of the federal workforce was reduced by over 402,000 full-time
employees (FTE), levels not seen since the Eisenhower Administration.10
there was only a marginal increase in the number of contract jobs, producing considerable savings
for taxpayers. In fact, according to Paul Light of New York University, the true size of the federal
government was 12,112,000 in 2002, an increase of only 107,000 from 1993, almost all contract
slots.
At the same time,
11
Yet, from 2002 to 2005, the federal government experienced a marked increase in the number of
contract positions. By the end of 2005 (according to Light’s estimates), more than 2.4 million
additional contractors had been placed on the federal payroll (more than the total number of
civilian employees). 12
While contractors provide useful services – sometimes at a lower cost than
the federal government – their numbers are simply too high in light of the current budget deficit.
Under this proposal, non-defense federal agencies would require contractors to provide a
headcount of how many employees are working on federal contracts, and what specific jobs they
are fulfilling. Second, upon completion of the inventory, non-defense agencies would be required to
cut the number of contract slots by 250,000, specifically targeting those contractors who provide
services and/or are used to augment the civilian federal workforce. This cut could be across-the-
board, or it could be on an agency by agency basis.13
This would save about $18.4 billion in 2015.
5
Staff estimate.
6
http://www.whitehouse.gov/omb/budget/fy2011
7
The average annual federal workers compensation in 2008, including pay plus benefits, was $119,982 according to the United States Bureau of
Economic Analysis.
8
According to the Partnership for Public Service, one-third of the 1.9 million member civilian federal workforce is expected to retire or resign in
the next five years. The Partnership expects over 240,000 federal employees to retire between 2008 and 2012.
9
Staff estimate.
10
Paul Weinstein & Katie McMinn Campbell, Return to Fiscal Responsbility II, Progressive Policy Institute, April, 2007
11
Light, Paul, “The New True Size of Government,” New York University/Wagner School of Public Service, August, 2006.
12
Ibid
13
According to Payscale.com the median federal government contractor is $62,401.
http://webcache.googleusercontent.com/search?q=cache:O3GlQ3mPEEwJ:www.payscale.com/research/US/Industry%3DGovernment_Contrac
tor/Salary/by_Employer_Type+median+salary+government+contractor&cd=1&hl=en&ct=clnk&gl=us
2015
$13.2
2015
$18.4
3. DRAFT DOCUMENT
ALL NUMBERS ARE FC STAFF ESTIMATES BASED ON CBO AND OTHER SOURCES
5. Cap the number of federal political appointments at 2,000.14
institute a hard cap on the number of political appointments at 2,000, but the bill would give the
Executive Branch the discretion to determine how to reduce the number of appointees and give it
until 2012 to do so. Positions outlined in the Constitution would not be affected by the bill. This
option would save about $100 million in 2015.
Senators Russ Feingold (D-
WI) and John McCain (R-AZ) have introduced a proposal to cut the number of political
appointments from 3,000to 2,000. Specifically, the Feingold-McCain legislation would
It should be noted that the number of political appointees has risen dramatically in recent years.
Since 1980, the number of political appointees has shot up by nearly 28 percent. The proposal
would also reduce the amount of time the Administration and Congress would have to spend
wrangling over vetting and confirming appointees.
6. Cut federal travel budget.15
approximately $9 billion on travel for mission-related business around the world. In FY2006, that
figure reached just over $14 billion—an increase of 56 percent.
One of the first things companies cut when faced with budget
problems is travel. Yet, despite our record deficits, government expenditures for travel
have grown by leaps and bounds. For example, in FY2001, federal agencies spent
16
Some of the recent increases may be due to fluctuations in oil prices and the demands of the wars in
Iraq and Afghanistan. Even so, the fact remains that year after year, agencies continue to spend
more on travel than they project (both before and after 9/11). Furthermore, the fact that travel
spending is rising at such a rapid pace would seem to be counterintuitive, considering that the last
decade has witnessed remarkable improvements in telecommunications technology (including video
conferencing, web-casting, etc.) that should have decreased the need for in person face-to-face
meetings and onsite visits.
The Department of Energy (DOE) announced this year that it will adopt the suggestion to reduce
travel costs by increasing reliance on video teleconferencing when practical. To fund the upfront
capital costs associated with this effort, DOE will plan to reduce travel budgets by 5 percent versus
its 2009 travel expenditures. The savings from this reduction will be used to assist the Office of the
14
In 2000 the CBO estimated the average salary of political appointees to be $89,000. Most likely there has been additional growth in this
number (meaning the savings for this proposal would be greater than projected here) but official estimates are not readily available.
http://webcache.googleusercontent.com/search?q=cache:xTH3zAr2iT0J:www.cbo.gov/doc.cfm%3Findex%3D1845%26type%3D0%26sequence
%3D20+/search%3Fhl%3Den%26q%3D%2Bsite:www.cbo.gov%2Bcbo%2B%252B%2Bcutting%2Bpolitical%2Bappointees&cd=1&hl=en&ct=clnk&
gl=us.
15
Staff estimate.
16
Daniel Pulliam & Lauren Taylor, Government Executive Magazine
http://www.govexec.com/features/0806-15/0806-15s6.htm
http://www.govexec.com/dailyfed/0807/082907p1.htm
http://www.govexec.com/top200/03top/top03s7s2.htm
http://www.govexec.com/features/0804-15/0804-15s5s2.htm
2015
$0.1
2015
$0.4
Federal Travel Spending FY01 FY02 FY03 FY04 FY05 FY06 FY07
Military Travel Spending $6.0 $6.6 $8.4 $8.9 $10.9 $9.1 $9.6
Non-Military Travel Spending $3.0 $3.4 $3.6 $4.3 $4.5 $5.0 $5.2
Total Travel Spending $9.0 $10.1 $11.9 $13.2 $15.4 $14.1 $14.8
4. DRAFT DOCUMENT
ALL NUMBERS ARE FC STAFF ESTIMATES BASED ON CBO AND OTHER SOURCES
Chief Information Officer in implementing a strategy of enhanced reliance on video
telecommunications to bring down travel costs in 2011 and beyond.17
By increasing reliance on computer web cameras and other video teleconferencing equipment,
including instant chatting, the Department will reduce the need for some business travel. This will
yield savings not only in terms of travel dollars, but also in travel time for federal workers and
contractors, as well as positive externalities of increased safety from eliminating unnecessary travel
and reduced greenhouse gas emissions. DOE estimates this policy change will save $3 million in FY
2011.18
Applying DOE’s policy to all federal agencies (excluding the Postal Service) would save $4.22
billion over ten years.
7. Establish Veterans Administration (VA) health co-pays.19
patients pay no fees for inpatient or outpatient medical care. This option requires co-payments for
medical care provided by the Department of Veterans Affairs to these enrollees, saving $0.7 billion
in 2014.
This option would increase out-
of-pocket costs for veterans in Priority Group 5 — those who do not have service-
connected disabilities and whose income is below a VA-defined threshold. Currently, those
8. Reduce unnecessary printing costs.20
Beyond the costs of mass produced government publications, it is estimated that civilian federal
employees spend $1.3 billion annually on office printing, of which over $400 million of which can be
considered “unnecessary.”
This option reduces unnecessary printing and
publishing costs by allowing certain documents to be released in electronic-only form. Such
documents already exist in electronic form, and printed copies of them often go unread.
9. Trim the Federal Vehicle Budget. The government owns approximately 652,000 cars and
trucks, and it spends almost $4 billion annually to operate them.21
while the cost of operating the fleet has risen 5.4 percent.
Moreover, the number is
getting bigger. For example, since 2006 the government has added over 20,000 vehicles
22
This proposal would require a 20
percent reduction in the vehicle budget for all agencies except the Department of Defense and the
U.S. Postal Service, by requiring agencies to slow down new vehicle acquisitions, decrease the
number of miles driven, and over time moving to a more fuel efficient fleet.
10. Other efficiencies.23
use by putting the default option on copiers to double-sided, cutting personal computer power
usage by introducing a number of energy saving technologies and practices, and eliminating paper
paystubs. Altogether these practices would generate savings of over $1 billion in 2015.
The Administration has proposed a number of proposals that if applied
across agencies would produce important savings to the taxpayer. This could be
accomplished by an executive order by the president. These reforms would reduce copying
17
http://www.whitehouse.gov/omb/budget/fy2011/assets/trs.pdf
18
Ibid.
19
Congressional Budget Office. “Budget Options Volume 1: Health Care.” December 2008.
20
Amendment 4331 to the Tax Extenders Bill, introduced by Sen. Tom Coburn on June 17, 2010 and supported by Sen. John McCain.
http://coburn.senate.gov/public/index.cfm?a=Files.Serve&File_id=d8ccab68-bc74-45a5-af6a-82bb817ea9ff
21
“Federal Fleet Report, Fiscal Year 2009”, General Services Administration.
22
Ibid.
23
Amendment 4331 to the Tax Extenders Bill, introduced by Sen. Tom Coburn on June 17, 2010 and supported by Sen. John McCain.
http://coburn.senate.gov/public/index.cfm?a=Files.Serve&File_id=d8ccab68-bc74-45a5-af6a-82bb817ea9ff
2015
$0.7
2015
$0.4
2015
$0.3
2015
$1.0
5. DRAFT DOCUMENT
ALL NUMBERS ARE FC STAFF ESTIMATES BASED ON CBO AND OTHER SOURCES
CUT OUTDATED, LOW PRIORITY, AND UNDER-PERFORMING PROGRAMS
11. Create a Cut-and-Invest Committee charged with trimming waste and targeting
investment. This proposal would create a bipartisan Cut-and-Invest Committee to review
federal programs and make recommendations to Congress about how best to invest
taxpayer funds. The committee would review each federal agency, look for outdated, duplicative,
under-performing, low-priority, or unnecessary programs, and consider changes to improve each
agency’s operation. After its review, the Cut-and-Invest Committee would submit a report to
Congress containing an analysis of each agency, and give recommendations as to which programs
should be reauthorized, abolished, consolidated, reorganized, or otherwise substantively changed.
Congress would be required to draft legislation carrying out the recommendations. The committee
would be charged with finding discretionary program savings of 1 percent below the President’s
budget, or about $11 billion in 2015.
Such a committee has been recommended many times, and has found bipartisan support. The
original and arguably most effective committee exists at the state level in Texas. The legislature
created a sunset commission in 1977 to eliminate waste and inefficiency in government agencies.
Estimates from reviews conducted between 1982 and 2009 showed 27-year savings of over $780
million, compared with expenditures of $28.6 million. Based on the estimated savings achieved, for
every dollar spent on the sunset process, the state has received $27 in return.
12. Merge the Department of Commerce and Small Business Administration into a single
agency and trim its budget by 10 percent.24
programs that provide direct assistance, grants, loans, and information to help businesses start,
expand, and compete here and abroad. In theory, the SBA is supposed to focus its efforts on small
businesses. However the Department of Commerce has a number of programs which, if combined
with the SBA’s would strengthen their potential impact. Under this proposal, the two agencies
would be merged into a new Department of Commerce and Innovation, and the savings from this
consolidation would allow for a 10 percent cut in the new combined budget, or about $1 billion in
2015.
The Department of Commerce and Small
Business Administration (SBA) have very similar missions. Both entities have a number of
13. Terminate low-priority Corps construction projects. This proposal deepens the cuts to the
Army Corps of Engineers that have been proposed by the administration. The
administration has recommended eliminating hundreds of millions in unrequested funds
Congress appropriates to the Corps of Engineers each year on low-priority projects, focusing funds
on the construction of projects that provide a better return on investment.25
24
Staff estimate.
One particular program
that could be eliminated is the Water and Wastewater Treatment Program. The administration has
argued that the program authorizes projects that are outside of the Corps of Engineers’ mission
areas, specifically those which duplicate efforts made by other federal agencies, including the
Environmental Protection Agency and the Department of Agriculture. Elimination of this program
25
http://www.whitehouse.gov/omb/budget/fy2011/assets/trs.pdf pg, 83.
2015
$23.3
2015
$11.0
2015
$1.0
2015
$1.0
6. DRAFT DOCUMENT
ALL NUMBERS ARE FC STAFF ESTIMATES BASED ON CBO AND OTHER SOURCES
would save $129 million annually.26
The Corps also conducts various operations designed to counter
beach erosion, typically by dredging offshore sand and pumping it onshore to rebuild eroded areas.
The Corps funds a portion of such activities, and state and local governments pay the rest. The
operations have two primary goals: mitigating damage (replenishment helps beaches act as barriers
to waves and protects coastal property from severe weather) and enhancing recreation. However,
proponents of eliminating the program, which would save about $90 million annually, argue that the
cost of beach replenishment should be borne by those who benefit from it: states, localities, and
private landowners.27
This option would reduce funding to the Corps by 20 percent, or about $1 billion in 2015, which
would need to be achieved through the elimination of low-priority programs such as these and
others. Additionally, Congress has failed to prioritize the completion of ongoing projects before
beginning new projects. This behavior has resulted in a construction backlog ranging from $61
billion to more than $80 billion following the passage of the Water Resource Development Act of
2007.28
Whenever possible, Congress should seek to halt authorizing new Corps projects until the
backlog is addressed.
14. Reduce overhead cost of diplomatic operations.29
to-day costs of running U.S. diplomatic operations such as maintenance and security of embassies
and consulates, the salaries of ambassadors, and Foreign Service staff. This option would cut the
budget by 10 percent. This reduces the rate of growth by trimming overhead costs while still
allowing for significant growth from FY2010, when Diplomatic and Consular Programs were funded
at $8.2 billion.
The administration has requested $9.55
billion for Diplomatic and Consular Programs (D&CP) in FY2011, with plans to increase this
to $12.5 billion by FY2015. Diplomatic and Consular Program funding provides for the day-
30
This reduction in future growth can be achieved in many ways and can be done in such a way that
does not jeopardize the security of Americans and our allies working in embassies and consulates
around the world. One area that will cost the State Department a significant amount in resources is
any decision to pay Foreign Service Officers serving overseas an additional bonus called “locality
pay.” Locality pay is paid to federal employees, including Foreign Service Officers who live and work
in Washington D.C. but not federal employees serving overseas. Foreign Service Officers have
sought to end this so-called “pay gap” which they claim is above 20 percent.31
The Department of
Defense’s employees serving overseas do not receive any locality pay either, but there are currently
no proposals to give them this benefit. Proponents of this benefit claim that it is needed to address
recruiting and retention problems, but the foreign service career field remains highly competitive
with 25,000 applicants competing for 300 to 900 positions annually. The “pay gap” was temporarily
fixed in 200932
and 201033
26
but a permanent fix has not been legislatively implemented. Based on
http://www.whitehouse.gov/omb/budget/fy2011/assets/trs.pdf pg, 59.
27
Congressional Budget Office. “Budget Options Volume 2.” August 2009.
28
This number is a combination of the backlog number issued by the National Academy of Public Administration in February 2007 ($60 billion)
and the additional projects authorized in the Water Resources Development Act of 2007 ($23 billion according to the Congressional Budget
Office).
29
Michael Ettlinger and Michael Linden. “A Thousand Cuts.” Center for American Progress, September 2010.
30
CRS Report R40693, “State, Foreign Operations, and Related Programs: FY2010 Budget and Appropriations” February 2, 2010,
http://www.crs.gov/pages/Reports.aspx?PRODCODE=R40693&Source=cli.
31
American Foreign Service Association, “The Foreign Service Overseas Pay Gap,” January 2009, http://www.afsa.org/congress/paygap09.pdf.
32
“Supplemental Bill to close pay gap for overseas diplomats” June 25th
, 2009, http://blogs.federaltimes.com/federal-times-
blog/2009/06/25/supplemental-bill-to-close-pay-gap-for-overseas-diplomats/.
33
AFSA Annual Report 2009, page 52. http://www.foreignservicejournal-digital.com/foreignservicejournal/201003/?pg=51#pg55.
2015
$1.3
7. DRAFT DOCUMENT
ALL NUMBERS ARE FC STAFF ESTIMATES BASED ON CBO AND OTHER SOURCES
Congressional Budget Office assessments, permanently repealing Washington D.C. locality pay for
overseas State Department workers could save $427 million in FY2013.34
The State Department should also examine all consulates to determine cost savings from closing
down those consulates that may have been more relevant in the Cold War, but are not longer
absolutely necessary for the U.S. to conduct its diplomatic mission. Another area that the State
Department should review is its plans for new construction. Many of these plans have included
costly security measures that may not be necessary, or may cost more than is justified by the benefit
they will give to the United States. For instance, in Krakow, Poland, the United States plans to build
a consulate that will cost U.S. taxpayers $80 million but will house only ten American
employees.35
The State Department should determine whether expensive security measures are
appropriate for all countries. In addition it should consider whether there are some consular areas
that should be consolidated or utilize teleconferencing and the internet to more efficiently perform
its mission.
15. Slow the growth of foreign aid.36
assistance.
The President’s budget calls for over $14 billion of
increases in international affairs spending between 2011 and 2015. Nearly all of this growth
is due to large increases in spending for international development and humanitarian
37
Since 2008, the budget for international development and humanitarian assistance has
increase over 80 percent from over $17 billion to over $32 billion, and is expected to grow another
40 percent to over $45 billion by 2015 – more than double previous levels. This option slows the
growth of this budget category, reducing the allocations 10 percent from the President’s budget,
saving $4.6 billion in 2015. A cut of this amount will slow the growth over the period, while still
allowing for an increase of about 30 percent by 2015.
16. Eliminate the Office of Safe & Drug Free Schools.38
be protected, violence and drug abuse are problems that occur far less on school grounds than
elsewhere. As CBO points out in the Budget Options Volume 2 report, children are more likely to be
victims of violence away from school, and while drug use is more common than violence, it still
occurs infrequently on school property. Further, the results hoped for in creation of the Office of
Safe and Drug Free Schools have not been demonstrated.
In the President’s budget, funding for
the Office of Safe and Drug Free Schools is more than double the allocation from 2008. This
option eliminates the office, saving about $1.8 billion in 2015. While school safety should
39
17. Eliminate the Economic Development Administration.40
In 2005, one analysis identified
over 100 economic development programs within more than a dozen different agencies.41
34
Congressional Budget Office Cost Estimate “S. 3426, Foreign Service Overseas Pay Equity Act of 2008,” November 14, 2008.
The multiple different programs within the Economic Development Administration
http://www.cbo.gov/ftpdocs/99xx/doc9916/s3426.pdf.
35
Ashe, Victor H, “Embassy Architecture: Time to Stop, Review, and Rethink,” The Ambassadors Review, Spring 2010.
http://www.americanambassadors.org/index.cfm?fuseaction=Publications.article&articleid=195.
36
Staff estimate based on budget function data from OMB Historical Tables.
37
International affairs spending is defined as budget function 150. International development and humanitarian assistance is defined as budget
function 151.
38
Michael Ettlinger and Michael Linden. “A Thousand Cuts.” Center for American Progress, September 2010.
39
CBO Budget Options Volume 2 includes an option to eliminate grants to states for Safe and Drug Free Schools and Communities, which would
net $0.3 billion in 2015 savings. Information on the effectiveness of such programs is taken from this CBO option.
40
http://www.downsizinggovernment.org/commerce/eda#_edn23
41
Drabenstott, Mark, “A Review of the Federal Role in Regional Economic Development,” Center for the Study of Rural America & Federal
Reserve Bank of Kansas City, May 2005.
2015
$4.6
2015
$1.8
2015
$0.3
8. DRAFT DOCUMENT
ALL NUMBERS ARE FC STAFF ESTIMATES BASED ON CBO AND OTHER SOURCES
duplicate many of the 180 federal economic development programs, including SBA Disaster
Assistance Loans, SBA’s Historically Underutilized Business Zone (HUBZone) program,42
USDA’s Rural
Development programs, numerous Regional Commissions, HUD’s Community Development Block
Grants, USDA’s Economic Action Program, the New Markets Tax Credit, HHS’ Community Economic
Development grants, and many more. Additionally, according to the Congressional Research Service
(CRS), expanding program eligibility and purposes “follows a pattern that has allowed more areas in
the country to become eligible for EDA assistance over the years, even as funding for the agency has
declined.” In 1970, 983 areas qualified for EDA assistance; by 1973, that number had nearly doubled
to 1,818 areas. By 1998, approximately 90 percent of the counties in each year studied qualified.43
Additionally, while EDA was authorized as part of the Public Works and Economic Development Act
(PWEDA) of 1965 to fund only public infrastructure projects intended to spur economic
development in depressed areas, Congress has since increased program eligibility repeatedly. As a
result of these program expansions, some observers have expressed concerns that EDA funds are
seen by many as a supplemental funding source for parochial projects. The Inspector General (IG)
overseeing EDA audited 10 grant projects totaling $45 million between 2004 and 2008 and found
that, because of “various violations of EDA grant requirements, such as financial accounting
irregularities, conflicts of interest, and improper procurement procedures,” they had wasted $13
million. Four of the 10 projects were never completed.44
Eliminating this program entirely would
save about $300 million in FY2015.
Further, the Government Accountability Office (GAO) and other outside experts have criticized the
EDA over the years for claims of job creation and investment returns. A 1980 academic study of the
EDA, which was funded by the EDA itself, found no sustained benefit of EDA programs to assisted
communities.45
In 1986, an EDA technical assistance program claimed it had created 5,834 jobs, but
the Department of Commerce inspector general concluded that the program had created only 83
jobs.46
In 1999, the GAO found that an EDA study claiming that its grants created jobs was meritless:
“The results of EDA’s study are highly dependent on the model specification used and that the
study’s definitive conclusions are unwarranted … we obtained substantially different results that
show that EDA expenditures did not have a significant effect.”
18. Eliminate a number of programs administered by the Rural Utility Service (RUS).47
telephone and electricity – to rural areas through public-private partnerships. The agency
administers loan, loan guarantee and grant programs to eligible populations. In recent years the
RUS has increased its focus on expanding broadband access to rural areas, a noteworthy goal.
However, the agency also runs a number of programs which are outdated, overlapping, and which
provide limited or questionable public policy benefits. These include the Local Television Loan
Program among others.
The
Rural Utilities Service is a division within the U.S. Department of Agriculture’s Rural
Development agency, responsible for providing public utilities – including water, waste,
42
Provides federal contracting preferences to small businesses that obtain HUBZone certification in part by employing staff who live in a
HUBZone (historically underutilized business zones) and maintaining a principal office in one of these specially designated areas.
43
Robert Lake, Robin Leichenko, and Amy Glasmeier, et al., EDA and U.S. Economic Distress: 1965-2000, Rutgers University, New Brunswick, NJ,
July 2004, p. 13, http://www.eda.gov/PDF/2004JulyEDAandU.S.EconomicDistressReport.pdf.
44
Zinser, Todd J., “Written Statement for a Hearing on Economic Development Administration Reauthorization Act of 2008 Before the Senate
Subcommittee on Transportation and Infrastructure,” Inspector General Department of Commerce, September 9, 2008.
45
http://www.downsizinggovernment.org/commerce/eda#_edn21
46
http://www.downsizinggovernment.org/commerce/eda#_edn22
47
Congressional Research Service, 2010 report.
2015
$0.5
9. DRAFT DOCUMENT
ALL NUMBERS ARE FC STAFF ESTIMATES BASED ON CBO AND OTHER SOURCES
19. Reduce wasteful spending at the Department of Justice.48
to grow by nearly half from what it was in 2005 – one of the sharpest increases at any agency. This
option would reduce funding for the Department of Justice 5 percent below the President’s budget,
or about $1.6 billion in 2015. A cut of this amount could be achieved, in part, by reducing funding for
grants
Funded at more than $20
billion annually, the Department of Justice is tasked with keeping our nation safe by
ensuring justice and prosecuting terrorists. By 2015, the department’s budget is projected
20. Eliminate certain regional subsidies.49
government provides annual funding to three regional development agencies: the Appalachian
Regional Commission (ARC), the Denali Commission, and the Delta Regional Authority. The ARC was
established in 1965 to promote economic growth in the Appalachian counties of 13 states,
stretching from southern New York to northern Mississippi. The Denali Commission was created in
1998, on the ARC model, to provide similar services to communities in remote areas in Alaska. The
Delta Regional Authority, established in 2000, similarly serves 240 counties and parishes in eight
states near the Mississippi River, stretching from southern Illinois to the Louisiana coast. This option
would discontinue federal funding for all three regional development agencies, saving just over $100
million annually. The central argument for eliminating these agencies is that a number of their
efforts are duplicative of many other existing federal programs. Furthermore, the three agencies’
programs are intended, among other things, to create jobs, improve rural education and health
care, develop utilities and other infrastructure, and provide job training. However, it is difficult to
assess whether such outcomes can be attributed to those programs rather than to the work of other
governmental and nongovernmental organizations or to market forces and the effects of general
economic conditions.
In certain cases, the federal government targets aid
and/or subsidizes the delivery of basic services through regional agencies or corporations.
This option would eliminate a number of those entities and their programs. The federal
21. Eliminate the Hollings Manufacturing Extension Partnership and the Baldrige National
Quality Program.50
which offer management and manufacturing advice to U.S. businesses. The Baldrige National
Quality Program, for the most part, gives awards to companies for achievements in quality and
performance. Those who support eliminating the programs suggest that the federal government
shouldn’t be providing the services these programs provide, in part because similar programs are
provided by the private sector. In fact, it is argued that some funding from HMEP supports
inefficient companies that would otherwise go out of business. Also, businesses should already have
enough incentives to maintain the quality of their products without awards from the Baldrige
National Quality Program. Elimination of both programs would save over $120 million annually.
Alternatively, the programs could be funded through fees charged to the beneficiaries.
The Hollings Manufacturing Extension Partnership (HMEP) consists
primarily of a network of nonprofit centers, partially funded by the federal government,
48
Staff estimate based on data from OMB’s historical tables.
49
CBO Budget Options Volume 2.
50
Ibid.
2015
$1.6
2015
$0.1
2015
$0.1
10. DRAFT DOCUMENT
ALL NUMBERS ARE FC STAFF ESTIMATES BASED ON CBO AND OTHER SOURCES
SECURE A BETTER RETURN ON TAXPAYER INVESTMENT
22. Eliminate all earmarks.51
and are not subject to accountability metrics. Many of these earmarks are doled out by members of
Congress for parochial interests and as currency with special interest groups. This type of spending is
often used as a means to make pieces of legislation more palatable to specific members who would
otherwise vote against them. Some examples of parochial earmark spending that can be seen as
wasteful include $1.9 million for a Pleasure Beach Water Taxi Service in Connecticut, $1.8 million for
swine odor and manure management research in Ames, Iowa, $900,000 for a program encouraging
Oklahoma students to role play how to make tough choices as members of Congress, $380,000 for
construction of recreation and fairgrounds in Kotzebue, Alaska, and $238,000 for the Polynesian
Voyaging Society of Honolulu, Hawaii, which organizes sea voyages in ancient-style sailing canoes,
among countless others.
There have been significant strides in bringing the system of
earmarking under control and into the sunlight. In FY2010, Congress approved more than
9,000 earmarks costing taxpayers at least $16 billion. Earmarks are not competitively bid
23. Cut research funding for fossil fuels.52
technology was stunted. Today, the situation is quite different. In addition, much of this federal
research duplicates what is being conducted in the private sector. The Office of Management and
Budget has reported that the additional oil reserves which have resulted from technology developed
by the program have been minimal.
This option would eliminate new funding to the
Department of Energy’s applied research on fossil fuels. This funding was created at a time
when the prices for these types of fuels were partially controlled and the development of
53
Cutting this program as has been suggested by CBO would
save close to $900 million in FY 2015.
24. Eliminate funding for commercial spaceflight.54
costly, and while commercial spaceflight is a worthy goal, it is unclear why the federal government
should be subsidizing the training of the potential crews of such flights. Eliminating this program
would save $1.2 billion in 2015.
The National Aeronautics and Space
Administration (NASA) plans to spend $6 billion over the next five years to spur the
development of American commercial spaceflight. This subsidy to the private sector is
25. Drop wealthier communities from the Community Development Block Grant program.55
Urban Development showed that funding under the program shifted from poorer to wealthier
communities as a result of the current formula. The argument for having federal grants go toward
development in wealthier communities is thin. This option would first change the formula for
calculating grants in order to target needier areas and limit grants to wealthier communities. The
funding for the program would then be reduced by 20 percent, saving just over $500 million in 2015.
The Community Development Block Grant program allocates funds according to a formula
based on a community’s population. A 2003 study by the Department of Housing and
51
Staff estimate based on estimates of earmark spending by the Office of Management and Budget. http://earmarks.omb.gov
52
CBO Budget Options Volume 2.
53
Ibid.
54
http://www.nasa.gov/pdf/420990main_FY_201_%20Budget_Overview_1_Feb_2010.pdf
55
CBO Budget Options Volume 2. The President’s budget for 2010 includes a proposal to improve the formula’s targeting of needy communities
but does not specify the changes and increases in total spending on the program.
2015
$19.2
2015
$16.0
2015
$0.9
2015
$1.2
2015
$0.5
11. DRAFT DOCUMENT
ALL NUMBERS ARE FC STAFF ESTIMATES BASED ON CBO AND OTHER SOURCES
There is also a need to consolidate overlapping community development programs. There are many
nation-wide and regional programs to aid economic and infrastructure development, many of which
overlap with the Community Development Block Grant program. Wherever possible, these
duplicative programs need to be consolidated or cut.
26. Reduce voluntary contributions to the United Nations. According to the Office of
Management and Budget, the United States provided over $6.3 billion in taxpayer funds to
the United Nations in FY2009. Less than half ($2.7 billion) of that total went to “assessed”
dues – payments that the United States is charged for being a member and for its share of
peacekeeping operations around the world.56
The United States is by far the largest donor to the United Nations in terms of assessed dues.
However, the United States gives the United Nations more than $3.5 billion in “voluntary” funds
each year.57
This option allows the United States to remain a member in good standing of the United
Nations by contributing the full dues that will be assessed, but reduces voluntary payments by 10
percent, which will save $300 million per year.
27. Eliminate administrative fees paid to schools for student aid programs.58
institutions can use up to 5 percent of program funds to cover the administrative costs of
administering the programs, distributing the funds, or both. Under the Federal Pell Grant Program,
the federal government pays schools $5 per grant to reimburse administrative costs. It has been
argued that schools already benefit greatly from participating in federal student aid programs,
before receiving administrative fees, because the aid makes attendance more affordable.
Under certain
campus-based aid programs – the Federal Supplemental Educational Opportunity Grant
Program, the Federal Perkins Loan Program, and the Federal Work-Study Program –
28. Eliminate the Overseas Private Investment Corporation.59
nationalization. The aim is to support economic development in some countries that are
“strategically important” to the United States. This option would eliminate new activity by OPIC,
although it would continue to service its existing portfolio. The main rationale for implementing this
option is that the activities of OPIC may not provide net public benefits to the United States. Its
subsidies deliver benefits to foreigners and selected U.S. businesses. Furthermore, its subsidies to
nations of strategic importance to the United States tend to overlap with and duplicate those
provided by the U.S. Agency for International Development and by private insurance firms. They also
could hamper the development of local financial institutions and markets in those countries.
The Overseas Private
Investment Corporation (OPIC) offers private U.S. companies subsidized financing for
foreign investments and insurance against political risks to those investments, including
56
Orszag, Peter, “Office of Management and Budget Annual Report on United States Contributions to the United Nations,” June 7, 2010.
57
CRS Report RL33611, “United Nations System Funding: Congressional Issues,” Congressional Research Service, August 9, 2010.
http://www.crs.gov/pages/Reports.aspx?PRODCODE=RL33611&Source=search
58
CBO Budget Options Volume 2.
59
Ibid.
2015
$0.3
2015
$0.2
2015
$0.1
12. DRAFT DOCUMENT
ALL NUMBERS ARE FC STAFF ESTIMATES BASED ON CBO AND OTHER SOURCES
GET FULL VALUE FOR FEDERAL RESOURCES
29. Sell excess federal property.60
identified as under- and not-utilized. Currently, federal agencies operate and maintain more real
property assets than necessary, often raising costs to the taxpayer. In light of this, the President
signed a Memorandum in FY2010 directing agencies to accelerate efforts to remove excess and
surplus property for a savings of $8 billion by FY2012.
The federal government is the largest property owner in the
country, with an inventory that includes 1.2 million buildings, structures, and land parcels.
This includes 14,000 building and structures currently designated as excess and 55,000
61
30. Reduce funding to the Smithsonian and the National Park Service and allow the programs
to offset the reduction through fees.62
visitors. There were about 30 million visitors to the 19 Smithsonian museums and the National Zoo
in 2009. Under this option, $225 million, or less than a quarter of the Smithsonian’s 2015 budget,
would be paid for by charging visitors fees. Notable private museums across the United States tend
to charge anywhere from $10 to $20 per visitor, with lower rates for children and seniors. World
class zoos in the United States charge more, or closer to $20 or $25 per visitor. Raising $225 million
in fees would average about $7.50 per visitor.
The Smithsonian’s budget is projected to approach
$1 billion in 2015. This option reduces net spending by charging a fee to Smithsonian
63
The National Park Service (NPS) budget is projected to exceed $3 billion in 2015. The National Parks
receive nearly 290 million visitors annually and an estimated 10 percent of total NPS spending goes
toward visitor services.64
Under this option, $75 million in 2015, or about a quarter of the expected
spending on visitor services, would be paid for by a small increase in visitor fees.65
Where visitor fees
have been instituted, they vary greatly and are often anywhere from $3 to $25 per week. Raising
$75 million in visitor fees would average under $0.25 per visitor.
This option also requires that both the Smithsonian and National Park Service work through
outstanding maintenance projects until the backlogs are below $1 billion for each agency before
funding new projects. In 2007, GAO found that the Smithsonian had a maintenance backlog of $2.5
billion that was causing damage to historic items.
Together, these options would save about $300 million in 2015.
60
An option to sell excess federal property was proposed under the YouCut program and has also been proposed by Sen. Coburn and Sen.
McCain. http://republicanwhip.house.gov/YouCut/Week4.htm; http://georgewbush-
whitehouse.archives.gov/omb/pubpress/2007/061507_fed_property.pdf
61
Presidential Memorandum, Disposing of Uneeded Federal Real Estate, June 10, 2010.
62
This option is a variant of one offered in the Center for American Progress report “A Thousand Cuts.” Michael Ettlinger and Michael Linden.
“A Thousand Cuts.” Center for American Progress, September 2010.
63
Staff estimate.
64
Staff estimate based on data from the National Park Service FY2010 and FY2011 Green Book.
65
Staff estimate.
2015
$7.3
2015
$1.0
2015
$0.3
13. DRAFT DOCUMENT
ALL NUMBERS ARE FC STAFF ESTIMATES BASED ON CBO AND OTHER SOURCES
31. Eliminate grants to large and medium-sized hub airports.66
(AIP). Federal grants to airports merely substitute for funds that large and medium-sized airports
would otherwise raise from private sources such as investments and passenger fees. However,
smaller airports have more difficulty raising such funds. This option would limit AIP grants to small-
sized airports only, trimming about a third of the program’s budget. This would save about $1.2
billion in 2015.
The Federal Aviation
Administration (FAA) provides grants to airports to expand runways, improve safety and
security, and make other capital investments as part of the Airport Improvement Program
67
32. Cut funding for the Corporation for Public Broadcasting.68
has ever been. This option would eliminate funding for the Corporation for Public Broadcasting,
saving just under $500 million in 2015.
The Corporation for Public
Broadcasting’s primary job is to fund NPR and its member stations (and other public radio
stations) and PBS and its member stations. The current CPB funding level is the highest it
Additionally, Congress should end two duplicative public broadcasting programs on President
Obama’s termination list: The Public Telecom Facilities Grant Program (PTFP) and USDA’s Public
Broadcasting Grants program. In recent years, PTFP has primarily provided funding to help
broadcasters transition to digital broadcasts. In FY2010, PTFP received $20 million in
appropriations. The President has twice recommended terminating USDA’s Public Broadcast Grants
program for the same reason. This program received $5 million in FY10 to provide funding to public
broadcast companies to convert to digital transmission as well – an obsolete task.69
33. Require food processing facilities to finance food safety and inspection services.70
monitoring the processing plants daily adherence to sanitary, ingredient, and packaging regulations.
Federal inspections benefit producers and consumers alike by preventing diseased animals and
other unsafe products from being sold, but producers get the extra benefit of being able to
advertise that their products passed USDA inspection. This option finances all federal inspections of
meat and poultry products with fees paid by the processing facilities, thereby making the service
paid for by those who use it. Implementation of this policy increases federal revenues by over $900
million each year.
Under
current law, one inspector must be present at all times to sample and test products when a
meat or poultry slaughtering plant is in operation. These inspectors are responsible for
34. Change inland water systems to be fully self-funded.71
This option would set the tax on fuel consumed high enough to cover all costs of construction,
operation and maintenance of the inland waterways. An option like this would increase economic
efficiency by encouraging shippers to choose the most efficient routes and transportation while
The Army Corps of Engineers spent
more than $960 million in 2008 on the nation’s system of inland waterways. Revenues from
the tax on fuel consumed by towboats only fund half of construction on inland waterways.
66
CBO Budget Options Volume 2. The $1.2 billion savings in 2015 is a staff estimate based on CBO scores. Cato has recommended eliminating
airport grants entirely in their Downsizing Government report. The Center for American Progress has suggested cutting airport grants by up to
half.
67
CBO Budget Options Volume 2.
68
Staff estimate based on data from an option to reduce funding for the Arts and Humanities in CBO Budget Options Volume 2.
69
http://www.whitehouse.gov/sites/default/files/omb/budget/fy2011/assets/trs.pdf, page 41.
70
CBO Budget Options Volume 2.
71
Ibid.
2015
$1.2
2015
$0.5
2015
$0.9
2015
$0.5
14. DRAFT DOCUMENT
ALL NUMBERS ARE FC STAFF ESTIMATES BASED ON CBO AND OTHER SOURCES
alleviating congestion and demand for new construction, which would save about $500 million
annually.
35. Require airports to fund a larger portion of the cost of aviation security.72
than airlines or airports, responsible for screening passengers, carry-on luggage and checked
baggage. To help pay for the increased security, the law authorizes airlines to charge passengers
$2.50, capped at $5 for a one-way trip, each time they board a plane. By increasing fees, the airlines
would be less subsidized toward airport security – a basic cost of airline transportation, in line with
labor and fuel costs. This option would increase collections by $1.9 billion by 2015 and more than $9
billion over five years.
The Aviation
and Transportation Security Act of 2001 was enacted following the attacks of September
11th
, 2001. As a means of increasing security, the Act makes the federal government, rather
36. Charge beneficiaries for the cost of the International Trade Administration’s trade
promotion activities.73
U.S. industries and operates the U.S. and Foreign Commercial Services to promote exports.
Currently ITA’s mission is to create prosperity by strengthening the competitiveness of U.S. industry,
promoting trade and investment, and ensuring fair trade and compliance with trade laws and
agreements. The President’s FY2011 budget request for the ITA was $534.3 million, a 20 percent
increase from the FY2010 request. This increase includes an additional $78.5 million to support ITA’s
export promotion efforts. Services provided by ITA’s U.S. Commercial Services and other Divisions
directly providing assistance to U.S. Companies should be financed by beneficiaries of this
assistance. While the agency charges fees for those services, its fees do not cover the costs of all its
activities. Additionally, it is argued that the benefits of trade promotion activities are passed on to
foreigners in the form of decreased export costs. According to a study by the Office of Management
and Budget (OMB), businesses can receive similar services from state, local, and private-sector
entities. The CBO option to eliminate ITA’s promotion activities or charge the program’s
beneficiaries saves $267 million in 2010 and $1.6 billion through 2014.
The International Trade Administration (ITA) of the Department of
Commerce oversees a trade development program that monitors the competitiveness of
37. Reduce land acquisition under the Land and Water Conservation Fund. Annual funding for
the Land and Water Conservation Fund (LWCF) has typically been around between $250
million and $450 million. However, the President’s request for FY2011 is $619 million, up
from last year’s $263 million allocation – a 135 percent increase.74
The LWCF is used almost
exclusively for land acquisition for both federal and state land management agencies, while many
argue that the federal government and states have difficulty managing the land they already own.
That budget cannot, however, be used for maintenance. The federal government already owns 650
million acres that it has struggled to maintain. So while we continue to experience a maintenance
backlog between $13.2 and $19.4 billion,75
Congress is seeking to acquire even more land. By not
funding this account until the maintenance backlog has been decreased less than $1 billion, the
federal government will save just under $300 million each year.
72
Ibid.
73
Ibid.
74
http://crs.gov/Pages/Reports.aspx?Source=search&ProdCode=R41258#_Ref223321551
75
“Department of the Interior: Major Management Challenges,” Government Accountability Office, March 3, 2009.
http://www.gao.gov/products/GAO-09-425T
2015
$1.9
2015
$0.3
2015
$0.3
15. DRAFT DOCUMENT
ALL NUMBERS ARE FC STAFF ESTIMATES BASED ON CBO AND OTHER SOURCES
38. Create a more cohesive and cost-effective fire management service. There are numerous
firefighting programs within the Department of the Interior (DOI) and the USDA Forest
Service (FS). Since FY2001, funding for these activities has nearly doubled according to the
Congressional Research Service.76
Despite this increase in funding, three of the past four years have
seen a record amount of federal acreage burned. Within DOI and USDA there are almost identical
accounts for how funds are intended to be spent – the only difference is that these funds are spent
on lands managed by different federal agencies. There are even duplicative research accounts on
wildfire research. Specifically, both agencies have the following accounts: Preparedness, Fire
suppression operations, Hazardous fuels reduction, Burned area rehabilitation, and Joint fire
science. In FY2010, $975 million was appropriated for DOI firefighting activities and $2.592 billion
for FS wildfire activities. Total funding between the two was $3.567 billion in FY2010, not including
emergency appropriations. Since 1999, GAO has repeatedly found that these activities should be
more cohesive and cost-effective.77
In 2009, GAO noted that Forest Service and Interior agencies
had not defined firefighting cost-containment goals or developed a strategy to achieve such goals,
despite GAO recommendations in 2007 to do so. Instead, costs have continued to rise. This option
would require the agencies to follow GAO recommendations, and develop clear cost containment
plans, in order to reduce the yearly spending between the programs by 10 percent, or just under
$400 million annually.
76
http://crs.gov/ReportPDF/RL33990.pdf
77
http://www.gao.gov/new.items/d09877.pdf
2015
$0.4
16. DRAFT DOCUMENT
ALL NUMBERS ARE FC STAFF ESTIMATES BASED ON CBO AND OTHER SOURCES
CREATING A LEANER, MORE EFFICIENT DEFENSE DEPARTMENT
39. Apply the overhead savings Secretary Gates has promised to deficit reduction.78
$100 billion. This initiative will include reforms such as reducing the number of contractors providing
services to Pentagon staff, limiting personnel growth in the Office of the Secretary of Defense (OSD),
defense agencies, and the combatant commands, reducing duplication in DOD’s intelligence
community, improving DOD’s acquisition process, requiring trade-offs between cost and capabilities
in decisions about weapon system requirements, and consolidation of information technology
infrastructure facilities.
In May,
Defense Secretary Robert Gates announced a major initiative to find efficiencies and
reduce overhead costs within the Department of Defense, with a five-year savings goal of
79
Currently, the savings are to be reallocated to force structure and
modernization. If these savings were applied to deficit reduction instead, we could save $28 billion
in 2015.
Additionally, significant material weaknesses in DOD’s financial management and related business
operations continue to hinder its ability to pass an independent audit of its financial operations and
activities and diminish financial transparency and accountability for the resources provided to DOD.
While DOD leadership has expressed commitment in the past for financial management
improvement activities and efforts to obtain clean audit opinions, until recently, the department
lacked a viable plan or accountability for achieving these objectives. If the Department of Defense
can significantly improve its financial management, and achieve audit readiness, it can generate
substantial savings over time.
Current DOD and military department leadership have expressed their commitment to financial
management improvement and audit readiness plan in response to congressional mandates, GAO
recommendations, the President’s priorities, as well as demands for greater fiscal economy and
efficiency. However, prior efforts to achieve financial management improvements within DOD have
not been successful, in part because the department lacked an integrated strategic plan and focused
and committed leadership to ensure that sustained improvements in capabilities were achieved.
It is expected that efficiencies gained through DOD’s financial management and audit readiness
efforts will continue to result in benefits, such as those realized by the Marine Corps current
financial improvement efforts. The Marine Corps recently realized approximately $3 for every $1 it
invested in improvements to its rudimentary financial operations. Other government organizations
have also seen cost savings with similar improvements.
78
http://www.defense.gov/releases/release.aspx?releaseid=13782
79
Department of Defense, Transcript Press Conference with Secretary of Defense Robert M. Gates, August 9, 2010;
http://www.defense.gov/transcripts/transcript.aspx?transcriptid=4669.
DOD, Transcript, Press Conference with Secretary of Robert M. Gates and Under Secretary of Defense Ashton Carter, “Acquisition Initiatives,” 9-
14-10; http://www.defense.gov/transcripts/transcript.aspx?transcriptid=4684; Ashton Carter, Memorandum for Acquisition Professionals,
“Better Buying Power: Guidance for Obtaining Greater Efficiency and Productivity in Defense Spending,” September 14, 2010.
2015
$100.1
2015
$28.0
17. DRAFT DOCUMENT
ALL NUMBERS ARE FC STAFF ESTIMATES BASED ON CBO AND OTHER SOURCES
40. Freeze federal salaries, bonuses, and other compensation for the civilian workforce at
the Department of Defense for three years.80
decline. In contrast, Department of Defense civilian employees (along with their counterparts at
other federal agencies) have seen their wages increase due to automatic formulas in law that
provide them with step-in-grade and cost-of-living-adjustments. For example, DOD civilian
employees received a 2.0 percent increase in 2010 and a 3.9 percent raise in 2009.
During the Great Recession, most private
sector employees have seen their wages frozen, and some even have watched wages
81
This proposal
would institute a three-year DOD freeze on federal civilian pay, including salaries and those benefits
linked to pay raises, to reflect the current economic and fiscal climate.
The following estimate assumes for FY2012 through FY2015 a 2.3 percent increase on a $74 billion
base.82
Fiscal Year 2012 Freeze 2013 Freeze 2014 Freeze Cumulative Annual Savings
2012 $1.7 NA NA $1.7
2013 $1.7 $1.7 NA $3.4
2014 $1.7 $1.7 $1.7 $5.1
2015 $1.8 $1.8 $1.7 $5.3
5 year total $6.9 $5.2 3.4 $15.5
41. Freeze non-combat military pay at 2011 levels for 3 years.83
along with the allowances, is expected to grow by $9.2 billion from 2011 to 2015. A three-year
freeze at 2011 levels for these compensation categories would save the federal government $7.6
billion in compensation and tax expenditures, as well as another $1.6 billion in less retirement
accrual, or $9.2 billion total discretionary savings in 2015.
Regular Military
Compensation (excluding combat pay) for military personnel, which includes basic pay,
basic allowances for housing and subsistence, and federal income tax advantages that go
42. Double Secretary Gates’ cuts to defense contracting.84
These staff augmentees are only a small subset of the Defense Department’s nearly 1 million total
contractor personnel, who provide a myriad of services ranging from fixing weapon systems to
mowing the grass on defense bases, and cost about $200 billion.
In Secretary Gates’ recently
launched efficiencies initiative, he proposes to cut spending for contractor personnel who
aid or augment defense headquarters staff by 10 percent each year from FY2011-FY2013.
85
DOD has been particularly
concerned about staff augmentees, which make up about $20 billion of the Defense Department’s
$154 billion in contractor costs. While staff augmentees support Pentagon offices, they do not
produce a specific product, and their numbers have tripled in the past decade.86
80
Staff estimate.
Secretary Gates’
initiative should save about $5.4 billion in FY2015. This option seeks to double those savings. While
this reduction would cut these contractor staff from about 67,000 to 30,600 – more than half – the
81
http://comptroller.defense.gov/defbudget/fy2011/FY11_Green_Book.pdf
82
Ibid.
83
Staff estimate based on data from the Office of the Secretary of Defense FY2011 Green Book and OMB data.
84
Staff estimate.
85
Ashton Carter, “Memorandum for Acquisition Professionals, Better Buying Power: Mandate for Restoring Affordability and Productivity in
Defense Spending,” June 28, 2010 cites $200 billion for service contracting; DOD, Report to Congress required , June 2010 includes an estimate
of 766,000 service contractor personnel costing $154 billion, or an average of $200,000, per service contractor personnel.
86
Based on email from DOD.
2015
$5.3
2015
$9.2
2015
$5.4
18. DRAFT DOCUMENT
ALL NUMBERS ARE FC STAFF ESTIMATES BASED ON CBO AND OTHER SOURCES
total number of staff augmentees would still be about 40 percent larger than a decade ago. This
would decrease the total number of DOD service contractor personnel by about 4 percent.
43. Reduce procurement by 15 percent.87
procurement funds, equaling more than twice as much as annual procurement, which has increased
the service’s stock of equipment.
In its FY2011 budget, DOD estimated that
procurement spending in FY2015 would total $137.5 billion, a doubling in real terms of the
FY2000 level. Since FY2003, DOD has received an additional $214.5 billion in war-related
88
DOD’s FY2015 budget does not include war funding. A 15
percent cut would reduce FY2015 procurement by almost $20 billion to a total of $117.5 billion,
slightly below the average for the past ten years including war-related funding when adjusted for
inflation.89
Options 44-50 below suggest specific procurement cuts that could be used to help reach
a 15 percent cut.
44. End procurement of the V-22 Osprey. The V-22 Osprey was designed to meet the amphibious
assault needs of the Marine Corps, the strike rescue needs of the Navy, and the needs of long range
special operations forces (SOF) missions of U.S. Special Operations Command. However, the V-22
has had a troubled history with many developmental and maintenance problems, including critical
reports by GAO and others. Speaking on V-22 capabilities in a closing statement at the June 23, 2009
House Oversight and Government Reform Committee hearing, Rep. Edolphus Towns stated: “Our
investigation indicates we've gotten half the aircraft for three times the cost--that's not a recipe for
longevity. … It's time to put the Osprey out of its misery.”90
The proposed change to terminate
acquisition of V-22 at 288 aircraft, close to two-thirds of the planned buy, would substitute MH-60
helicopters to meet missions that require less range and speed, and could save $1.1 billion in 2015.
45. Cancel the Expeditionary Fighting Vehicle. Procurement of the Expeditionary Fighting Vehicle was
initiated 23 years ago with the goal to buy the Marine Corps 573 ship-to-shore assault vehicles for a
forcible amphibious landing at a total cost of $15.6 billion. Concerns have been raised that the new
vehicles, with their low ground clearance, would be vulnerable to Improvised Explosive Devices
(IEDs) on land and to long-range, shore-based, anti-ship cruise missiles that could be launched
against Navy’s amphibious ships when the vehicles disembark 25 miles from shore.91
In an April 17,
2009 speech at the Naval War College, the Secretary of Defense called for close examination of
whether the mission itself is necessary, saying “we have to take a hard look at where it would be
necessary or sensible to launch another major amphibious action again ... in the 21st
century.”92
Other capabilities may be more relevant in the current asymmetrical threat environment, such as
deep penetration by MV-22s, unmanned aerial vehicles for surveillance, and Special Operations
forces. This option would cancel the Expeditionary Fighting Vehicle (EFV) for savings of $650 million
in FY2015.
46. Substitute F-16 and F/A-18Es for half of the Air Force and Navy’s planned buys of F-35 fighter
aircraft. With a planned total buy of 2,443 aircraft, the F-35 or Joint Strike Fighter (JSF) is the
87
Staff re-estimates; such options have appeared in the CBO Budget Options, in the Sustainable Defense Task Force report, the CAP report “A
Thousand Cuts,” and elsewhere.
88
CRS, The Cost of Iraq, Afghanistan, and Other Global War on Terror Operations Since 9/11 by Amy Belasco, September 2, 2010, p. 33.
89
The average for procurement in FY2001-FY2010 was $109 billion, 4% more in real terms than the total with a $20 billion cut in FY2015.$117.5
billion in FY2015. Staff estimate based on Table 8-1 in DOD, FY2011 National Defense Budget Estimates, February 2010;
http://comptroller.defense.gov/defbudget/fy2011/FY11_Green_Book.pdf.
90
CRS Report R31384, V-22 Osprey Tilt-Rotor Aircraft: Background and Issues for Congress by Jeremiah Gertler, December 22, 2009, p. 46.
91
CRS, The Marines’ Expeditgionary Fighting Vehicle (EFV): Background and Issues for Congress by Andrew Feickert, September 17, 2010.
92
As quoted in Ibid, p. 6.
2015
$20.0
19. DRAFT DOCUMENT
ALL NUMBERS ARE FC STAFF ESTIMATES BASED ON CBO AND OTHER SOURCES
Defense Department’s largest weapon procurement program. This option would buy half as many as
the 369 planned for the Air Force and the 311 for the Navy, purchasing instead the current
generation fighter aircraft, the Air Force F-16 aircraft at one-third of the cost and the Navy F/A-
18E/F at two-thirds of the cost of the F-35. The unit cost of F-35 aircraft is estimated at about $133
million compared to $40 million for an F-16 and $80 million for an F-18E. The rationale for this
change would be that DOD does not need an entire fleet with the stealthy capabilities of the JSF,
and could rely instead on upgraded F-16 and F/A-18E aircraft for half of their fleet, a “high-low” mix.
This is estimated to save $2.3 billion in FY2015, and a total of $9.5 billion for FY2011-FY2015. The
option might also allow the services to upgrade their tactical air fleets sooner in case the F-35 is
delayed because of additional technical problems, since the F-16 and F-18E lines are currently open.
In 2009, CBO described a similar option that would have cancelled the F-35 program altogether.
47. Cancel the Marine Corps version of the F-35. This option would cancel the Marine Corps version of
the F-35 Joint Strike Fighter because of its technical problems, cost overruns, schedule delays, and
the adoption by the services of joint combat support in current wartime operations. This would save
$3.9 billion in FY2015 and $17.6 billion for FY2012 - FY2015. At a total cost of $41 billion, DOD plans
to buy 311 F-35Bs for the Marine Corps to replace the Marine Corps AV-8B. In its recent defense
review, the United Kingdom decided to cancel its buy of the Marine Corps version of the JSF.
Further, the sophisticated capabilities of the JSF may be less relevant in current scenarios. Under
Secretary of the Navy Robert Workman observed that greater use of guided missiles and mortar
could end the forward operations that would be performed by the Marine Corps JSF because of
vulnerability.93
Also, because the Marine Corps version of the JSF has been responsible for most of
the technical, cost, and schedule problems, cancelling it could accelerate delivery of the Air Force (F-
35A) and Navy (F-35C) versions.
48. Cancel the Navy’s Future Maritime Prepositioning Force. Some defense experts suggest that the
Navy’s Future Maritime Prepositioning Force program, or “sea-basing,” intended to provide an
independent capacity to transport equipment and supplies from a Mobile Landing Platform with a
new Joint High Speed Vehicle, faces very difficult technical challenges, and that the ability to
transport and sustain one Marine brigade of about 4,000 may not be worth the expense. Despite
the lack of adequate ports and infrastructure, operations in Iraq and Afghanistan, as well as various
recent humanitarian efforts, have been sustained with the current mix of prepositioned ships,
amphibious support and Landing Craft Air Cushion ships. Canceling the new program would save
$1.0 billion in FY2015 and $2.7 billion from FY2012-FY2015.
49. Cancel the new Joint Light Tactical Vehicle (JLTV), the Ground Combat Vehicle, and the Joint
Tactical Radio. In this option, the Army would continue to upgrade its current fleet of tactical
vehicles, and those vehicles would continue to meet Army goals in terms of years of service. The
option would delay until after 2015 plans to develop and buy the proposed new Ground Combat
Vehicle until requirements are better defined, the Joint Tactical Vehicle until the duplication issue is
resolved, and the Joint Tactical Radio until technical problems are resolved. The risk of delaying
Army modernization of its tactical vehicle fleet is low because wartime funding enabled the Army to
upgrade its current tactical vehicle fleet earlier than anticipated. For FY2003–FY2007, the Army
budgeted some $86.5 billion in procurement but received $141.5 billion in those same years, 63
percent more than anticipated, including substantial amounts for HMMWVs, MRAPs, trucks,
SINCGAR radios, and other procurement allowing it to modernize its inventory sooner than
93
Aviation Week, “Marines Ready but is JSF?” October 1, 2010.
20. DRAFT DOCUMENT
ALL NUMBERS ARE FC STAFF ESTIMATES BASED ON CBO AND OTHER SOURCES
planned.94
Based on the Army’s report to Congress, “Army Truck Program: Tactical Wheeled Vehicle
Acquisition Strategy,” the Army has already reached its requirements for FY2017 for its light,
medium, and heavy tactical vehicles, earlier than anticipated because battle losses, maintenance
washouts and vehicles left in theater were lower than anticipated.95
In light of this situation, it is not
clear why the Army needs to buy the new Light Tactical Vehicles at this time. The Army’s Ground
Combat Vehicle program is the successor to the Army’s Manned Ground Vehicle Program, part of
the ambitious Future Combat System, which Secretary Gates cancelled in April 2009.96
The Army
continues to have difficulty defining its requirement, cancelling its August 2010 Request for
Proposal, and is facing congressional skepticism as well. The Joint Tactical Radio has longstanding
technical problems, which do not appear to have been resolved. This option would save $2.3 billion
in 2015.
50. Reduce planned levels for "Other Procurement.” The category of Other Procurement is expected to
reach $38.6 billion in FY2015. This option reduces that amount to $30.1 billion to reflect the buildup
of inventory over the past ten years because of substantial war-time funding, and the prospect that
the number of U.S. deployed troops may decline by 2015. The option would set funding for each
service at 50 percent above the FY2000 level. Between FY2001 and FY2010, DOD received $400
billion in funding (in FY2011 dollars) for Other Procurement, a category that includes
communications and electronic equipment (e.g., tactical SINCGARs radios, radars, communications
and information security), tactical vehicles (e.g., High Mobility Multipurpose Wheeled Vehicles or
HMMWV trucks, armored security vehicles, trailers, materials handling equipment, ship support
equipment) and other support equipment and spares (e.g., night vision goggles). Averaging $40
billion a year, this wartime funding level is double the amount received in FY2000 in real terms.97
Although one of the lessons learned from the Afghan and Iraq wars is that much more of this type of
support equipment is needed to carry out operations, current budgeting assumes annual levels
would decline slightly to $37 billion, close to the $40 billion average of the past ten years. This plan
does not appear to take into account the buildup of equipment inventory in the past ten years and
the likelihood that the current level of deployed forces may decrease based on the agreement with
Iraq to remove all U.S. troops by December 2011 and the possibility that force levels in Afghanistan
may fall in later years based on the President’s commitment to begin the re-deployment of U.S.
forces in July 2011.
51. Reduce military personnel stationed at overseas bases in Europe and Asia by one-third.98
$8.5 billion in 2015,
The United States permanently stations about 150,000 military personnel in the hundreds
of U.S. bases in Europe and Asia. Reducing this presence by one-third would save around
99
while still maintaining a substantial military force on both continents.100
94
DOD budget data comparing budgeted and actual by service, account, and system.
The
Army has considered reducing its four combat brigades in Europe to two, but presently the budget
95
Department of the Army, “Report to Congress, Army Truck Program: Tactical Wheeled Vehicle Acquisition Strategy,” June 2010, as required
by Explanatory statement in Division A of DOD Appropriations Act, 2010 (P>L. 1111-118), p. 15 and p. 18.
96
CRS, Army Future Combat System ()FCS) “Spin Outs” and Ground Combat Vehicle (GCV): Background and Issues for Congress by Andrew
Feickert, November 30, 2009, p. 1.
97
Staff estimates based on Table 6-6 in DOD, National Defense Budget Estimates, FY2003-FY2010 editions;
http://comptroller.defense.gov/Budget2010.html, other fiscal years years available on legacy site at
http://comptroller.defense.gov/Budget2011.html; for Marine Corps, see Marine Corps, Justification for Procurement, Marine Corps, FY2003-
FY2011; http://www.finance.hq.navy.mil/FMB/02pres/PROC/PMC_Book.pdf ; other years available at Marine Corps budget site.
98
Staff estimate. In 2009, Jones suggested closing 20% of bases, and Rumsfeld suggested that we could save up to $12 billion by closing 200 to
300 bases alone.
99
Staff estimate.
100
Michael Ettlinger and Michael Linden. “A Thousand Cuts.” Center for American Progress, September 2010.
2015
$8.5
21. DRAFT DOCUMENT
ALL NUMBERS ARE FC STAFF ESTIMATES BASED ON CBO AND OTHER SOURCES
includes funds for current force levels, likely to result in a reduction of about 33,000 in Europe and
another 17,000 in Korea. Since only a minority of the forces in Europe deploy for the Afghan and
Iraq wars, the additional forces required to support overseas stationing does not seem cost-
effective, and the services have sufficient air and sea assets to deploy forces from the United States.
This option would also reduce force levels in Korea as well as reverse the Defense Department’s
current plans to build up the infrastructure in Korea to support dependents in support of a new
policy to convert the longstanding policy of one year unaccompanied tours to a three-year tour with
dependents. Variants of this option were supported in 2009 by both former Secretary of Defense
Donald Rumsfeld and National Security Adviser Jim Jones.
52. Modernize Tricare, DOD health.101
for DOD’s modernization and other defense needs. In recent years, a variety of proposals have been
made to raise annual enrollment fees, co-pays and deductibles to reflect inflation, where currently
military retirees with family policies pay far below national averages, generally paying no premiums,
and paying deductibles of $150 to $300 a year compared to national averages ranging from $600 to
$1,000 depending on the type of plan.
Secretary Gates has raised concerns for some years that
the rapidly rising cost of military health care – increasing from $17.5 billion in FY2000 to
$47.4 billion in FY2010, with a doubling in real terms by FY2020 – will “crowd out” funding
102
According to CBO, DOD’s FY2009 proposal to raise
enrollment fees, deductibles and co-pays to adjust for inflation, though still well below national
averages, would save the Department of Defense about $6 billion in 2015, much of it reflecting
decisions by military retirees to drop TRICARE coverage.103
Congress rejected these proposals in
response to concerns raised by DOD’s retiree population, who make up 57% of the beneficiaries and
account for 65% of the cost.104
The proposed new option would raise premiums and co-pays by
smaller amounts than in previous proposals, but would reduce costs for the government primarily
by requiring that employers reimburse the government for the employer share of health care costs
of working age retirees who opt for TRICARE instead of relying on the employer’s policy. This would
eliminate a subsidy by the government for what is a normal business expense, and provide the
government with about $3 billion.
In addition, to improve DOD’s management of health care, and prevent TRICARE from being charged
for expenses that could be covered by an employer plan in cases when TRICARE is the secondary
payer, this option would require that all beneficiaries pay a modest enrollment fee for each of the
three TRICARE plans, and designate whether they are using TRICARE as their primary insurer or as a
wraparound policy. To reduce higher than average usage of health care by families of service
members, the option would also raise co-pays for office visits from their current low levels closer to
national averages. To curb expansion of benefits, this option would also require that even though
DOD’s medical health care expenses are carried in discretionary accounts, PAYGO provisions would
apply so that any proposal to increase TRICARE benefits would have to be offset by increases in
premiums, co-pays, or deductibles.
101
Congressional Budget Office. “The Effects of Proposals to Increase Cost Sharing in TRICARE.” June 2009,p. 3.
102
See Department of Defense, “Task Force on the Future of Military Health Care,” Report of the 10th
Quadrennial Review of Military
Compensation, and CBO, The Effects of proposals to increase Cost Sharing in TRICARE, June 2009 have all presented ways to reform DOD’s
TRICARE health insurance in recent years; see “Report of Tenth Quadrennial Review of Military Compensation, all volumes;
http://www.whs.mil/library/doc/Tenth.pdf. and http://www.defense.gov/news/QRMCreport.pdf. CBO, Health Options, Volume I, December
2009; http://www.cbo.gov/ftpdocs/99xx/doc9925/12-18-HealthOptions.pdf; CBO, The Effects of Proposals to Increase Cost Sharing in TRICARE,
June 2009; http://www.cbo.gov/ftpdocs/102xx/doc10261/TRICARE.pdf.
103
CBO, The Effects of Proposals to Increase Cost Sharing in TRICARE, June 2009; http://www.cbo.gov/ftpdocs/102xx/doc10261/TRICARE.pdf.
104
CRS, RL33537, Military Health Care: Questions and Answers, by Don Jansen, 5-14-09, summary and p.12.
2015
$6.0
22. DRAFT DOCUMENT
ALL NUMBERS ARE FC STAFF ESTIMATES BASED ON CBO AND OTHER SOURCES
53. Replace military personnel performing commercial activities with civilians.105
activities such as intelligence, maintenance, and combat equipment management to commercial
activities such as installation support (trash, fire prevention), supply, transportation, and
communications services, and morale, welfare, and recreation support. This option eliminates
88,000 military personnel who are performing clearly commercial types of activities and replaces
them with 62,000 civilians, at considerable per-employee savings.
As required
by the Federal Activities Inventory Reform (FAIR) Act, DOD reports annually on the number
and types of positions occupied by military personnel, ranging from clearly military
106
One-third of the military
positions can be eliminated during the conversion because civilians are not required to carry out
military specific duties on top of their commercial duties.107
This option is similar to a Defense
Business Board proposal that recommended cutting 34,000 military personnel in commercial
activities to reduce DOD overhead.108
Instead, this option standardizes the share of military
performing these commercial types of work, adopting the lowest rate of military participation
among the services, and converting the number of positions above that level to cheaper civilian
slots. This option would save $5.4 billion in 2015.
54. Reduce spending on Research, Development, Test & Evaluation by 10 percent.109
does not appear to be consistent with proposals by Secretary Gates to re-orient DOD modernization
to counter-insurgency warfare with, for example, an emphasis on sensing devices and intelligence
gathering to counter home-made improvised explosive devices (IEDs), which would be expected to
be less expensive than developing follow-on systems for major weapon systems. This would still
leave DOD with a level above the peak of the Reagan years in real systems (adjusted for inflation).
RDT&E spending could be reduced by slowing ongoing projects and cancelling particular projects
such as those associated with marginal procurement programs identified above such as the Marine
Corps version of the F-35 ($135 million in FY2015, $1.6 billion for FY2012-FY2015), the Joint Light
Tactical Vehicle ($128 million in FY2015, $1.1 billion from FY2012-FY2015), Joint Tactical Radio
($177 million in FY2015, $1.7 billion from FY2012-FY2015), as well as cancelling funding for upgrades
of newly-deployed systems such as the F-22 fighter aircraft ($106 million in FY2015 and $828 million
for FY2012-FY2015), and the Air Force F-35 ($54 million in FY2012 and $354 million in FY2012-
FY2015).
This
option would reduce the Defense Department’s Research, Development, Test and
Evaluation budget by 10 percent, saving $7 billion in 2015. The currently high level of RDT&E
110
55. Reduce spending on base support.111
105
The $5.4 billion 2015 estimate is a staff estimate, based on the work of the Defense Business Board. A similar option has been proposed by
CBO.
This option would reduce base support spending by
$2.0 billion, or 10 percent of estimated 2015 level, by standardizing spending per troop
among the services, which appears to be in line with a recommendation by Under Secretary
106
GAO has found that military personnel cost considerably more than civilians, a conclusion confirmed by staff estimates, which take into
account compensation, defense health costs, and operation and maintenance support costs of military personnel, only a portion of which is
estimated to decrease as with fewer military personnel.
107
CBO Budget Options Volume 2, Option 050-17, “Replace Miliary Personnel in Some Support Positions with Civilian Employees of the
Department of Defense; http://www.cbo.gov/ftpdocs/102xx/doc10294/08-06-BudgetOptions.pdf.
108
Defense Business Board, Reducing Overhead and Improving Business Operations: Initial Observations, “ July 22, 2010.
109
Staff estimate based on recommendations to cut the RDT&E budget by Cato, the Sustainable Defense Task Force, and the Center for
American Progress.
110
Figures from R-2, FY2011 Descriptive Summaries for RDT&E for Army, Navy, and Air Force Research and Development Programs; see under
each service, http://comptroller.defense.gov/Budget2011.html.
111
Staff estimate.
2015
$5.4
2015
$7.0
2015
$2.0
23. DRAFT DOCUMENT
ALL NUMBERS ARE FC STAFF ESTIMATES BASED ON CBO AND OTHER SOURCES
of Defense, Ashton Carter to adopt a “uniform taxonomy for different types of services.”112
This
could encourage cross-servicing. Service spending on base support (cutting grass, providing
electricity, etc.) varies among the services from a low of $10,800 per troop in the U.S. Marine Corps
to $15,700 per troop in the Air Force in 2011. While DOD has set common support standards and
the Army and Navy have set up separate commands to administer base support, this appears to
have generally led to higher standards and it is not clear why costs per troop should vary so much.
Including savings in the budget for base support could encourage the services to adopt best
practices and regionalize base support across services, and use a civilian organization rather than a
military command.
56. Reduce spending on facilities maintenance.113
square footage resulting from the completion of base closures in the past ten years. While square
footage fell by 21 percent, spending increased by 18 percent in real terms. Spending for facilities
maintenance is now at close to 100 percent of requirements, and the services have also benefited
from additional funding provided in base closure funds for consolidations. A lower level is further
justified because there will be additional decreases in buildings to maintain when the 2005 base
closures are completed.
This option would reduce facilities
maintenance spending on buildings by $1.4 billion or 18 percent below the $7.7 billion
estimated for 2015. The services have not reduced spending in concert with the decrease in
57. Consolidate the Department of Defense’s retail activities.114
option, as has been suggested by CBO, would consolidate these retail systems into one network
over a five-year period in order to increase efficiency. This would save about $1.7 billion annually, if
the new exchanges raised prices 5 percent on average. It has been suggested that some of this
savings could be returned to military families in the form of a $600 grocery allowance, which would
more than offset the 5 percent increase in prices. This would leave over $800 million in DOD savings
annually. One argument against the grocery allowance is that the exchanges would still be able to
offer below-market prices for goods.
The Department of Defense
operates four retail systems on military bases: commissaries for groceries, which are the
same across all three branches, and three separate exchanges, one for each branch. This
58. Integrate children of military personnel into local schools in the United States. The
Department of Defense currently runs two school systems for children of military personnel
– one for children of military personnel stationed overseas, and another, the Domestic
Dependent Elementary and Secondary Schools (DDESS) system, which operates 58 primary and
secondary schools for 19,324 students in Alabama, Georgia, New York, North Carolina, South
Carolina and Virginia. These domestic schools exist despite the fact that nearly all military members
live off base and send their children to local schools. The program was initially established when
schools in the South were segregated, however it is no longer clear why the system is still necessary,
or why the Defense Department plans to spend $1.2 billion for FY2011-FY2015 to rebuild these
schools, raising the cost per student from $51,000 in FY2011 to $81,000 in FY2015.115
112
Ashton Carter, “Memorandum for Acquisition Professionals, Better Buying Power: Mandate for Restoring Affordability and Productivity in
Defense Spending,” June 28, 2010 .
Instead, these
113
Staff estimate.
114
CBO Budget Options Volume 2.
115
Staff estimate based on FY2011 DODEA MILCON Budget, excluding funding for Puerto Rico, Cuba, Guam and Overseas Bases. DOD, Fiscal
Year 2011, Department of Defense Dependents Education (DODDE), Operation and Maintenance, Defensewide, February 2010;
ttp://comptroller.defense.gov/defbudget/fy2011/budget_justification/pdfs/01_Operation_and_Maintenance/O_M_VOL_1_PARTS/DoDDE_FY1
1.pdf.
2015
$1.4
2015
$0.8
2015
$1.1
24. DRAFT DOCUMENT
ALL NUMBERS ARE FC STAFF ESTIMATES BASED ON CBO AND OTHER SOURCES
students could be integrated into local schools and the rebuilding plans cancelled, which would
achieve $1.1 billion of savings in 2015. To reimburse school districts for these additional students,
the option includes $14,000 for an allowance to cover the cost of additional students as well as
Impact Aid, a payment to compensate local governments for the loss of property tax revenues
because of military bases. In some cases, there will be only a small number of additional students.
In other cases, DOD may be able to turn over schools located at the edge of military bases to the
local educational district.
CBO Budget Options Vol II, August 2009, (050-20), Substitute Dependent Education Allowances for Domestic On-Base Schools CBO Budget
Options, February 2005 (050-31), Eliminate the Department of Defense's Elementary and Secondary Schools. DOD, Fiscal Year 2011,
Department of Defense Dependents Education (DODDE), Operation and Maintenance, Defensewide, February 2010;
ttp://comptroller.defense.gov/defbudget/fy2011/budget_justification/pdfs/01_Operation_and_Maintenance/O_M_VOL_1_PARTS/DoDDE_FY1
1.pdf