Downloaded 27 times
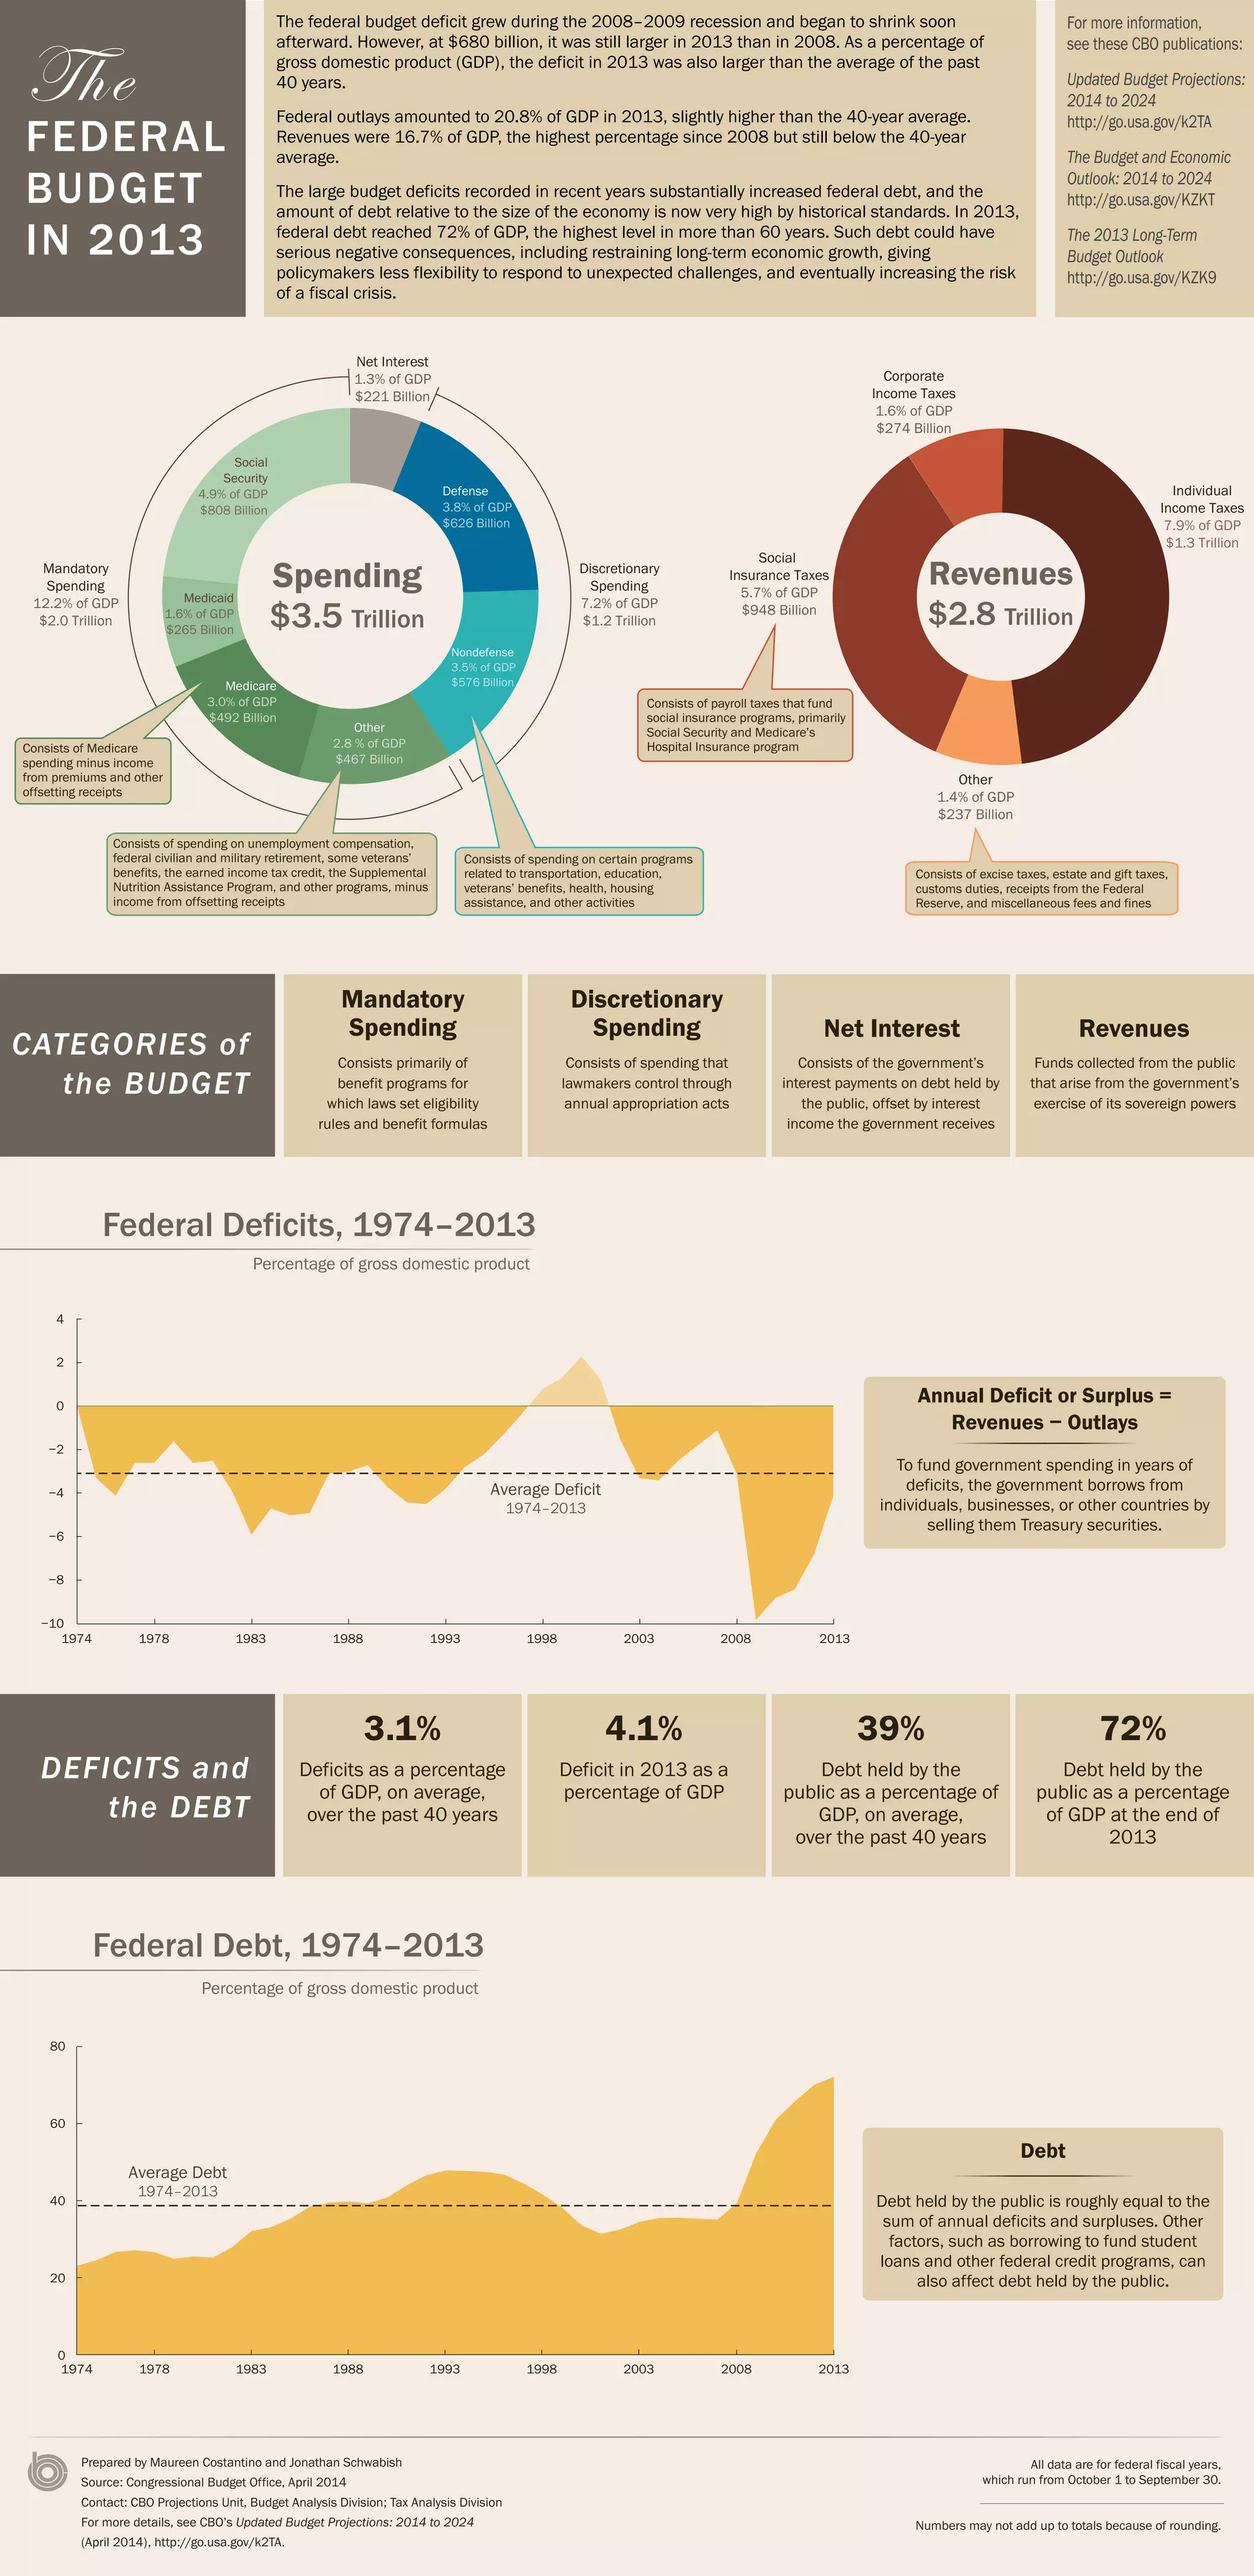

The federal budget deficit grew during the 2008-2009 recession and remained larger in 2013 than in 2008, amounting to $680 billion or 4.1% of GDP. Federal spending was 20.8% of GDP in 2013, slightly above the 40-year average, while revenues were 16.7% of GDP. Large budget deficits in recent years substantially increased federal debt held by the public to 72% of GDP in 2013, the highest level in over 60 years, which could negatively impact long-term economic growth.


