This study focuses on identifying a threshold for the distance design-based direct class cohesion (D3C2) metric in software design, highlighting cohesion as a key quality indicator in component design. The research shows that a threshold value of 0.41 indicates an adequate level of cohesion, leading to better maintainability and understanding of software components. The findings aim to assist practitioners in evaluating and improving cohesion in their software design processes.
![International Journal of Electrical and Computer Engineering (IJECE)
Vol. 8, No. 6, December 2018, pp. 5318~5325
ISSN: 2088-8708, DOI: 10.11591/ijece.v8i6.pp5318-5325 5318
Journal homepage: http://iaesjournal.com/online/index.php/IJECE
Identifying Thresholds for Distance Design-based Direct Class
Cohesion (D3C2) Metrics
Denny Sagita1
, Fajar Pradana2
, Bayu Priyambadha3
1, 3
Informatic Engineering, Faculty of Computer Science, Brawijaya University, Indonesia
2
Information System, Faculty of Computer Science, Brawijaya University, Indonesia
Article Info ABSTRACT
Article history:
Received Mar 3, 2018
Revised Jul 20, 2018
Accepted Jul 22, 2018
In the several phases of activity in developing a software system, there is
design phase. This phase has a purpose to determine and ensure that a
software requirement can be realized in accordance with customer needs. The
quality of design must be a guarantee at this phase. One of an indicator of
quality design is cohesion. Cohesion is the level of relatedness between
elements in one component. A Higher value of cohesion can indicate that a
component are more modular, has own resources, and less dependent on
another component. More independent, components are easy to maintenance.
There are many metrics to count how many values of cohesion in a
component. One of metric is The Distance Design-Based Direct Class
Cohesion (D3C2). But, many practitioners are unable to apply them. Because
there is no threshold that can categories the value of cohesion. This study
aims to determine the threshold of cohesion metric based on the class
diagram. The result showed that the threshold of D3C2 metric is 0.41. 0.41 is
the value that has the highest level of agreement with the design expert.
Keyword:
Cohesion
Metric
Quality
Software System
Threshold
Copyright © 2016 Institute of Advanced Engineering and Science.
All rights reserved.
Corresponding Author:
Fajar Pradana,
Informatic Engineering,
Brawijaya University,
8 Veteran Road, 65145, Malang, Indonesia.
Email: fajar.p@ub.ac.id
1. INTRODUCTION
Software engineering offers a way to develop the qualified software. There are several phases of
activity we have to do with an orderly manner. The design system is the second phase that needs to be passed
in the software development process. The design phase is an important to determine and ensure that a
software requirement can be realized in accordance with customer needs. The good design can be measured
from the cohesiveness of the elements in the one component [1]–[3]. High cohesion can increase the
stickiness of the elements in one module or component. More sticky between elements can make a
component hard to be separated [2]. High cohesion can produce an individual component that has individual
resources. The effort that needed in modification or maintenance of component is low, because of the low of
the impact of the component to the other component. With higher cohesion, a component is more
understandable, modifiable, and maintainable [2], [3]. Another side, cohesion is evenly used as an indicator
of the vulnerability of the system [4].
Because of the importance of the value of cohesion, there are many researchers that have proposed a
method for measuring the value of cohesion using many perspectives and purposes [2]–[8]. Several
researcher works on object-oriented approach [2], [3], [5]. Class as a component in the system has a
possibility to have strong or weak dependency with other class. The dependency with other class can
influence the value of cohesion in the system. And, it also can influence the degree of understandability,
modifiability, and maintainability of the system.](https://image.slidesharecdn.com/v5822jul20jul3mar12118-201130055631/75/Identifying-Thresholds-for-Distance-Design-based-Direct-Class-Cohesion-D3C2-Metrics-1-2048.jpg)
![IJECE ISSN: 2088-8708
Identifying Thresholds for Distance Design-based Direct Class Cohesion (D3C2) Metrics (Denny Sagita)
5319
Talking about class, the class diagram is created in the design phase. The quality of the software
should be guaranteed from the very first phase of the software development process. There is a metric that
can be used in the design phase to guaranty the quality of design. The metric is based on the class diagram.
This metric is used to find out the value of cohesion between classes in the system. The metric is The
Distance Design-Based Direct Class Cohesion (D3C2) that measure the quality attributes of object-oriented
design that has the purpose to level where the class member are related [2].
But, in the reality, the existence of the theory of cohesion measurement are rarely used in the real
software development process. Although metrics are very useful, they have not been however, widely
employed in industries[9]. Because there is no threshold of cohesion that can differ the good and bad design.
There is no information about the metrics threshold that can be used by IT practitioners [11]. Software
metrics can be used to control and monitor the project execution [12].
The presence study aims to determine the threshold of metric D3C2 in order to the IT practitioners
are able to implement the metric in the process of development software system. The study produces the
framework to find out the value of cohesions threshold. The study is done using some example of a class
diagram. To find the value of the threshold, expert of class design will be involved.
2. THE DISTANCE DESIGN-BASED DIRECT CLASS COHESION (D3C2) METRIC
Cohesion metric is a measure of the quality attributes of object-oriented design and refers to the
level where class members are related. The purpose of measurement cohesion class is to get the value of the
quality of class design where a highly cohesive class is a good design [5].
Jehad [2] define a class cohesion metric called The Distance Design-Based Direct Class Cohesion
(D3C2). The D3C2 metric uses the Direct Attribute Type (DAT) matrix to measures the interaction caused
by sharing attribute type between method, interaction caused by the expected use of attribute within method
and interaction between attribute and method [2]. There are three different type of cohesion caused by three
type of interaction : Method-Method through Attribute Cohesion (MMAC), Attribute-Attribute Cohesion
(AAC), and Attribute-Method Cohesion (AMC). D3C2 metrics weighting from final calculation of MMAC,
AAC, and AMC.Tables and Figures are presented center, as shown below and cited in the manuscript.
2.1. Method-Method through Attributes Cohesion (MMAC) Metrics
MMAC is a process of calculating the data were taken from the direct matrix attribute type. This
method can produce an average value of cohesion in the program is based on a couple of methods. and it is
calculated as follows
(1)
Where x is a number of value 1 in the column, j number of the method in the matrix, and l number
of the attribute.
2.2. An Attribute-Attribute Cohesion (AAC)
AAC is a process of calculating the data were taken from the attribute matrix type. This method can
produce an average value of cohesion in the program based on the pair attributes and it is calculated as
follows
(2)
x is a number of value 1 in rows, j number of the method in the matrix, and l number of the class attribute.
2.3. Attribute-Method Cohesion (AMC)
A process of calculating the data was taken from the attribute matrix type. This method can produce
an average value of cohesion in the program based on the interaction of attributes and methods. It is
calculated as follows.](https://image.slidesharecdn.com/v5822jul20jul3mar12118-201130055631/75/Identifying-Thresholds-for-Distance-Design-based-Direct-Class-Cohesion-D3C2-Metrics-2-2048.jpg)
![ ISSN: 2088-8708
Int J Elec & Comp Eng, Vol. 8, No. 6, December 2018 : 5318 – 5325
5320
(3)
Where I number of rows in the matrix, j number of columns in the matrix, k number of the method
in the matrix l number Attribute to the matrix
2.4. The Distance Design-Based Direct Class Cohesion (D3C2) Metric
The D3C2 metric is defined as the weighted summation of the MMAC, AAC, and AMC metrics [5].
The D3C2 is defined as follows:
(4)
where MP is the number of method pairs, and AP is the a number of distinct attribute-types pairs
3. COHEN’S KAPPA COEFFICIENT
Cohen's kappa coefficient proposed by Jacob Cohen in 1960 are coefficients to evaluate the
agreement between the two assessors or assessment methods. Cohens’s kappas measure the degree of
agreement and takes into account the correct classification that may have been obtained by chance by
weighting the measured accuracies [13]. Cohen's Kappa is a method of measuring the correctness of the
data [14]. Cohen's kappa coefficient defined formally as follows:
(5)
Where Po the proportion of the similarity of observation and Pc is the proportion expected by
chance. Then, the data obtained from observations of two observers described counted to get the Kappa
coefficient. Then, the result can be interpreted as describe in Table 1.
Table 1. Interpretation Table of Kappa Coefficient [15]
Kappa Portion of Agreement
< 0 less than chance agreement
0.01 – 0.20 slight agreement
0.21 – 0.40 fair agreement
0.41 – 0.60 moderate agreement
0.61 – 0.80 substansial agreement
0.81 – 1 almost perfect agreement
4. METHODOLOGY
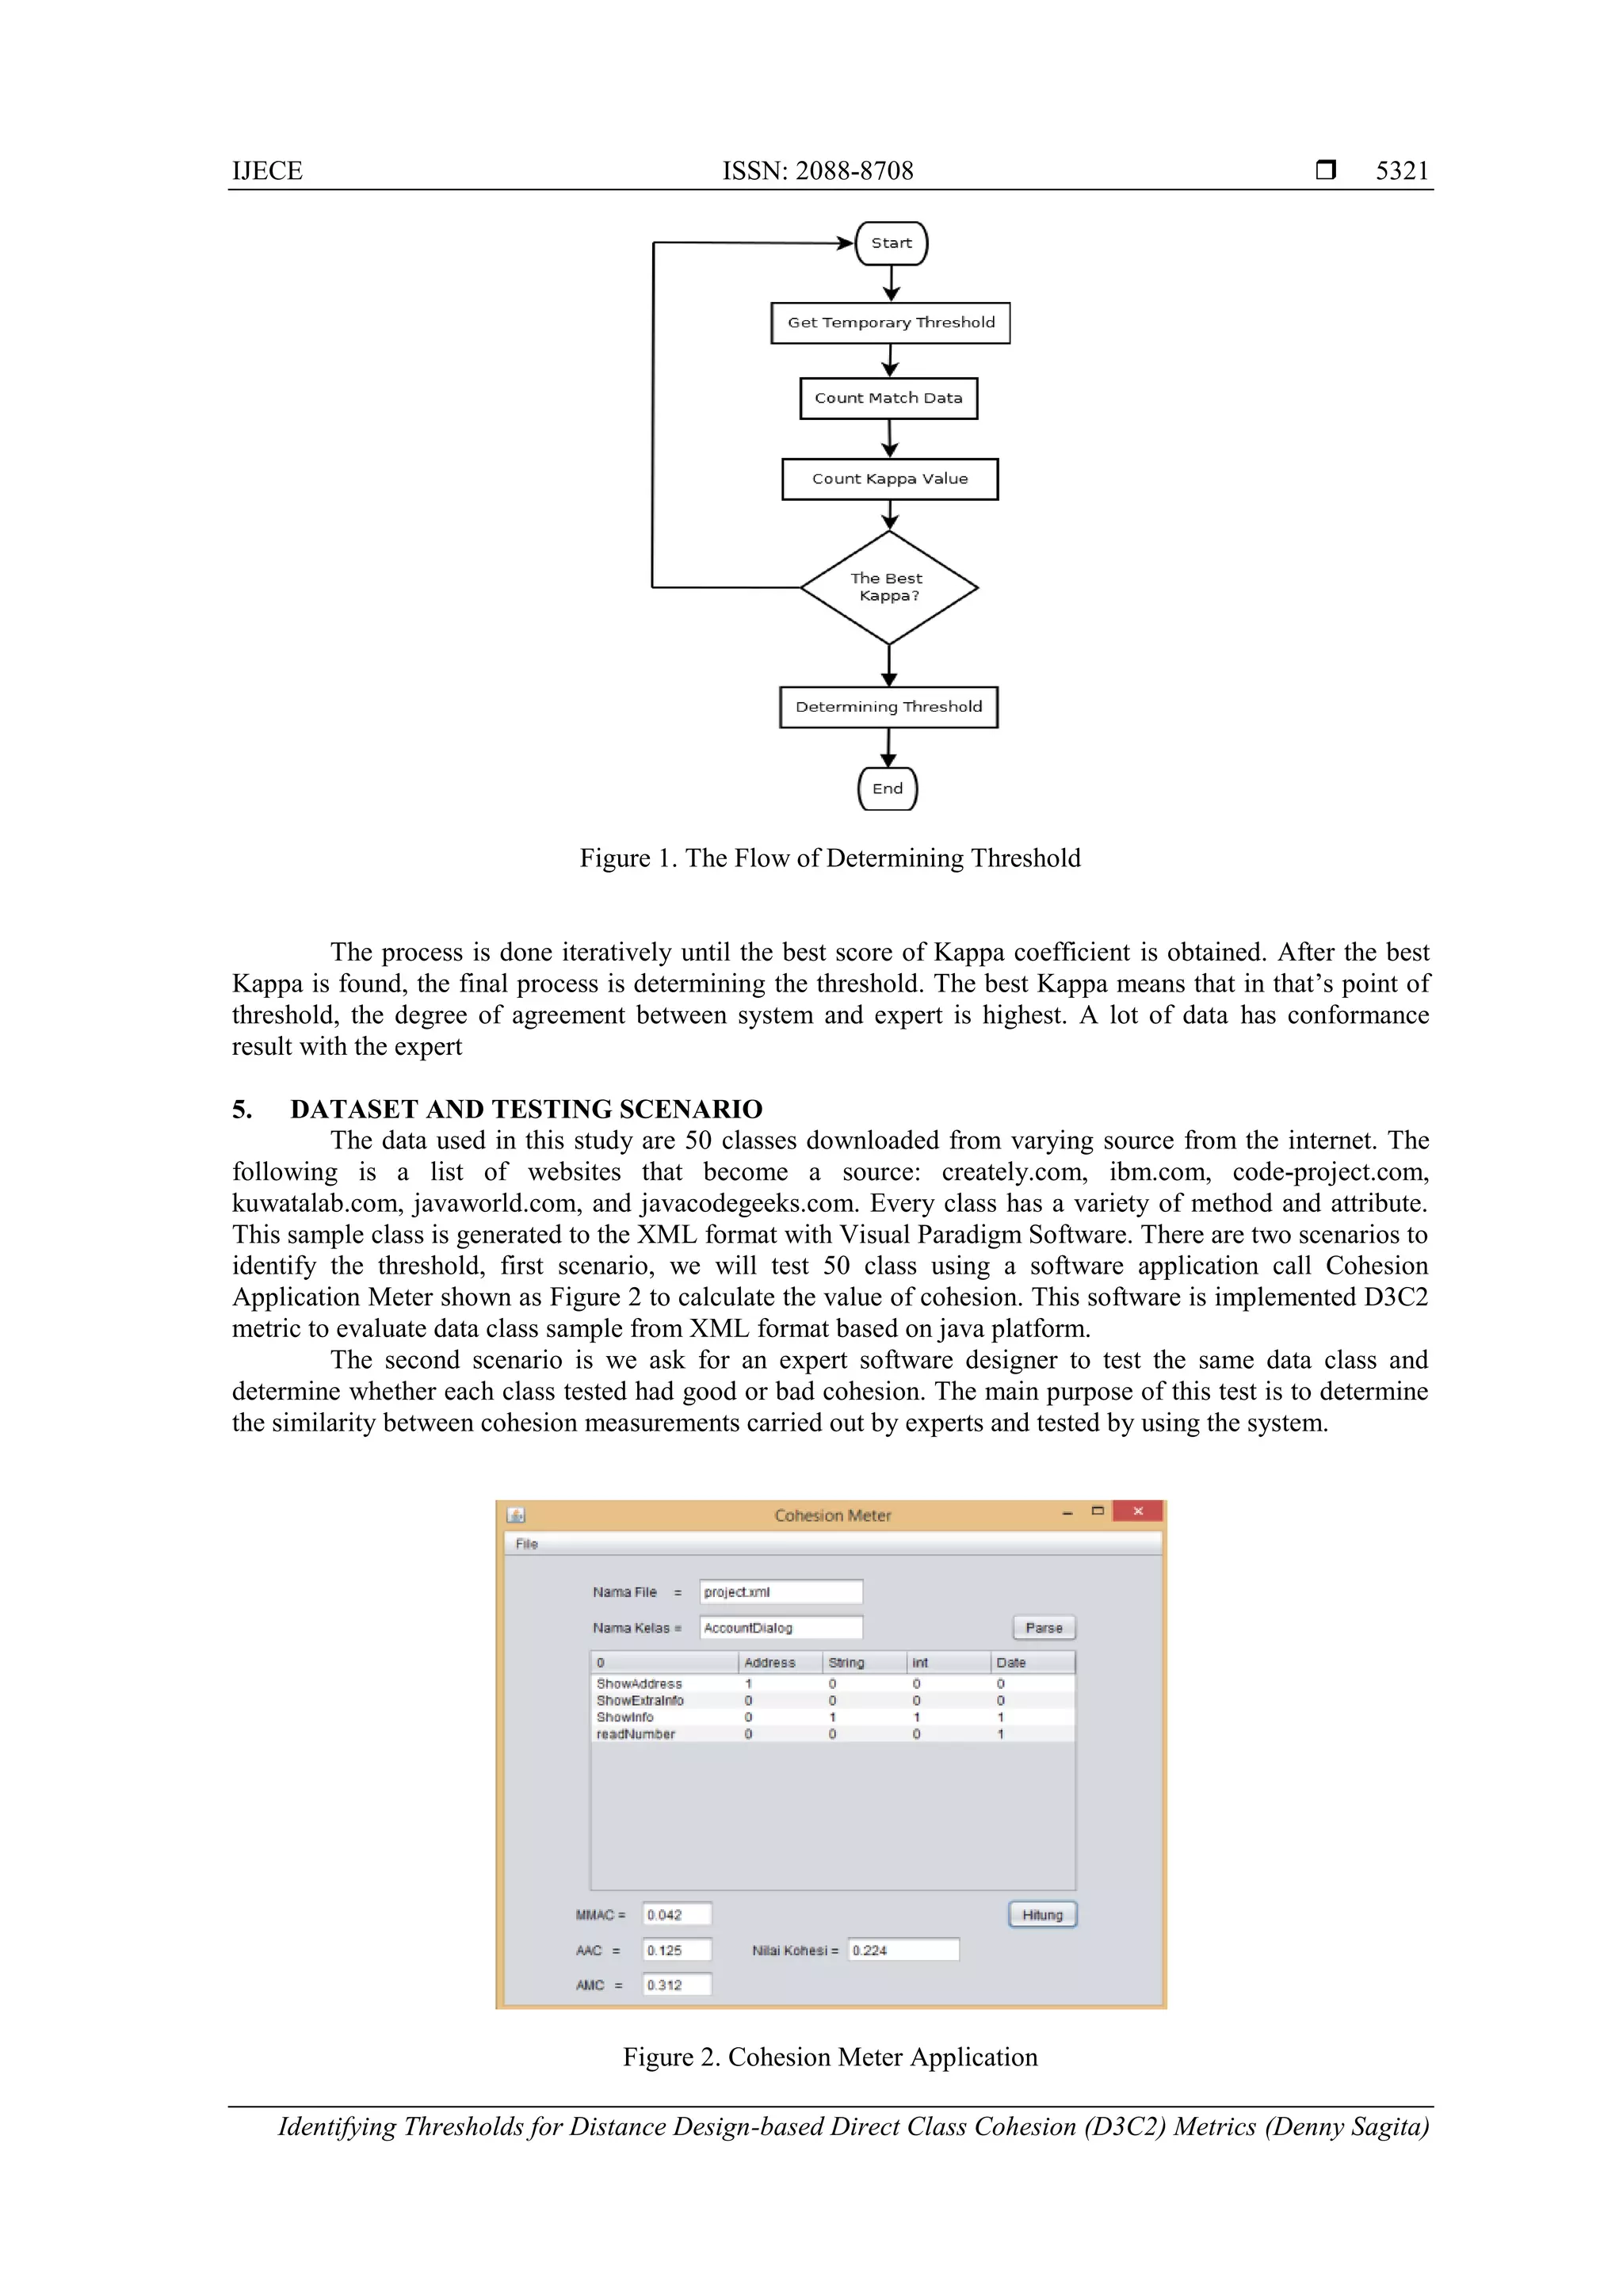
The determination of cohesion threshold is done in the iterative process. The aim is to get the
threshold of the metric value of D3C2. The value of D3C2 metric is between 0-1. We have to find out where
is the value that is a boundary between good or bad design. The expert is involved in the process of
determining the threshold. The flow of the process is described in figure 1.
To do all of the processes, we have to collect several codes that have been counted the value of
D3C2 metric. All of the codes has been labeled as a good or bad code by the expert. Then the flow that
described on Figure 1 is applied.
First is to specify the value of the temporary threshold. Based on the threshold, every code will be
labeled as good or bad. Then match the labeled code with the result from the expert. Kappa coefficients are
counted to aim the degree of agreement between labeled code and the result from an expert.](https://image.slidesharecdn.com/v5822jul20jul3mar12118-201130055631/75/Identifying-Thresholds-for-Distance-Design-based-Direct-Class-Cohesion-D3C2-Metrics-3-2048.jpg)
![ ISSN: 2088-8708
Int J Elec & Comp Eng, Vol. 8, No. 6, December 2018 : 5318 – 5325
5324
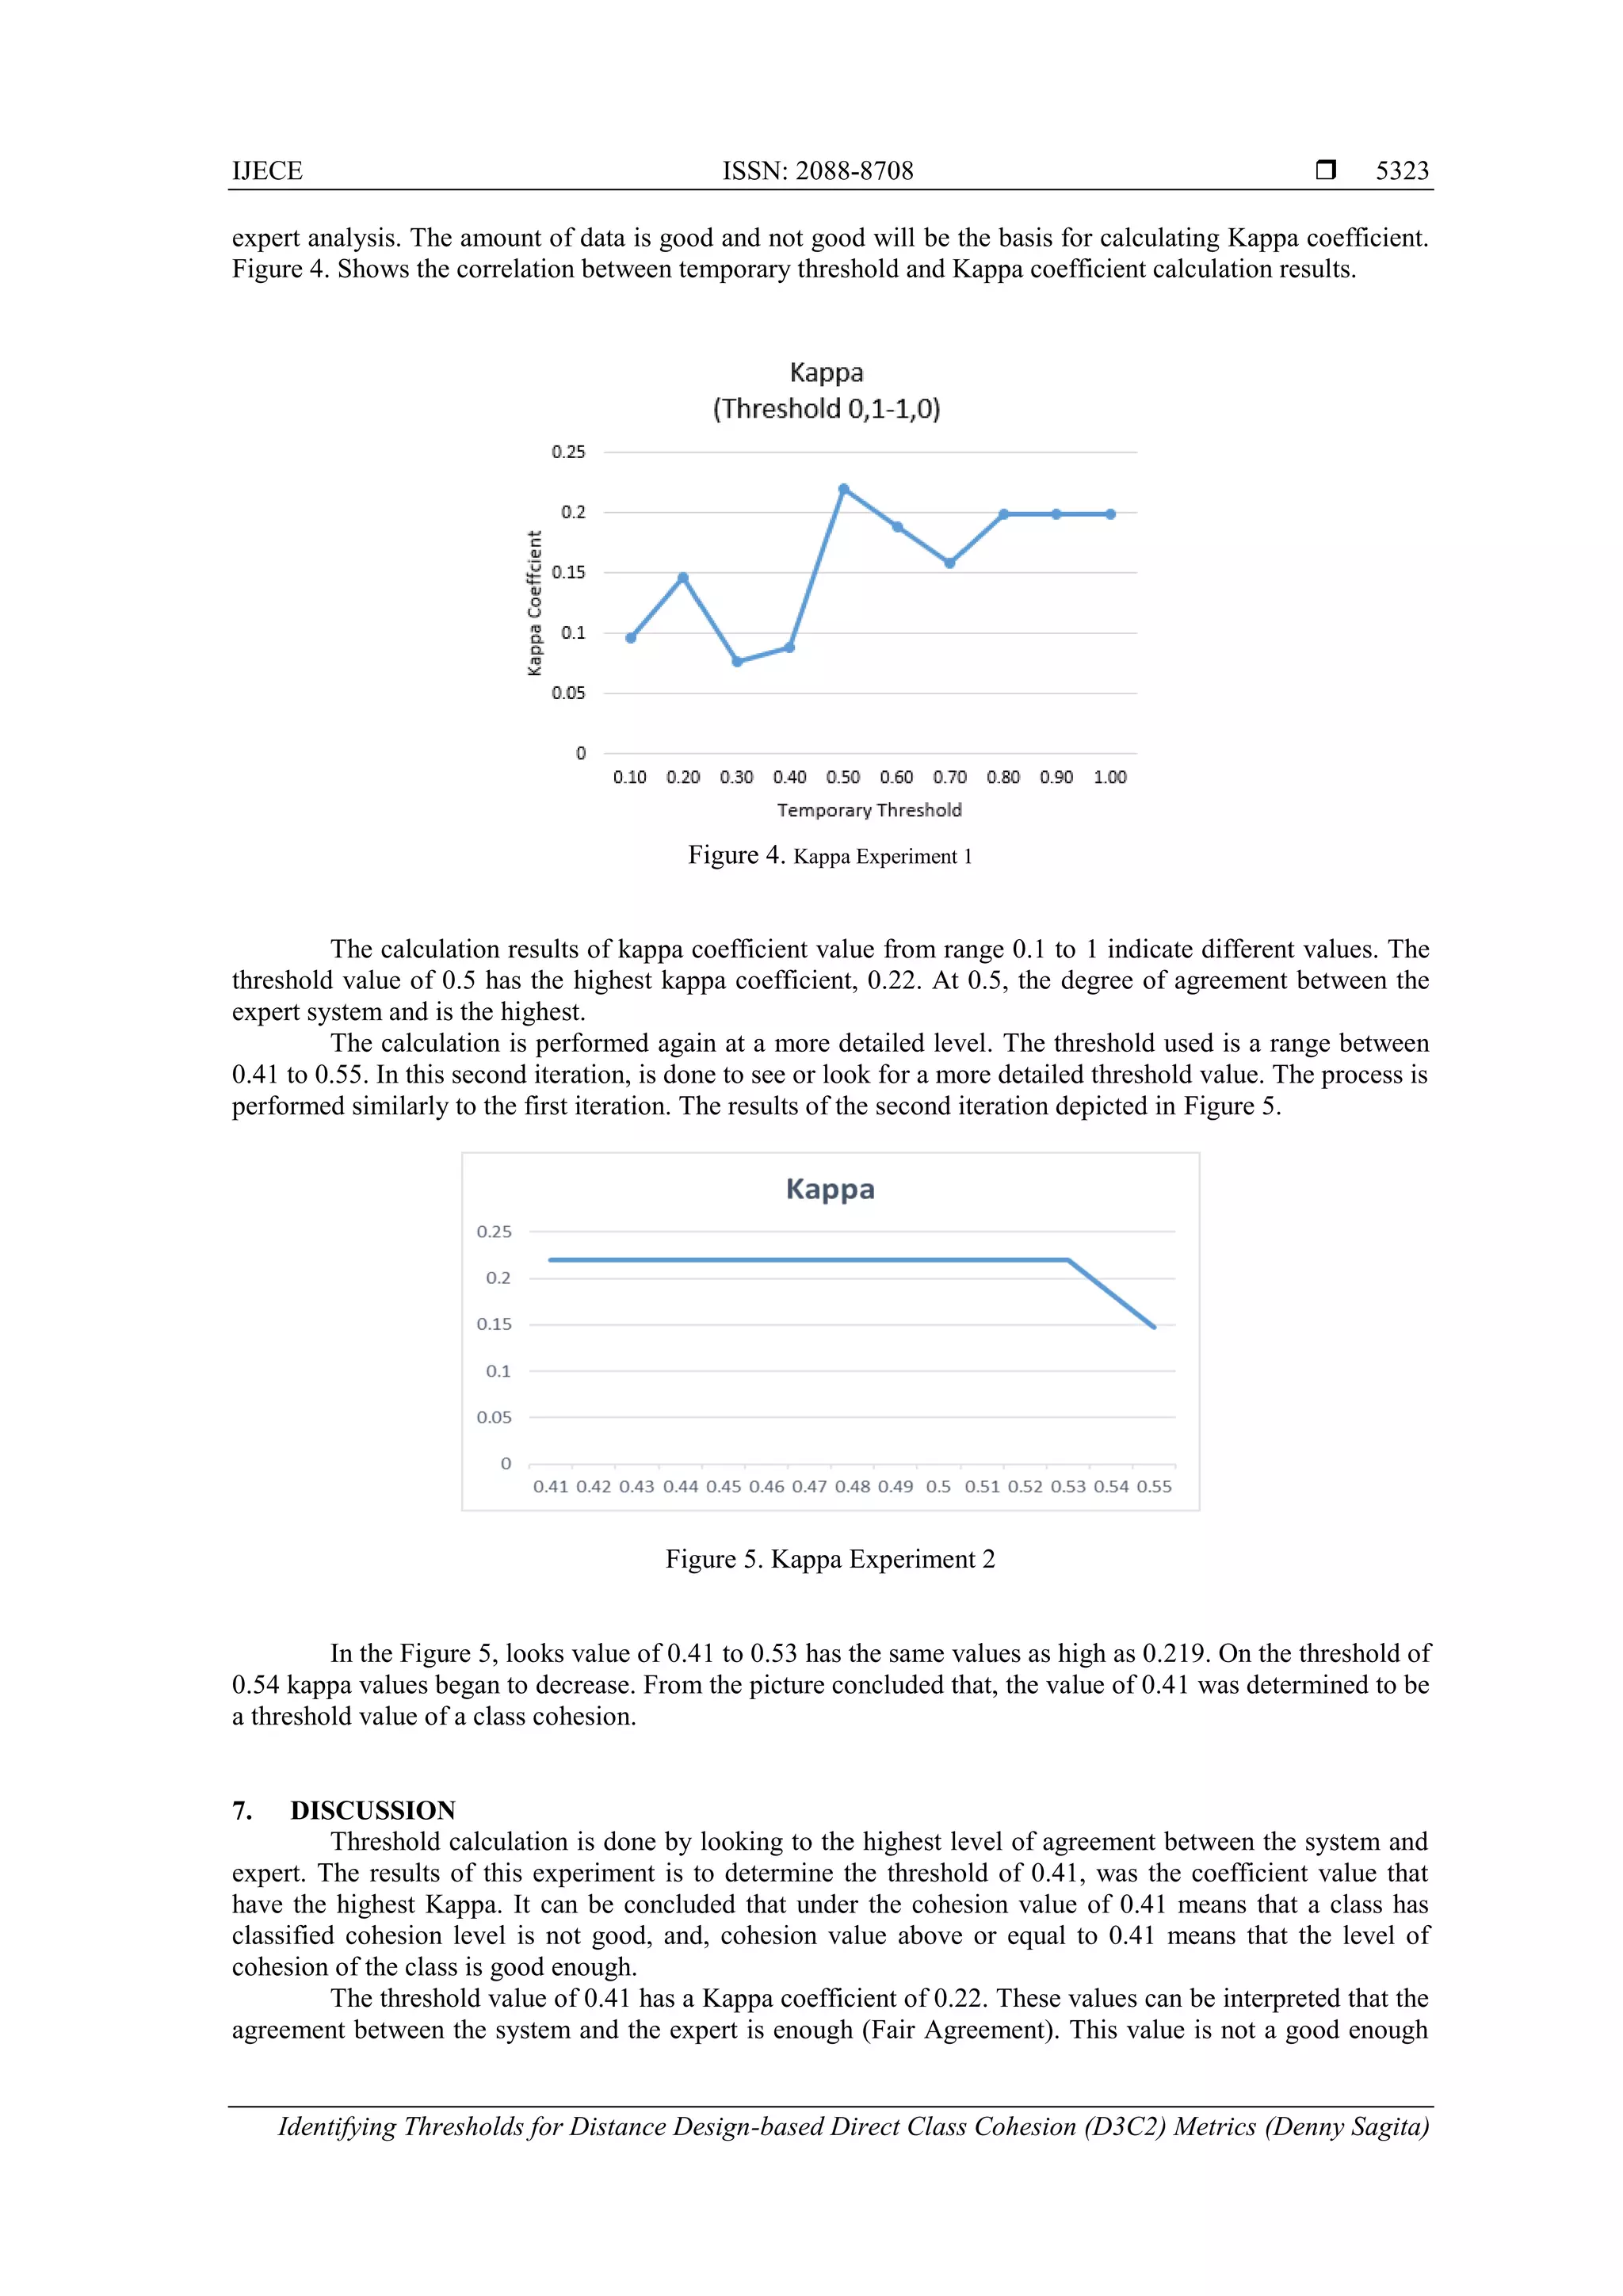
value when seen from Kappa value mapping. There is a difference of 0.78 to make so a perfect score. Some
things can be captured as a cause of disagreement between the system and the expert.
Expert assess the level of cohesion of a class based on experience. The level of cohesion of a class is
the degree of closeness between the elements in the class. These elements are the attributes and methods of a
class. If the closeness between the attributes and methods of a class higher then it can be said that a high level
of class cohesion. If all the attributes are managed by the whole method which is owned by the class, it can
be concluded that the closeness between the method and attributes is high. D3C2 Metrics only look at the
data type of the parameter from a method. If the data type of a method is the same as the data type of the
attributes of the class, then it is assumed that the method to manage these attributes.
However, experts are not as simple as that in assessing the proximity between the methods and
attributes. Clearer information needed, whether it is true that an attribute is managed by a method. Not only
on the basis of similarity type it. Because the type parameter of a method can be a source of other data that is
not an attribute of a class. The certainty whether the method really manage attributes can be seen from the
source code of the method. However, a limitation of this study is the level design in which the determination
is based on the cohesion of the class diagram only. In this case, there should be a more in-depth information
that can be extracted from the class diagram, which shows that a method is definitely manage an attribute.
In the process of analyzing a class, an expert view of some things. In addition to the same parameter
types with attribute types, experts also see from the naming attributes and methods. Naming similarity or
similarity of meaning between the same naming attributes and methods can be assumed that the methods to
manage these attributes. As well as some of the features provided by the Java language programming tools,
which users can perform automatic code generation based on attributes that have been defined. Generation of
getters and setters are often used by developers to make it easier to define methods. Naming method
customized with the name of the generation of the attributes that have been defined. There is a mismatch
between the matrix cohesion perspective used by the expert perspective in analyzing the class in the level
design. In future work, needs to be add some aspect like the similarity meaning from attribute and method for
calculating cohesion.
8. CONCLUSION
Based on research that has been done it can be concluded as follows:
1. In identifying the attributes and operations, we used xpath function taken from javax.xml.xpath
library. XPath, where this function is used to parse the contents of files of type xml to configure the
tag you want to read, both attributes, operations and relationships between the two. So that the process
of identifying the attributes and operations can be easily read by the application
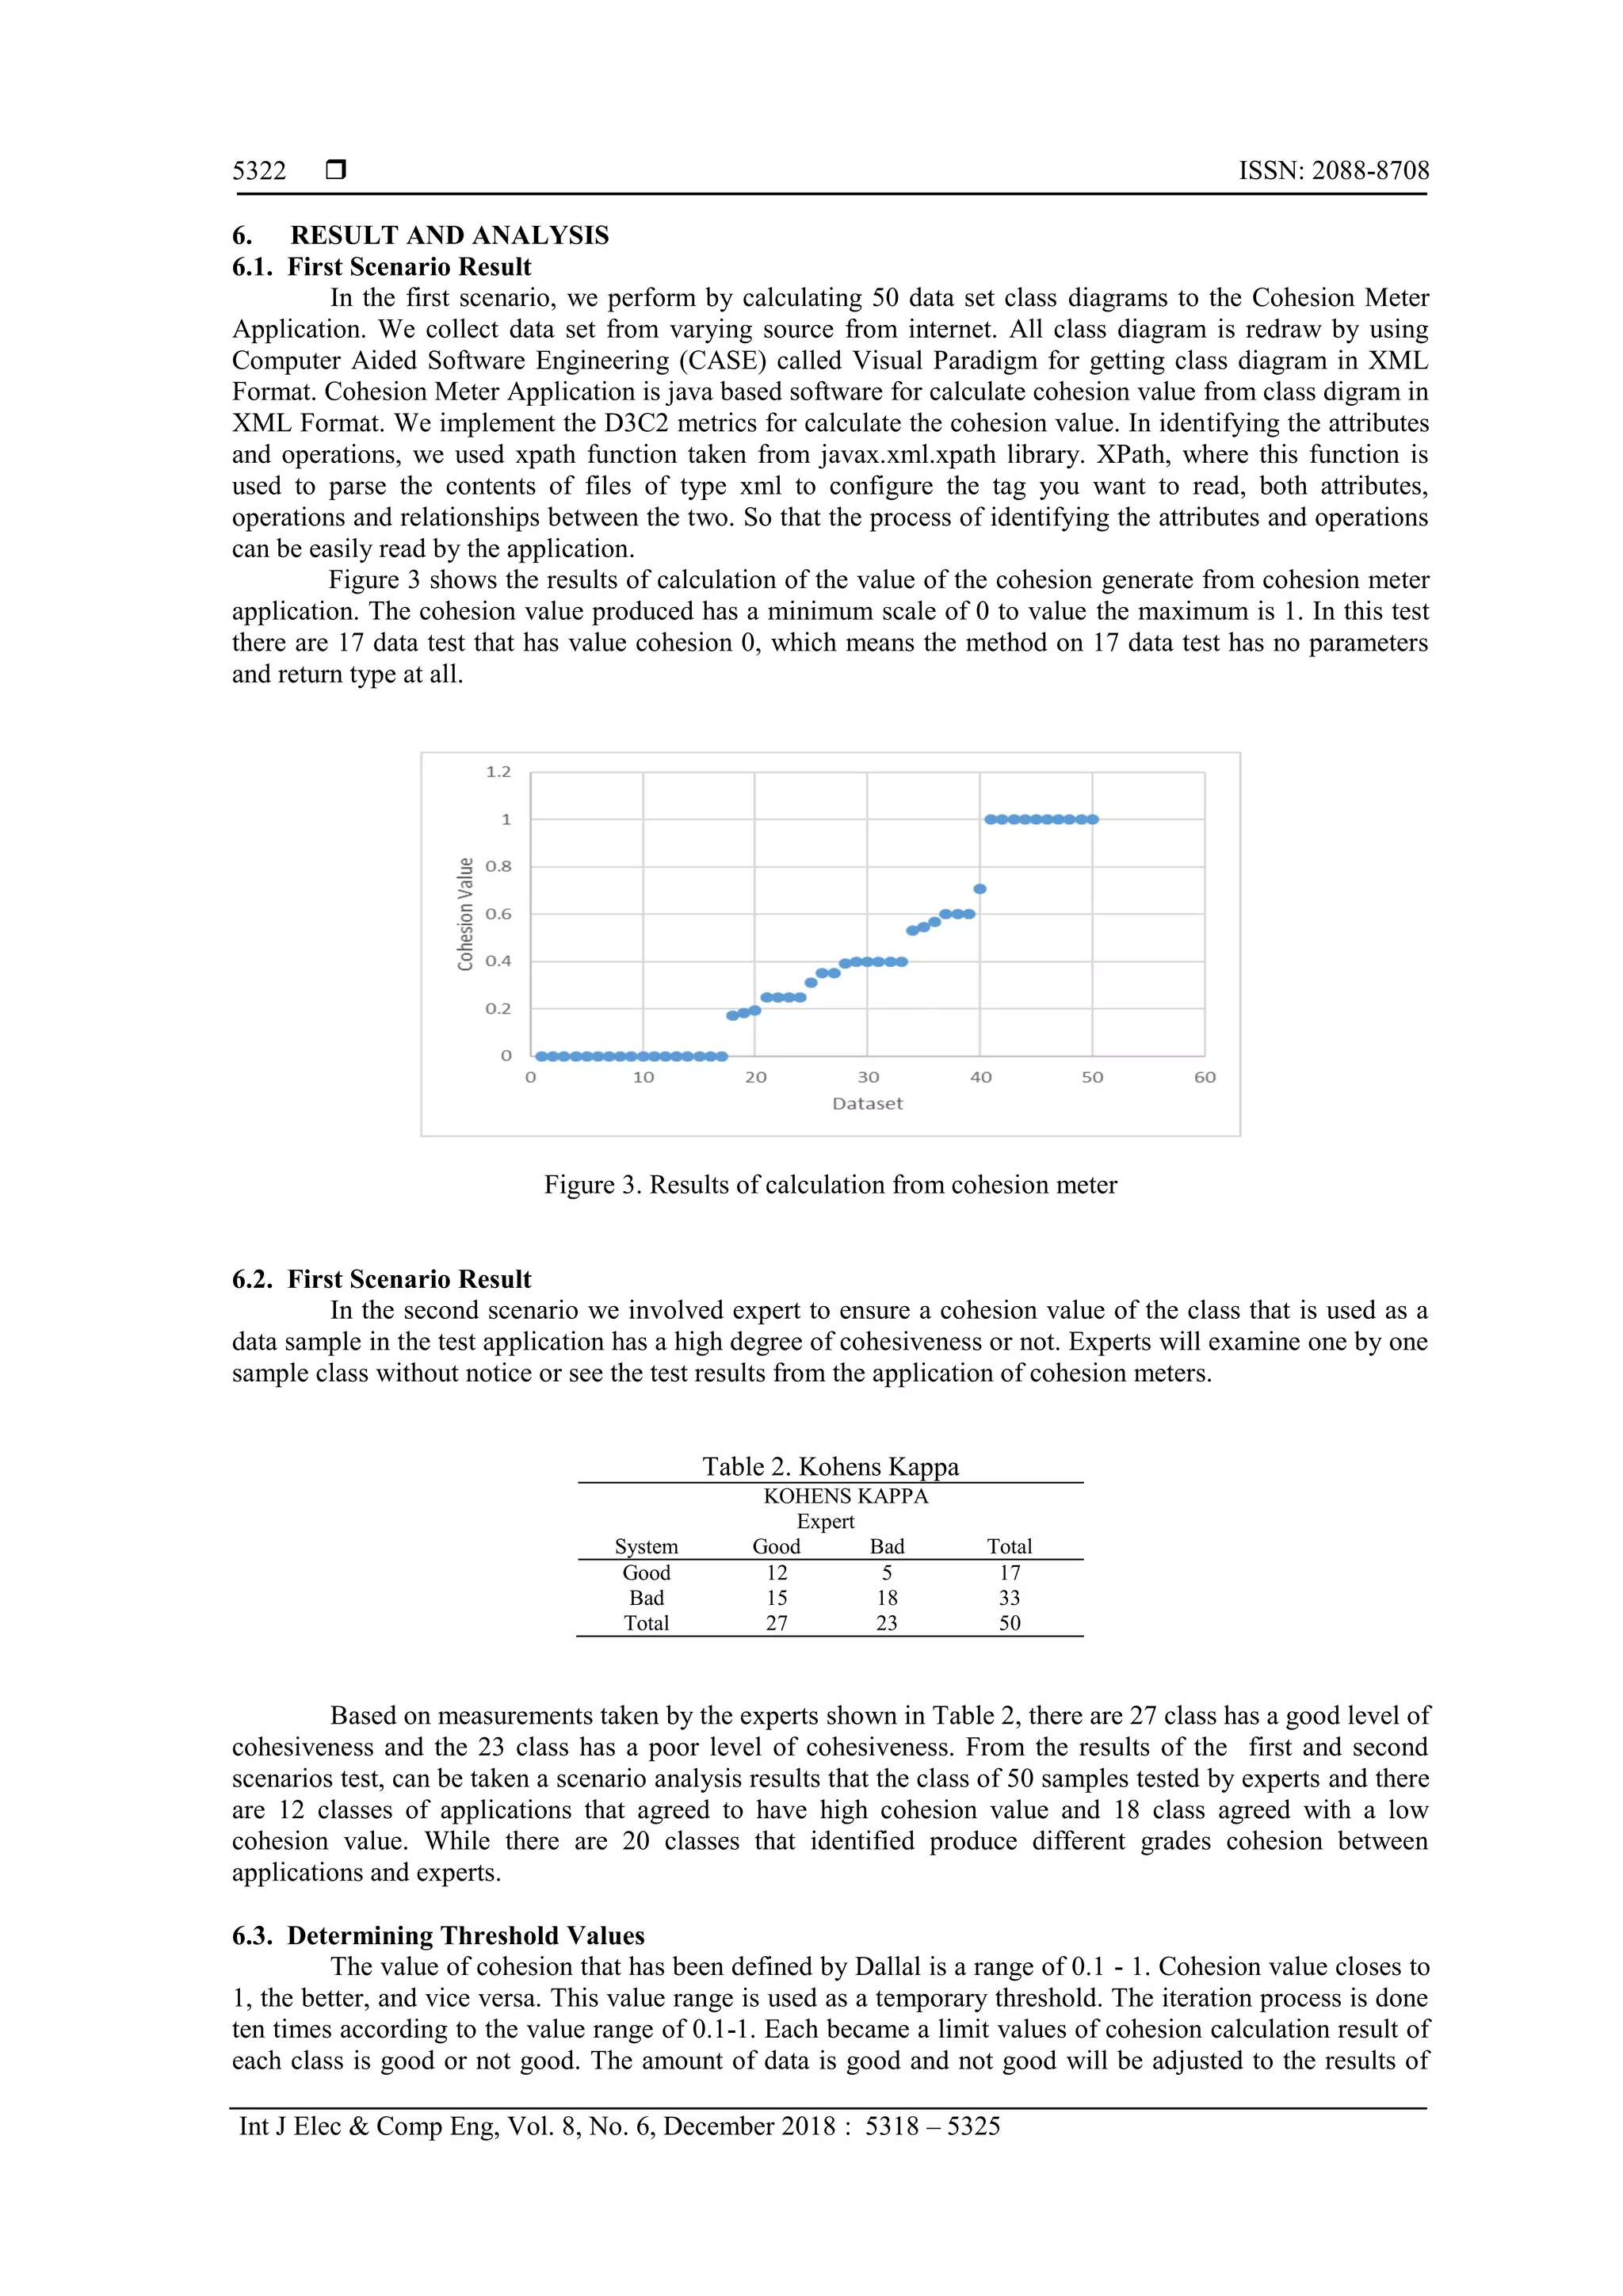
2. Determining successful or unsuccessful on the testing of test data determined on cohesion values
obtained from the calculation Cohesion Application Meter is > 0.00. Analysis of 66% of the 50 test
data indicate the success calculation that generates a value of cohesion. Meanwhile, 34% of the 50 test
data shows there is no relation to the cohesion of the class diagram.
3. In order to determine a measurable criterion in ensuring the cohesion values in a class, we determined
the threshold using the approach Cohens's Kappa and can be drawn a conclusion that the value of 0.41
is the best threshold value for predicting a value of cohesion
ACKNOWLEDGEMENTS
The authors gratefully acknowledge the Laboratory team of Software Engineering in Faculty of
Computer Science. This work was supported in part by the State Budget - Operational Assistance
Universities Scheme (Grant no.: 220l.l l/UN l0.36/PG/2015)
REFERENCES
[1] R. S. Pressman, Software Engineering : A Practitioner’s Approach, Seventh Ed. McGraw-Hill, 2015.
[2] J. Al Dallal, “A design-based cohesion metric for object-oriented classes,” Int. J. Comput. Sci., vol. 1, no. 3, pp.
195–200, 2007.
[3] J. Al Dallal and L. C. Briand, “An object-oriented high-level design-based class cohesion metric,” Inf. Softw.
Technol., vol. 52, no. 12, pp. 1346–1361, 2010.
[4] I. Chowdhury and M. Zulkernine, “Using complexity, coupling, and cohesion metrics as early indicators of
vulnerabilities,” J. Syst. Archit., vol. 57, no. 3, pp. 294–313, 2011.
[5] J. Al Dallal, “Measuring the discriminative power of object-oriented class cohesion metrics,” IEEE Trans. Softw.
Eng., vol. 37, no. 6, pp. 788–804, 2011.
[6] Z. Chen, Y. Zhou, B. Xu, J. Zhao, and H. Yang, “A Novel Approach to Measuring Class Cohesion Based on
Dependence Analysis,” Int. Conf. Softw. Maint, pp. 377–384, 2002.](https://image.slidesharecdn.com/v5822jul20jul3mar12118-201130055631/75/Identifying-Thresholds-for-Distance-Design-based-Direct-Class-Cohesion-D3C2-Metrics-7-2048.jpg)
![IJECE ISSN: 2088-8708
Identifying Thresholds for Distance Design-based Direct Class Cohesion (D3C2) Metrics (Denny Sagita)
5325
[7] B. Silva, C. Sant’anna, N. Rocha, and C. Chavez, “The effect of automatic concern mapping strategies on
conceptual cohesion measurement,” Inf. Softw. Technol., vol. 75, pp. 56–70, 2016.
[8] Y. Yang, Y. Zhao, C. Liu, H. Lu, Y. Zhou, and B. Xu, “An empirical investigation into the effect of slice types on
slice-based cohesion metrics,” Inf. Softw. Technol., vol. 75, pp. 90–104, 2016.
[9] M. A. Torkamani, “Metric Suite to Evaluate Reusability of Software Product Line”, International Journal of
Electrical and Computer Engineering (IJECE), Vol 4, No.2, pp 285-294. 2014
[10] K. A. M. Ferreira, M. A. S. Bigonha, R. S. Bigonha, L. F. O. Mendes, and H. C. Almeida, “Identifying thresholds
for object-oriented software metrics,” J. Syst. Softw., vol. 85, no. 2, pp. 244–257, 2012.
[12] M. Bhardwaj and A. Rana, “Key Software Metrics and its Impact on each other for Software Development
Projects”, International Journal of Electrical and Computer Engineering (IJECE), Vol 6, No.1, pp 242-248. 2016
[13] Prasad, S, Savithri S, Krishna “Comparison of Accuracy Measures for RS Image Classification using SVM and
ANN Classifiers” , International Journal of Electrical and Computer Engineering (IJECE), Vol 7, No.3, pp 1180-
1187. 2017.
[14] J. Sim and C. C. Wright, “The Kappa Statistic in Reliability Studies: Use, Interpretation, and Sample Size
Requirements,” Phys. Ther., vol. 85, no. 3, pp. 257–68, Mar. 2005.
[15] J. R. Landis and G. G. Koch, “The Measurement of Observer Agreement for Categorical Data,” Int. Biometric Soc.,
vol. 33, no. 1, pp. 159–174, 1977.
BIBLIOGRAPHIES OF AUTHORS
Denny Sagita Rusdianto, has received his Bachelor of Computer from Brawijaya University. He
also has got Master of Computer from 10 November Institute of Technology Surabaya. He is
currently a member of Software Engineering Research Group (SERG) in Faculty of Computer
Science, Brawijaya University. His current research interest is Software Engineering,
Requirement Engineering, Software Testing, Software Design, Game & Simulation
Development.
Fajar Pradana, has received his Bachelor of Applied Science from Electronics Engineering
Polytechnic Institute of Surabaya. He also has got Master of Engineering from Electro
Engineering from Gadjahmada University Jogjakarta. He is currently a member of Software
Engineering Research Group (SERG) in Faculty of Computer Science, Brawijaya University.
His current research interest is Software Engineering, Requirement Engineering, Software
Design, Software Testing, and Software Maintenance
Bayu Priyambadha, has received his Bachelor of Computer from 10 November Institute of
Technology Surabaya. He also has got Master of Computer from 10 November Institute of
Technology Surabay. He is currently a member of Software Engineering Research Group
(SERG) in Faculty of Computer Science, Brawijaya University. His current research interest is
Software Engineering, Requirement Engineering, Software Design, Software Testing, Software
Maintenance, Software Evolution.](https://image.slidesharecdn.com/v5822jul20jul3mar12118-201130055631/75/Identifying-Thresholds-for-Distance-Design-based-Direct-Class-Cohesion-D3C2-Metrics-8-2048.jpg)