This document describes a fuzzy rule-based system for classifying Java applications using object-oriented metrics. Key features of the system include automatically extracting OO metrics from source code, a configurable set of fuzzy rules, and classifying software at both the application and class level. The system is designed to address limitations of existing OO metric tools by providing an automated, unified analysis and classification without requiring complex post-processing methods. The document outlines the system design, including subsystems for the fuzzy rules engine and extracting OO metrics, and defines membership functions and fuzzy rules for classification.
SENSITIVITY ANALYSIS OF INFORMATION RETRIEVAL METRICS ijcsit
Average Precision, Recall and Precision are the main metrics of Information Retrieval (IR) systems performance. Using Mathematical and empirical analysis, in this paper, we show the properties of those metrics. Mathematically, it is demonstrated that all those parameters are very sensitive to relevance judgment which is not usually very reliable. We show that position shifting downwards of the relevant document within the ranked list is followed by Average Precision decreasing. The variation of Average Precision parameter value is highly present in the positions 1 to 10, while from the 10th position on, this variation is negligible. In addition, we try to estimate the regularity of the Average Precision value changes, when we assume that we are switching the arbitrary number of relevance judgments within the existing ranked list, from non-relevant to relevant. Empirically, it is shown hat 6 relevant documents at the end of the 20 document list, have approximately same Average Precision value as a single relevant document at the beginning of this list, while Recall and Precision values increase linearly, regardless of the document position in the list. Also, we show that in the case of Serbian-to-English human translation query followed by English-to-Serbian machine translation, relevance judgment is significantly changed and therefore, all the parameters for measuring the IR system performance are also subject to change.
This document discusses online feature selection (OFS) for data mining applications. It addresses two tasks of OFS: 1) learning with full input, where the learner can access all features to select a subset, and 2) learning with partial input, where only a limited number of features can be accessed for each instance. Novel algorithms are presented for each task, and their performance is analyzed theoretically. Experiments on real-world datasets demonstrate the efficacy of the proposed OFS techniques for applications in computer vision, bioinformatics, and other domains involving high-dimensional sequential data.
Integrated bio-search approaches with multi-objective algorithms for optimiza...TELKOMNIKA JOURNAL
Optimal selection of features is very difficult and crucial to achieve, particularly for the task of classification. It is due to the traditional method of selecting features that function independently and generated the collection of irrelevant features, which therefore affects the quality of the accuracy of the classification. The goal of this paper is to leverage the potential of bio-inspired search algorithms, together with wrapper, in optimizing multi-objective algorithms, namely ENORA and NSGA-II to generate an optimal set of features. The main steps are to idealize the combination of ENORA and NSGA-II with suitable bio-search algorithms where multiple subset generation has been implemented. The next step is to validate the optimum feature set by conducting a subset evaluation. Eight (8) comparison datasets of various sizes have been deliberately selected to be checked. Results shown that the ideal combination of multi-objective algorithms, namely ENORA and NSGA-II, with the selected bio-inspired search algorithm is promising to achieve a better optimal solution (i.e. a best features with higher classification accuracy) for the selected datasets. This discovery implies that the ability of bio-inspired wrapper/filtered system algorithms will boost the efficiency of ENORA and NSGA-II for the task of selecting and classifying features.
IRJET-Comparison between Supervised Learning and Unsupervised LearningIRJET Journal
This document compares supervised and unsupervised learning models in artificial neural networks. It describes how supervised learning uses labeled training data to learn relationships between inputs and outputs, while unsupervised learning identifies hidden patterns in unlabeled data. The document outlines techniques for each like classification and regression for supervised learning, and clustering and density estimation for unsupervised learning. It then presents experiments applying multilayer perceptron (supervised) and k-means clustering (unsupervised) to datasets, finding unsupervised learning had higher accuracy. The document concludes unsupervised learning is favored for this task but supervised learning remains useful for problems with labeled data.
IRJET - Student Pass Percentage Dedection using Ensemble LearninngIRJET Journal
This document discusses using ensemble learning methods to predict student pass rates. It begins with an abstract describing ensemble learning and its applications. It then provides background on strengthening the STEM workforce and using prediction modeling in educational data mining. The methodology section describes using decision trees, logistic regression, nearest neighbors, neural networks, naive Bayes, and support vector machines as base classifiers in an ensemble model to predict student enrollment in STEM courses. The results show the J48 decision tree algorithm correctly classified 84% of instances, outperforming naive Bayes and CART. The conclusion is that ensemble models can better categorize factors affecting student choice to enroll in STEM by combining multiple classification techniques.
SPAM FILTERING SECURITY EVALUATION FRAMEWORK USING SVM, LR AND MILR ijcax
The Pattern classification system classifies the pattern into feature space within a boundary. In case
adversarial applications use, for example Spam Filtering, the Network Intrusion Detection System (NIDS),
Biometric Authentication, the pattern classification systems are used. Spam filtering is an adversary
application in which data can be employed by humans to attenuate perspective operations. To appraise the
security issue related Spam Filtering voluminous machine learning systems. We presented a framework for
the experimental evaluation of the classifier security in an adversarial environments, that combines and
constructs on the arms race and security by design, Adversary modelling and Data distribution under
attack. Furthermore, we presented a SVM, LR and MILR classifier for classification to categorize email as
legitimate (ham) or spam emails on the basis of thee text samples.
The document discusses different methods researchers have used to code qualitative and quantitative data for analysis. It describes several coding schemes researchers developed to analyze patterns in language learner data, such as question formation stages, feedback on errors, and classroom interaction. The document emphasizes that reliable coding requires carefully designing a scheme, training multiple coders, and calculating interrater reliability statistics on a sample of the data.
Towards formulating dynamic model for predicting defects in system testing us...Journal Papers
This document discusses developing a dynamic model for predicting defects in system testing using metrics collected from prior phases. It begins with background on the waterfall and V-model software development processes. It then reviews previous research on software defect prediction, noting limited work has focused specifically on predicting defects in system testing. The proposed model would analyze metrics collected during requirements, design, coding, and testing phases to determine which metrics best predict defects found in system testing. A case study is discussed that would apply statistical analysis to historical metrics data to formulate a mathematical equation for defect prediction. The model would then be verified by applying it to new projects and comparing predicted defects to actual defects found during system testing. The goal is to select a prediction model that estimates defects
Multi Label Spatial Semi Supervised Classification using Spatial Associative ...cscpconf
Multi-label spatial classification based on association rules with multi objective genetic
algorithms (MOGA) enriched by semi supervised learning is proposed in this paper. It is to deal
with multiple class labels problem. In this paper we adapt problem transformation for the multi
label classification. We use hybrid evolutionary algorithm for the optimization in the generation
of spatial association rules, which addresses single label. MOGA is used to combine the single
labels into multi labels with the conflicting objectives predictive accuracy and
comprehensibility. Semi supervised learning is done through the process of rule cover
clustering. Finally associative classifier is built with a sorting mechanism. The algorithm is
simulated and the results are compared with MOGA based associative classifier, which out
performs the existing
A HEURISTIC APPROACH FOR WEB-SERVICE DISCOVERY AND SELECTIONijcsit
This document proposes a new heuristic approach for web service discovery and selection using an algorithm inspired by honey bee behavior called the Bees Algorithm. The approach structures service registries by domain to simplify discovery. It uses the Bees Algorithm as an intelligent search method to efficiently find the optimal service matching a client's request and quality of service requirements from the relevant registry in least time.
Study on Relavance Feature Selection MethodsIRJET Journal
This document summarizes research on feature selection methods. It discusses how feature selection is used to reduce dimensionality when working with large datasets that have thousands of variables. Several feature selection algorithms are examined, including ant colony optimization, quadratic programming, variable ranking using filter, wrapper and embedded methods, and fast correlation-based filtering with sequential forward selection. Feature selection can improve classification efficiency and understanding of data by identifying the most meaningful features.
IRJET- Attribute Based Adaptive Evaluation SystemIRJET Journal
The document proposes an attribute-based adaptive evaluation system to improve candidate assessment. It analyzes questions using text mining to determine which attributes they test. Candidate responses are evaluated using fuzzy logic to generate outcomes based on attribute levels. This provides a more precise evaluation of a candidate's abilities than traditional tests. The system analyzes questions to assign attributes and levels. It records responses and analyzes them to determine a candidate's attribute levels, providing a comprehensive skills assessment. The proposed system aims to offer more effective candidate evaluation than current methods.
ADDRESSING IMBALANCED CLASSES PROBLEM OF INTRUSION DETECTION SYSTEM USING WEI...IJCNCJournal
The main issues of the Intrusion Detection Systems (IDS) are in the sensitivity of these systems toward the errors, the inconsistent and inequitable ways in which the evaluation processes of these systems were often performed. Most of the previous efforts concerned with improving the overall accuracy of these models via increasing the detection rate and decreasing the false alarm which is an important issue. Machine Learning (ML) algorithms can classify all or most of the records of the minor classes to one of the main classes with negligible impact on performance. The riskiness of the threats caused by the small classes and the shortcoming of the previous efforts were used to address this issue, in addition to the need for improving the performance of the IDSs were the motivations for this work. In this paper, stratified sampling method and different cost-function schemes were consolidated with Extreme Learning Machine (ELM) method with Kernels, Activation Functions to build competitive ID solutions that improved the performance of these systems and reduced the occurrence of the accuracy paradox problem. The main experiments were performed using the UNB ISCX2012 dataset. The experimental results of the UNB ISCX2012 dataset showed that ELM models with polynomial function outperform other models in overall accuracy, recall, and F-score. Also, it competed with traditional model in Normal, DoS and SSH classes.
The Heuristic Extraction Algorithms for Freeman Chain Code of Handwritten Cha...Waqas Tariq
Handwriting character recognition (HCR) is the ability of a computer to receive and interpret handwritten input. In HCR, there are many representation schemes and one of them is Freeman chain code (FCC). Chain code is a sequence of code direction of a characters and connection to a starting point which is often used in image processing. The main problem in representing character using FCC that it is depends on the starting points. Unfortunately, the study about FCC extraction using one continuous route and to minimizing the length of chain code to FCC from a thinned binary image (TBI) have not been widely explored. To solve this problem, heuristic algorithms are proposed to extract the FCC that is correctly representing the characters. This paper proposes two heuristics algorithm that are based on randomized and enumeration-based algorithms to solve the problems. As problem solving techniques, the randomized algorithm makes the random choices while enumeration-based algorithm enumerates all possible candidates for solution. The performance measures of the algorithms are the route length and computation time. The experiment on the algorithms are performed based on the chain code representation derived from established previous works of Center of Excellence for Document Analysis and Recognition (CEDAR) dataset which consists of 126 upper-case letter characters. The experimental result shows that route length of both algorithms are similar but the computation time of enumeration-based algorithm is higher than randomized algorithm. This is because enumeration-based algorithm considers all branches in route walk.
REALIZING A LOOSELY-COUPLED STUDENTS PORTAL FRAMEWORKijseajournal
Most of the currently available students' portal frameworks are tightly-coupled frameworks. A recent
research done by the authors of this paper has discussed how to distribute the concepts of the traditional
students' portal framework and came out with a distributed interoperable framework. This paper realizes
the distributed interoperable students' portal framework by developing a prototype. This prototype is based
on Service Oriented Architecture (SOA). The prototype is tested using web service testing and compatibility
testing.
Use Case Modeling in Software Development: A Survey and TaxonomyEswar Publications
Identifying use cases is one of the most important steps in the software requirement analysis. This paper makes a literature review over use cases and then presents six taxonomies for them. The first taxonomy is based on the level of functionality of a system in a domain. The second taxonomy is based on primacy of functionality and the third one relies on essentialness of functionality of the system. The fourth taxonomy is concerned with supporting of functionality. The fifth taxonomy is based on the boundary of functionality and the sixth one is related to generalization/specialization relation. Then the use cases are evaluated in a case study in a control command police system. Several guidelines are recommended for developing use cases and their refinement, based on some
practical experience obtained from the evaluation.
Generating requirements analysis models from textual requiremenfortes
This document describes a process for generating use case models from textual requirements. The process uses the EA-Miner tool to analyze textual requirements and extract information like functional concerns, RDL sentences, and a syntactically tagged document. This extracted information is used to derive initial candidate use cases, actors, and relationships. The candidate model is then refined by activities like removing undesirable use cases, completing abstraction names, adding new use cases/actors, and defining relationships between use cases. The overall goal is to reduce the time and effort required to produce requirements artifacts from textual specifications.
IRJET- Prediction of Crime Rate Analysis using Supervised Classification Mach...IRJET Journal
This document presents a study that uses machine learning techniques to predict crime rates. Specifically, it aims to analyze crime data using supervised machine learning classification algorithms like decision trees, support vector machines, logistic regression, k-nearest neighbors, and random forests. The document outlines collecting and preprocessing crime data, selecting relevant features, training models on a portion of the data and testing them on the remaining data. It finds that random forest achieved the best prediction accuracy compared to other algorithms tested. The goal is to help law enforcement agencies better predict and reduce crime rates by analyzing historical crime data patterns.
A NOVEL APPROACH FOR GENERATING FACE TEMPLATE USING BDAcsandit
In identity management system, commonly used biometric recognition system needs attention
towards issue of biometric template protection as far as more reliable solution is concerned. In
view of this biometric template protection algorithm should satisfy security, discriminability and
cancelability. As no single template protection method is capable of satisfying the basic
requirements, a novel technique for face template generation and protection is proposed. The
novel approach is proposed to provide security and accuracy in new user enrollment as well as
authentication process. This novel technique takes advantage of both the hybrid approach and
the binary discriminant analysis algorithm. This algorithm is designed on the basis of random
projection, binary discriminant analysis and fuzzy commitment scheme. Three publicly available
benchmark face databases are used for evaluation. The proposed novel technique enhances the
discriminability and recognition accuracy by 80% in terms of matching score of the face images
and provides high security.
An effective approach for tackling network security
problems is Intrusion detection systems (IDS). These kind of
systems play a key role in network security as they can detect
different types of attacks in networks, including DoS, U2R Probe
and R2L. In addition, IDS are an increasingly key part of the
system’s defense. Various approaches to IDS are now being used,
but are unfortunately relatively ineffective. Data mining techniques
and artificial intelligence play an important role in security
services. We will present a comparative study of three wellknown
intelligent algorithms in this paper. These are Radial Basis
Functions (RBF), Multilayer Perceptrons (MLP) and Support
Vector Machine (SVM).This work’s main interest is to benchmark
the performance of these3 intelligent algorithms. This is done by
using a dataset of about 9,000 connections, randomly chosen from
KDD'99’s 10% dataset. In addition, we investigate these
algorithms’ performance in terms of their attack classification
accuracy. The Simulation results are also analyzed and the
discussion is then presented. It has been observed that SVM with a
linear kernel (Linear-SVM) gives a better performance than MLP
and RBF in terms of its detection accuracy and processing speed.
An Empirical Comparison and Feature Reduction Performance Analysis of Intrusi...ijctcm
This document summarizes a study that empirically compares the performance of five machine learning algorithms (J48, BayesNet, OneR, NB, and ZeroR) for intrusion detection on the KDD Cup 99 dataset. The study evaluates the algorithms based on 10 performance criteria and finds that the J48 decision tree algorithm performs best for intrusion detection. It also compares the performance of intrusion detection classifiers using seven feature reduction techniques.
VISUALIZATION OF A SYNTHETIC REPRESENTATION OF ASSOCIATION RULES TO ASSIST EX...csandit
In order to help the expert to validate association rules, some quality measures are proposed in
the literature. We distinguish two categories: objective and subjective measures. The first one
depends on a fixed threshold and on data structure from which the rules are extracted. The
second one has two subcategories: The first one consists on providing to the expert a tool for
rule interactive exploration. In fact, they present these rules in textual form. The second
subcategory includes the use of visualization systems to facilitate the task of rules mining.
However, this last subcategory assumes that experts have statistical knowledge to interpret and
validate association rules. Furthermore, the statistical methods have a lack of semantic
representation and could not help the experts during the process of validation. To solve this
problem, we propose in this paper a method which visualizes to the experts a synthetic
representation of association rules as a formal conceptual graph (FCG). FCG represents his
area of interest and allows him to realize the task of rules mining easily due to its semantic
richness.
Maintaining the quality of the software is the major challenge in the process of software development.
Software inspections which use the methods like structured walkthroughs and formal code reviews involve
careful examination of each and every aspect/stage of software development. In Agile software
development, refactoring helps to improve software quality. This refactoring is a technique to improve
software internal structure without changing its behaviour. After much study regarding the ways to
improve software quality, our research proposes an object oriented software metric tool called
“MetricAnalyzer”. This tool is tested on different codebases and is proven to be much useful.
Algorithm ExampleFor the following taskUse the random module .docxdaniahendric
Algorithm Example
For the following task:
Use the random module to write a number guessing game.
The number the computer chooses should change each time you run the program.
Repeatedly ask the user for a number. If the number is different from the computer's let the user know if they guessed too high or too low. If the number matches the computer's, the user wins.
Keep track of the number of tries it takes the user to guess it.
An appropriate algorithm might be:
Import the random module
Display a welcome message to the user
Choose a random number between 1 and 100
Get a guess from the user
Set a number of tries to 0
As long as their guess isn’t the number
Check if guess is lower than computer
If so, print a lower message.
Otherwise, is it higher?
If so, print a higher message.
Get another guess
Increment the tries
Repeat
When they guess the computer's number, display the number and their tries count
Notice that each line in the algorithm corresponds to roughly a line of code in Python, but there is no coding itself in the algorithm. Rather the algorithm lays out what needs to happen step by step to achieve the program.
Software Quality Metrics for Object-Oriented Environments
AUTHORS:
Dr. Linda H. Rosenberg Lawrence E. Hyatt
Unisys Government Systems Software Assurance Technology Center
Goddard Space Flight Center Goddard Space Flight Center
Bld 6 Code 300.1 Bld 6 Code 302
Greenbelt, MD 20771 USA Greenbelt, MD 20771 USA
I. INTRODUCTION
Object-oriented design and development are popular concepts in today’s software development
environment. They are often heralded as the silver bullet for solving software problems. While
in reality there is no silver bullet, object-oriented development has proved its value for systems
that must be maintained and modified. Object-oriented software development requires a
different approach from more traditional functional decomposition and data flow development
methods. This includes the software metrics used to evaluate object-oriented software.
The concepts of software metrics are well established, and many metrics relating to product
quality have been developed and used. With object-oriented analysis and design methodologies
gaining popularity, it is time to start investigating object-oriented metrics with respect to
software quality. We are interested in the answer to the following questions:
• What concepts and structures in object-oriented design affect the quality of the
software?
• Can traditional metrics measure the critical object-oriented structures?
• If so, are the threshold values for the metrics the same for object-oriented designs as for
functional/data designs?
• Which of the many new metrics found in the literature are useful to measure the critical
concepts of object-oriented structures?
II. METRIC EVALUATION CRITERIA
While metrics for the traditional functional decomposition and data analysis design appro ...
IMPLEMENTATION OF DYNAMIC COUPLING MEASUREMENT OF DISTRIBUTED OBJECT ORIENTED...IJCSEA Journal
This document summarizes a research paper that proposes a method for dynamically measuring coupling in distributed object-oriented software systems. The method involves three steps: instrumentation of the Java Virtual Machine to trace method calls, post-processing of the trace files to merge information, and calculation of coupling metrics based on the dynamic traces. The implementation results show that the proposed approach can effectively measure coupling metrics dynamically by accounting for polymorphism and dynamic binding, overcoming limitations of traditional static coupling analysis.
IMPLEMENTATION OF DYNAMIC COUPLING MEASUREMENT OF DISTRIBUTED OBJECT ORIENTED...IJCSEA Journal
Software metrics are increasingly playing a central role in the planning and control of software development projects. Coupling measures have important applications in software development and maintenance. Existing literature on software metrics is mainly focused on centralized systems, while work in the area of distributed systems, particularly in service-oriented systems, is scarce. Distributed systems with service oriented components are even more heterogeneous networking and execution environment. Traditional coupling measures take into account only “static” couplings. They do not account for “dynamic” couplings due to polymorphism and may significantly underestimate the complexity of software and misjudge the need for code inspection, testing and debugging. This is expected to result in poor predictive accuracy of the quality models in distributed Object Oriented systems that utilize static coupling measurements. In order to overcome these issues, we propose a hybrid model in Distributed Object Oriented Software for measure the coupling dynamically. In the proposed method, there are three steps
such as Instrumentation process, Post processing and Coupling measurement. Initially the instrumentation process is done. In this process the instrumented JVM that has been modified to trace method calls. During this process, three trace files are created namely .prf, .clp, .svp. In the second step, the information in these file are merged. At the end of this step, the merged detailed trace of each JVM contains pointers to the merged trace files of the other JVM such that the path of every remote call from the client to the server can be uniquely identified. Finally, the coupling metrics are measured dynamically. The implementation results show that the proposed system will effectively measure the coupling metrics dynamically.
The objective of this paper is to provide an insight preview into various
agent oriented methodologies by using an enhanced comparison
framework based on criteria like process related criteria, steps and
techniques related criteria, steps and usability criteria, model related or
“concepts” related criteria, comparison regarding model related criteria
and comparison regarding supportive related criteria. The result also
constitutes inputs collected from the users of the agent oriented
methodologies through a questionnaire based survey.
EMPIRICAL APPLICATION OF SIMULATED ANNEALING USING OBJECT-ORIENTED METRICS TO...ijcsa
The work is about using Simulated Annealing Algorithm for the effort estimation model parameter
optimization which can lead to the reduction in the difference in actual and estimated effort used in model
development.
The model has been tested using OOP’s dataset, obtained from NASA for research purpose.The data set
based model equation parameters have been found that consists of two independent variables, viz. Lines of
Code (LOC) along with one more attribute as a dependent variable related to software development effort
(DE). The results have been compared with the earlier work done by the author on Artificial Neural
Network (ANN) and Adaptive Neuro Fuzzy Inference System (ANFIS) and it has been observed that the
developed SA based model is more capable to provide better estimation of software development effort than
ANN and ANFIS
Identification, Analysis & Empirical Validation (IAV) of Object Oriented Desi...rahulmonikasharma
Metrics and Measure are closely inter-related to each other. Measure is defined as way of defining amount, dimension, capacity or size of some attribute of a product in quantitative manner while Metric is unit used for measuring attribute. Software quality is one of the major concerns that need to be addressed and measured. Object oriented (OO) systems require effective metrics to assess quality of software. The paper is designed to identify attributes and measures that can help in determining and affecting quality attributes. The paper conducts empirical study by taking public dataset KC1 from NASA project database. It is validated by applying statistical techniques like correlation analysis and regression analysis. After analysis of data, it is found that metrics SLOC, RFC, WMC and CBO are significant and treated as quality indicators while metrics DIT and NOC are not significant. The results produced from them throws significant impact on improving software quality.
Handwritten Text Recognition Using Machine LearningIRJET Journal
This document discusses a system for handwritten text recognition using machine learning. It proposes using both convolutional neural networks (CNNs) and recurrent neural networks (RNNs) to recognize handwritten text. CNNs are used for feature extraction from images while RNNs model the sequential nature of handwriting. The system collects data, preprocesses it, trains a model using CNNs and RNNs, and then uses the model to generate recognized text output with high accuracy. Potential applications of this handwritten text recognition system include document digitization, banking, education, and more.
Reusability Metrics for Object-Oriented System: An Alternative ApproachWaqas Tariq
Object-oriented metrics plays an import role in ensuring the desired quality and have widely been applied to practical software projects. The benefits of object-oriented software development increasing leading to development of new measurement techniques. Assessing the reusability is more and more of a necessity. Reusability is the key element to reduce the cost and improve the quality of the software. Generic programming helps us to achieve the concept of reusability through C++ Templates which helps in developing reusable software modules and also identify effectiveness of this reuse strategy. The advantage of defining metrics for templates is the possibility to measure the reusability of software component and to identify the most effective reuse strategy. The need for such metrics is particularly useful when an organization is adopting a new technology, for which established practices have yet to be developed. Many researchers have done research on reusability metrics [2, 9, 3, 4]. In this paper we have proposed four new independent metrics Number of Template Children (NTC), Depth of Template Tree (DTT) Method Template Inheritance Factor (MTIF) and Attribute Template Inheritance Factor (ATIF), to measure the reusability for object-oriented systems.
Threshold benchmarking for feature ranking techniquesjournalBEEI
In prediction modeling, the choice of features chosen from the original feature set is crucial for accuracy and model interpretability. Feature ranking techniques rank the features by its importance but there is no consensus on the number of features to be cut-off. Thus, it becomes important to identify a threshold value or range, so as to remove the redundant features. In this work, an empirical study is conducted for identification of the threshold benchmark for feature ranking algorithms. Experiments are conducted on Apache Click dataset with six popularly used ranker techniques and six machine learning techniques, to deduce a relationship between the total number of input features (N) to the threshold range. The area under the curve analysis shows that ≃ 33-50% of the features are necessary and sufficient to yield a reasonable performance measure, with a variance of 2%, in defect prediction models. Further, we also find that the log2(N) as the ranker threshold value represents the lower limit of the range.
IRJET- A Comparative Research of Rule based Classification on Dataset using W...IRJET Journal
This document discusses and compares the performance of four rule-based classification algorithms (Decision Table, One R, PART, and Zero R) on different datasets using the WEKA data mining tool. It first provides background on classification and rule-based classification in data mining. It then describes the four algorithms and the experimental process used to implement them in WEKA, evaluate their performance based on accuracy, number of correct/incorrect predictions, and execution time, and analyze the results.
Software Product Measurement and Analysis in a Continuous Integration Environ...Gabriel Moreira
Presentation of a paper presented in the International Conference ITNG 2010, about a framework constructed for software internal quality measurement program with automatic metrics extraction, implemented at a Software Factory.
Machine Learning Aided Breast Cancer ClassificationIRJET Journal
This document presents research on using machine learning algorithms to classify breast cancer as benign or malignant. Eight machine learning algorithms were implemented on a dataset containing medical attributes of 569 breast cancer cases. The algorithms - support vector machine, K-nearest neighbors, logistic regression, decision tree classifier, random forest classifier, XGBoost classifier, gradient boosting classifier, and naive Bayes - were evaluated based on accuracy, precision, recall, F1-score, AUC-ROC curve, and AUC-PR curve. The XGBoost and gradient boosting classifiers performed best with 98.84% accuracy, 0.9688 precision, 1.00 recall, and 0.9841 F1-score. The research aims to help speed up
an error in that computer program. In order to improve the software quality, prediction of faulty modules is
necessary. Various Metric suites and techniques are available to predict the modules which are critical and
likely to be fault prone. Genetic Algorithm is a problem solving algorithm. It uses genetics as its model of
problem solving. It’s a search technique to find approximate solutions to optimization and search
problems.Genetic algorithm is applied for solving the problem of faulty module prediction and as well as
for finding the most important attribute for fault occurrence. In order to perform the analysis, performance
validation of the Genetic Algorithm using open source software jEdit is done. The results are measured in
terms Accuracy and Error in predicting by calculating probability of detection and probability of false
Alarms
MACHINE LEARNING AND DEEP LEARNING TECHNIQUES FOR DETECTING ABUSIVE CONTENT O...IRJET Journal
This document discusses machine learning and deep learning techniques for detecting abusive content on Twitter. It presents an overview of cyber abuse and sentiment analysis. A literature review covers past research on cyberbullying detection. The methodology uses a dataset of over 32k tweets, which are preprocessed and analyzed using machine learning algorithms and an LSTM deep learning model. Results show that the LSTM model achieves 99.5% accuracy and 74.8% F1 score, outperforming machine learning models for detecting abusive tweets. The conclusion is that deep learning more effectively identifies abuse but continued experimentation is needed to address this important social media problem.
GENETIC-FUZZY PROCESS METRIC MEASUREMENT SYSTEM FOR AN OPERATING SYSTEMijcseit
This document presents a genetic-fuzzy system for measuring the performance of an operating system's processes. It develops a model using 7 key operating system process parameters and fuzzy logic to handle imprecision. A genetic algorithm is used to optimize the generated membership functions. Rules are created relating parameter combinations to performance classifications. The system was tested on sample data and the genetic algorithm was able to optimize the membership functions over 4 generations to best classify performance. The system brings an optimal and precise approach to measuring operating system process performance by combining genetic algorithms and fuzzy logic.
Genetic fuzzy process metric measurement system for an operating systemijcseit
Operating system (Os) is the most essential software of the computer system,deprived ofit, the computer
system is totally useless. It is the frontier for assessing relevant computer resources. It performance greatly
enhances user overall objective across the system. Related literatures have try in different methods and
techniques to measure the process matric performance of the operating system but none has incorporated
the use of genetic algorithm and fuzzy logic in their varied techniques which indeed is a novel approach.
Extending the work of Michalis, this research focuses on measuring the process matrix performance of an
operating system utilizing set of operating system criteria’s while fusing fuzzy logic to handle
impreciseness and genetic for process optimization.
GENETIC-FUZZY PROCESS METRIC MEASUREMENT SYSTEM FOR AN OPERATING SYSTEMijcseit
Operating system (Os) is the most essential software of the computer system,deprived ofit, the computer system is totally useless. It is the frontier for assessing relevant computer resources. It performance greatly
enhances user overall objective across the system. Related literatures have try in different methods and techniques to measure the process matric performance of the operating system but none has incorporated the use of genetic algorithm and fuzzy logic in their varied techniques which indeed is a novel approach. Extending the work of Michalis, this research focuses on measuring the process matrix performance of an
operating system utilizing set of operating system criteria’s while fusing fuzzy logic to handle impreciseness and genetic for process optimization.
Contributors to Reduce Maintainability Cost at the Software Implementation PhaseWaqas Tariq
This document discusses factors that can reduce software maintenance costs during the implementation phase. It identifies that maintenance costs are highest during software development phases. The objective is to define criteria to assess software quality characteristics and assist during implementation. This will help reduce maintenance costs by creating criteria groups to support writing standard code, developing a model to apply criteria, and increasing understandability. Student groups will study code standardization, write programs, and test software maintenance on programs to validate the model and proposed criteria.
The document describes a proposed tool called the Class Breakpoint Analyzer (CBA) that evaluates software quality at the class level. The CBA extracts metrics like weighted methods per class (WMC), depth of inheritance tree (DIT), number of children (NOC), and lack of cohesion in methods (LCOM) based on the Chidamber and Kemerer (CK) metrics suite. Threshold values are set for each metric to determine if a class is overloaded. The CBA then generates a scorecard for each class to identify classes that need to be refactored to improve quality and reusability. The goal is to help evaluate code quality, identify areas for improvement, and make off-the-shelf
Similar to Fuzzy Rule Base System for Software Classification (20)
leewayhertz.com-AI in predictive maintenance Use cases technologies benefits ...alexjohnson7307
Predictive maintenance is a proactive approach that anticipates equipment failures before they happen. At the forefront of this innovative strategy is Artificial Intelligence (AI), which brings unprecedented precision and efficiency. AI in predictive maintenance is transforming industries by reducing downtime, minimizing costs, and enhancing productivity.
A Comprehensive Guide to DeFi Development Services in 2024Intelisync
DeFi represents a paradigm shift in the financial industry. Instead of relying on traditional, centralized institutions like banks, DeFi leverages blockchain technology to create a decentralized network of financial services. This means that financial transactions can occur directly between parties, without intermediaries, using smart contracts on platforms like Ethereum.
In 2024, we are witnessing an explosion of new DeFi projects and protocols, each pushing the boundaries of what’s possible in finance.
In summary, DeFi in 2024 is not just a trend; it’s a revolution that democratizes finance, enhances security and transparency, and fosters continuous innovation. As we proceed through this presentation, we'll explore the various components and services of DeFi in detail, shedding light on how they are transforming the financial landscape.
At Intelisync, we specialize in providing comprehensive DeFi development services tailored to meet the unique needs of our clients. From smart contract development to dApp creation and security audits, we ensure that your DeFi project is built with innovation, security, and scalability in mind. Trust Intelisync to guide you through the intricate landscape of decentralized finance and unlock the full potential of blockchain technology.
Ready to take your DeFi project to the next level? Partner with Intelisync for expert DeFi development services today!
GraphRAG for Life Science to increase LLM accuracyTomaz Bratanic
GraphRAG for life science domain, where you retriever information from biomedical knowledge graphs using LLMs to increase the accuracy and performance of generated answers
5th LF Energy Power Grid Model Meet-up SlidesDanBrown980551
5th Power Grid Model Meet-up
It is with great pleasure that we extend to you an invitation to the 5th Power Grid Model Meet-up, scheduled for 6th June 2024. This event will adopt a hybrid format, allowing participants to join us either through an online Mircosoft Teams session or in person at TU/e located at Den Dolech 2, Eindhoven, Netherlands. The meet-up will be hosted by Eindhoven University of Technology (TU/e), a research university specializing in engineering science & technology.
Power Grid Model
The global energy transition is placing new and unprecedented demands on Distribution System Operators (DSOs). Alongside upgrades to grid capacity, processes such as digitization, capacity optimization, and congestion management are becoming vital for delivering reliable services.
Power Grid Model is an open source project from Linux Foundation Energy and provides a calculation engine that is increasingly essential for DSOs. It offers a standards-based foundation enabling real-time power systems analysis, simulations of electrical power grids, and sophisticated what-if analysis. In addition, it enables in-depth studies and analysis of the electrical power grid’s behavior and performance. This comprehensive model incorporates essential factors such as power generation capacity, electrical losses, voltage levels, power flows, and system stability.
Power Grid Model is currently being applied in a wide variety of use cases, including grid planning, expansion, reliability, and congestion studies. It can also help in analyzing the impact of renewable energy integration, assessing the effects of disturbances or faults, and developing strategies for grid control and optimization.
What to expect
For the upcoming meetup we are organizing, we have an exciting lineup of activities planned:
-Insightful presentations covering two practical applications of the Power Grid Model.
-An update on the latest advancements in Power Grid -Model technology during the first and second quarters of 2024.
-An interactive brainstorming session to discuss and propose new feature requests.
-An opportunity to connect with fellow Power Grid Model enthusiasts and users.
This presentation provides valuable insights into effective cost-saving techniques on AWS. Learn how to optimize your AWS resources by rightsizing, increasing elasticity, picking the right storage class, and choosing the best pricing model. Additionally, discover essential governance mechanisms to ensure continuous cost efficiency. Whether you are new to AWS or an experienced user, this presentation provides clear and practical tips to help you reduce your cloud costs and get the most out of your budget.
Skybuffer SAM4U tool for SAP license adoptionTatiana Kojar
Manage and optimize your license adoption and consumption with SAM4U, an SAP free customer software asset management tool.
SAM4U, an SAP complimentary software asset management tool for customers, delivers a detailed and well-structured overview of license inventory and usage with a user-friendly interface. We offer a hosted, cost-effective, and performance-optimized SAM4U setup in the Skybuffer Cloud environment. You retain ownership of the system and data, while we manage the ABAP 7.58 infrastructure, ensuring fixed Total Cost of Ownership (TCO) and exceptional services through the SAP Fiori interface.
Let's Integrate MuleSoft RPA, COMPOSER, APM with AWS IDP along with Slackshyamraj55
Discover the seamless integration of RPA (Robotic Process Automation), COMPOSER, and APM with AWS IDP enhanced with Slack notifications. Explore how these technologies converge to streamline workflows, optimize performance, and ensure secure access, all while leveraging the power of AWS IDP and real-time communication via Slack notifications.
HCL Notes and Domino License Cost Reduction in the World of DLAUpanagenda
Webinar Recording: https://www.panagenda.com/webinars/hcl-notes-and-domino-license-cost-reduction-in-the-world-of-dlau/
The introduction of DLAU and the CCB & CCX licensing model caused quite a stir in the HCL community. As a Notes and Domino customer, you may have faced challenges with unexpected user counts and license costs. You probably have questions on how this new licensing approach works and how to benefit from it. Most importantly, you likely have budget constraints and want to save money where possible. Don’t worry, we can help with all of this!
We’ll show you how to fix common misconfigurations that cause higher-than-expected user counts, and how to identify accounts which you can deactivate to save money. There are also frequent patterns that can cause unnecessary cost, like using a person document instead of a mail-in for shared mailboxes. We’ll provide examples and solutions for those as well. And naturally we’ll explain the new licensing model.
Join HCL Ambassador Marc Thomas in this webinar with a special guest appearance from Franz Walder. It will give you the tools and know-how to stay on top of what is going on with Domino licensing. You will be able lower your cost through an optimized configuration and keep it low going forward.
These topics will be covered
- Reducing license cost by finding and fixing misconfigurations and superfluous accounts
- How do CCB and CCX licenses really work?
- Understanding the DLAU tool and how to best utilize it
- Tips for common problem areas, like team mailboxes, functional/test users, etc
- Practical examples and best practices to implement right away
Monitoring and Managing Anomaly Detection on OpenShift.pdfTosin Akinosho
Monitoring and Managing Anomaly Detection on OpenShift
Overview
Dive into the world of anomaly detection on edge devices with our comprehensive hands-on tutorial. This SlideShare presentation will guide you through the entire process, from data collection and model training to edge deployment and real-time monitoring. Perfect for those looking to implement robust anomaly detection systems on resource-constrained IoT/edge devices.
Key Topics Covered
1. Introduction to Anomaly Detection
- Understand the fundamentals of anomaly detection and its importance in identifying unusual behavior or failures in systems.
2. Understanding Edge (IoT)
- Learn about edge computing and IoT, and how they enable real-time data processing and decision-making at the source.
3. What is ArgoCD?
- Discover ArgoCD, a declarative, GitOps continuous delivery tool for Kubernetes, and its role in deploying applications on edge devices.
4. Deployment Using ArgoCD for Edge Devices
- Step-by-step guide on deploying anomaly detection models on edge devices using ArgoCD.
5. Introduction to Apache Kafka and S3
- Explore Apache Kafka for real-time data streaming and Amazon S3 for scalable storage solutions.
6. Viewing Kafka Messages in the Data Lake
- Learn how to view and analyze Kafka messages stored in a data lake for better insights.
7. What is Prometheus?
- Get to know Prometheus, an open-source monitoring and alerting toolkit, and its application in monitoring edge devices.
8. Monitoring Application Metrics with Prometheus
- Detailed instructions on setting up Prometheus to monitor the performance and health of your anomaly detection system.
9. What is Camel K?
- Introduction to Camel K, a lightweight integration framework built on Apache Camel, designed for Kubernetes.
10. Configuring Camel K Integrations for Data Pipelines
- Learn how to configure Camel K for seamless data pipeline integrations in your anomaly detection workflow.
11. What is a Jupyter Notebook?
- Overview of Jupyter Notebooks, an open-source web application for creating and sharing documents with live code, equations, visualizations, and narrative text.
12. Jupyter Notebooks with Code Examples
- Hands-on examples and code snippets in Jupyter Notebooks to help you implement and test anomaly detection models.
Ocean lotus Threat actors project by John Sitima 2024 (1).pptxSitimaJohn
Ocean Lotus cyber threat actors represent a sophisticated, persistent, and politically motivated group that poses a significant risk to organizations and individuals in the Southeast Asian region. Their continuous evolution and adaptability underscore the need for robust cybersecurity measures and international cooperation to identify and mitigate the threats posed by such advanced persistent threat groups.
Driving Business Innovation: Latest Generative AI Advancements & Success StorySafe Software
Are you ready to revolutionize how you handle data? Join us for a webinar where we’ll bring you up to speed with the latest advancements in Generative AI technology and discover how leveraging FME with tools from giants like Google Gemini, Amazon, and Microsoft OpenAI can supercharge your workflow efficiency.
During the hour, we’ll take you through:
Guest Speaker Segment with Hannah Barrington: Dive into the world of dynamic real estate marketing with Hannah, the Marketing Manager at Workspace Group. Hear firsthand how their team generates engaging descriptions for thousands of office units by integrating diverse data sources—from PDF floorplans to web pages—using FME transformers, like OpenAIVisionConnector and AnthropicVisionConnector. This use case will show you how GenAI can streamline content creation for marketing across the board.
Ollama Use Case: Learn how Scenario Specialist Dmitri Bagh has utilized Ollama within FME to input data, create custom models, and enhance security protocols. This segment will include demos to illustrate the full capabilities of FME in AI-driven processes.
Custom AI Models: Discover how to leverage FME to build personalized AI models using your data. Whether it’s populating a model with local data for added security or integrating public AI tools, find out how FME facilitates a versatile and secure approach to AI.
We’ll wrap up with a live Q&A session where you can engage with our experts on your specific use cases, and learn more about optimizing your data workflows with AI.
This webinar is ideal for professionals seeking to harness the power of AI within their data management systems while ensuring high levels of customization and security. Whether you're a novice or an expert, gain actionable insights and strategies to elevate your data processes. Join us to see how FME and AI can revolutionize how you work with data!
Ivanti’s Patch Tuesday breakdown goes beyond patching your applications and brings you the intelligence and guidance needed to prioritize where to focus your attention first. Catch early analysis on our Ivanti blog, then join industry expert Chris Goettl for the Patch Tuesday Webinar Event. There we’ll do a deep dive into each of the bulletins and give guidance on the risks associated with the newly-identified vulnerabilities.
Main news related to the CCS TSI 2023 (2023/1695)Jakub Marek
An English 🇬🇧 translation of a presentation to the speech I gave about the main changes brought by CCS TSI 2023 at the biggest Czech conference on Communications and signalling systems on Railways, which was held in Clarion Hotel Olomouc from 7th to 9th November 2023 (konferenceszt.cz). Attended by around 500 participants and 200 on-line followers.
The original Czech 🇨🇿 version of the presentation can be found here: https://www.slideshare.net/slideshow/hlavni-novinky-souvisejici-s-ccs-tsi-2023-2023-1695/269688092 .
The videorecording (in Czech) from the presentation is available here: https://youtu.be/WzjJWm4IyPk?si=SImb06tuXGb30BEH .
Letter and Document Automation for Bonterra Impact Management (fka Social Sol...Jeffrey Haguewood
Sidekick Solutions uses Bonterra Impact Management (fka Social Solutions Apricot) and automation solutions to integrate data for business workflows.
We believe integration and automation are essential to user experience and the promise of efficient work through technology. Automation is the critical ingredient to realizing that full vision. We develop integration products and services for Bonterra Case Management software to support the deployment of automations for a variety of use cases.
This video focuses on automated letter generation for Bonterra Impact Management using Google Workspace or Microsoft 365.
Interested in deploying letter generation automations for Bonterra Impact Management? Contact us at sales@sidekicksolutionsllc.com to discuss next steps.
Programming Foundation Models with DSPy - Meetup SlidesZilliz
Prompting language models is hard, while programming language models is easy. In this talk, I will discuss the state-of-the-art framework DSPy for programming foundation models with its powerful optimizers and runtime constraint system.
Programming Foundation Models with DSPy - Meetup Slides
Fuzzy Rule Base System for Software Classification
1. International Journal of Computer Science & Information Technology (IJCSIT) Vol 5, No 3, June 2013
DOI : 10.5121/ijcsit.2013.5301 1
Fuzzy Rule Base System for Software
Classification
Adnan Shaout* and Juan C. Garcia+
The Electrical and Computer Engineering Department
The University of Michigan – Dearborn, Dearborn, Michigan
*shaout@umich.edu; +garciajc@umd.umich.edu
ABSTRACT
Given the central role that software development plays in the delivery and application of information
technology, managers have been focusing on process improvement in the software development area. This
improvement has increased the demand for software measures, or metrics to manage the process. This
metrics provide a quantitative basis for the development and validation of models during the software
development process. In this paper a fuzzy rule-based system will be developed to classify java applications
using object oriented metrics. The system will contain the following features:
Automated method to extract the OO metrics from the source code,
Default/base set of rules that can be easily configured via XML file so companies, developers, team
leaders, etc, can modify the set of rules according to their needs,
Implementation of a framework so new metrics, fuzzy sets and fuzzy rules can be added or removed
depending on the needs of the end user,
General classification of the software application and fine-grained classification of the java classes
based on OO metrics, and
Two interfaces are provided for the system: GUI and command.
KEYWORDS
Fuzzy Based Rule model, Object Oriented Principles, Object Oriented Metrics, Java Patterns, Transitive
Closure Relation, Decomposition Trees, Software classification, Software reliability.
1. INTRODUCTION
With the development of Object-Oriented (OO) paradigm since the early 1990s the development
and use of metrics has been growing. Several studies and research papers were dedicated to the
study of OO metrics and research of tools using these metrics. In 1994 Chidamber [1] developed
and implemented a set of six metrics for OO design: response for a class (RFC), weighted
methods per class (WMC), coupling between objects (CBO), lack of cohesion (LCOM), number
of children (NOC), and depth of inheritance tree (DIT). These metrics are described in section 2
of this paper.
Despite the number of investigations in several areas and the development of some tools to gather
metrics, OO metrics haven’t been widely adopted by the software development community. This
seems to be due to the following factors:
2. International Journal of Computer Science & Information Technology (IJCSIT) Vol 5, No 3, June 2013
2
• As pointed by Ampatzoglou and Chatzigeorgiou [4], Sarkar et al [8] some metrics are
collected manually, or there is manual intervention during their collection or
preprocessing.
• Chidamber and. Kemerer[1], Rosenberg [2], Ampatzoglou, Chatzigeorgiou [4], Sarkaret
al [8] showed that the metrics seem to be independent from each other and
managers/leaders/architects have to analyze metrics separately.
• In their research Pizzia, Pedrycz [7], K. Elish and M. Elish [6] showed there are usually
complex methodologies that need to be applied after the metrics are extracted in order to
obtain the analysis, results and prediction of the system.
• Thwin and Quah [3], Quah [5], K. Elish and M. Elish [6], and Pizzia and Pedrycz [7]
demonstrated that the metrics computed with other factors help predict the reliability and
quality of the system, but the metrics haven’t been used to produce the classification of
the system.
• Additionally as presented by Virtual Machinery [9] in their application the JHawk, the
results of the metrics give a complexity analysis and statistical information, but do not
produce any classification or suggestion how to reduce the value of the metrics.
Due to these factors and because of Object Oriented metrics present concepts like loosely or
tightly coupled, high or lack of cohesion, etc. that provide unsharp boundaries and allow gradual
transition closer to human interpretation we propose to develop a system to classify java
applications based on OO metrics. The system will contain the following features:
• Automated method to extract the OO metrics from the source code
• Default/base set of rules that can be easily configured via XML file so companies,
developers, team leaders, etc, can modify the set of rules according to their needs.
• Implementation of a framework so new metrics, fuzzy sets and fuzzy rules can be added
or removed depending on the needs of the end user.
• General classification of the software application and fine-grained classification of the
java classes based on OO metrics.
• Two interfaces are provided for the system: GUI and command.
The paper is organized as follows: Section 2 shows the definition of the traditional and object
oriented metrics utilized. Section 3 shows the software application design including use cases,
sequence and class diagrams. Section 4 shows the design of the fuzzy system including block
diagram and the definition of membership functions and fuzzy rules. Section 5 shows the data of
the applications being evaluated. Section 6 shows the experiments and results of the fuzzy system
compared to those of a manual analysis. Finally section 7 concludes and presents future work for
this paper.
1.1 Background
Many traditional and object oriented metrics extract information of the application regarding
traditional principles and object oriented principles like complexity, inheritance, coupling,
cohesion, polymorphism, etc. The following is the description of the metrics that will be used in
this paper:
Lines of Code – LOC: This is a traditional metrics and counts all lines within the class including
blank lines, command lines and comment lines. Size of a class is used to evaluate the ease of
understanding of code during development and maintenance [2]. The rationale of this class is that
3. International Journal of Computer Science & Information Technology (IJCSIT) Vol 5, No 3, June 2013
3
high number of lines of code increases complexity of the code, making it difficult to understand,
maintain and test.
Weighted Methods per Class – WMC: This is object oriented metric was developed by
Chidamber [1], and counts the number of methods implemented within a class or the sum of the
complexities of the methods [1]. The rationale of this metric is that classes with many methods
are likely to be more application specific, limiting the possibility of reuse [2].
Response for a Class – RFC: This object oriented metric counts the set of methods that can be
invoked in response to a message to an object of the class or by some method in the class [1]. The
rationale of this metric is that the larger the number of methods that can be invoked from a class
through messages, the greater the complexity of the class. Therefore testing and debugging
becomes complicated since it requires a greater level of understanding from the tester [2].
Lack of Cohesion – LCOM2: It counts the percentage of methods that do not access a specific
attribute averaged over all attributes in the class [1]. For this metric a low cohesion increases
complexity, thereby increasing the likelihood of errors during the development process. Equation
(1) shows the LCOM2 metric.
LCOM2 = 1 −
∑(mA)
m ∗ 1
(1)
where mA is the number of methods that access a variable, m is the number of methods in a class
and A is number of variables (attributes) in a class.
Coupling Between Object Classes – CBO: This metric counts the number of other classes to
which a class is coupled [1]. Excessive coupling is detrimental to modular design and prevents
reuse. Therefore the tighter the coupling the more sensitivity are the changes in other parts of the
application [2].
Depth of Inheritance Tree – DIT: This metric measures the maximum inheritance path from the
class to the root class [1]. The deeper a class within the hierarchy the greater the number methods
it is likely to inherit making the code more complex to predict its behavior. Deeper trees
constitute greater design complexity, since more methods and classes are involved [2].
Number of Children - NOC: This metric count the number of immediate subclasses subordinate
to a class in the hierarchy. NOC and DIT are closely related because NOC measures the breadth
of a class hierarchy, where maximum DIT measures the depth [1]. A high value of this metric
increases the likelihood of improper abstraction and the probability of misusing sub classing [2].
Method Hiding Factor – MHF: This metric measures how variables and methods are
encapsulated in a class in relation to all the classes in the application. The invisibility of a method
is the percentage of the total classes from which this method is not visible. The ideal value is
between 8% and 24%. A low value indicates insufficiently abstracted implementation and a high
value indicates very little functionality. The larger the proportion of methods unprotected the
higher the probability of errors [13]. Equation (2) shows the MHF metric.
MHF =
∑ M (C )
∑ M (C )
(2)
4. International Journal of Computer Science & Information Technology (IJCSIT) Vol 5, No 3, June 2013
4
where TC is the total number of classes, Mh is the number of methods hidden and Md is the
number of methods defined in a class.
Attribute Hiding Factor – AHF: this metric measure how variables are encapsulated in a class
in relation to all the classes in the application. The invisibility of an attribute is the percentage of
the total classes from which this method is not visible. Encapsulation indicates that the attributes
should have no visibility to other classes therefore the ideal value for this metric is 100% [10].
Equation (3) shows the AHF metric.
AHF =
∑ A (C )
∑ A (C )
(3)
where Ah is the number of attributes hidden and Ad is the number of attributes defined in a class.
Method Inheritance Factor – MIF: this metric measure the inherited methods in a class in
relation to all the classes in the application. For this metric a very high value indicates
superfluous inheritance, wide member scopes. Low value indicates lack of inheritance and heavy
use of Overrides. The ideal value for this metric should be between 20%-80% [13]. Equation (4)
shows the MIF metric.
MIF =
∑ M (C )
∑ M (C )
(4)
where Mi is the number of methods inherited and Ma is the number of methods defined in a class.
Attribute Inheritance Factor – AIF: This metric measure the number of attributes inherited in a
class in relation to all the classes in the application. The ideal value for this metrics is between
0% and 48%. A very high value indicates superfluous inheritance and wide member scopes. A
low value indicates lack of inheritance and heavy use of Overrides [10]. Equation (5) shows the
AIF metric.
AIF =
∑ A (C )
∑ A (C )
(5)
where Ai is the number of attributes inherited and Aa is the number of attributes defined in a class.
Coupling Factor – COF: It measures the actual coupling among classes in relation to the
maximum number of possible couplings. The ideal value for COF is between 0% and 12%. A
very high value should be avoided because tightly coupled relations increase complexity, reduce
encapsulation, reduce potential reuse, and limit understandability and maintainability [10].
Equation (6) shows the COF metric.
COF =
∑ [∑ is_client(C , C )]
TC − TC
(6)
where is_client(Ci,Cj)is 1 if Cj is a client of Ci, otherwise is 0.
5. International Journal of Computer Science & Information Technology (IJCSIT) Vol 5, No 3, June 2013
5
Polymorphism Factor – POF: This metric measures the degree of method overriding in the class
inheritance tree. Polymorphism should be used to a reasonable extent to keep the code clear, but
excessively polymorphic code is too complex to understand. Equation (7) shows the POF metric.
POF =
∑ M (C )
∑ [M (C ) ∗ DC(C)]
(7)
where Mo is the number of methods overridden and Mn is the number of new methods defined in
a class.
2. APPLICATION DESIGN
Use case Diagram: For the application, five main use case diagrams were designed: Run
Diagnose, Load Configuration, Extract Metrics, Fuzzy Diagnose, and Generate Report. These use
cases are shown in figure 1 below.
Figure 1. Use Case Diagram
Run Diagnose is the main use case diagram and orchestrates the execution of all the other use
cases. Load Configuration loads the configuration of the fuzzy system; this configuration
supports fuzzy sets, fuzzy rules and definition of OO Metrics. In addition, this use case loads the
information of the classes, class variables methods, variables methods, etc., and it is utilized
during the calculation of the OO metrics. Fuzzy Diagnose use case basically processes all the
fuzzy rules. It computes two outcomes: fine-grained report for each of the classes within the
application and a comprehensive report for the entire application. Finally Generate Report use
case generates a classification report including a decomposition tree in two formats: XML and
screen.
u c P rim a ry U s e C a s e s
L o a d C o n fig u ra tio n
U s e r
ru n D ia g n o s e
e x tra c t M e tric s
fu z z y D ia g n o s e
G e n e ra te R e p o rt
G e n e ra te Tre e
D e c o m p o s itio n
« i n v o ke s»
« i n v o ke s»
« i n v o ke s»
« i n v o ke s»
« i n v o ke s»
6. International Journal of Computer Science & Information Technology (IJCSIT) Vol 5, No 3, June 2013
6
The following subsections explain each of the subsystems within the application:
Fuzzy Rules Engine: This subsystem shown in figure 2 is responsible for the execution of the
fuzzy rules defined in the system. The most important classes of this subsystem are RulesEngine
and FuzzyRuleBasedEngine. RulesEngine is the main class of the template pattern and contains
all the steps of the fuzzy rules-based inference Engine: matching degree, inference, combination
and defuzzification [11]. FuzzyRuleBasedEngine implements each of the steps defined in Rules
Engine.
Figure 2. Class Diagram – The Fuzzy Rules Engine Subsystem
Object Oriented Metrics Engine: This subsystem orchestrates the extraction of each of the metrics
as shown in figure 3. The main classes are: The Metric interface utilized to define the signature of
the methods that needs to be implemented by each of the concrete OO metric classes, and
ConcreteMetricsEngine that executes each of the classes that implements the Metric Interface.
classfuzzyrules
RulesEngine
+ combination():void
+ defuzzification():void
+ execute(Metric,Rule):void
+ fuzzyMatching():void
+ inference():void
FuzzyRule
- then: String
+ execute():Set
+ getThenCondition():void
FuzzySet
+ getId():void
+ getLabel():void
+ getValue():void
FuzzyRulesDetailReport
FuzzyRuleBasedEngine
+ combination():void
+ defuzzification():void
+ fuzzyMatching():void
+ inference():void
«interface»
DefuzzificationMethod
+ execute(Set):Output
MeanOfMax
+ execute(Set):Output
FuzzySetAscendent
+ getId():void
+ getLabel():void
+ getValue():void
FuzzySetDescendent
+ getId():void
+ getLabel():void
+ getValue():void
FuzzySetTriangle
+ getId():void
+ getLabel():void
+ getValue():void
FuzzySetTrapezoide
+ getId():void
+ getLabel():void
+ getValue():void
FuzzyEngineReport
ClippingMethod
+ execute():void
Composite
+ addCompositeCondition():void
+ calculateAntecedent():void
+ removeCompositeCondition():void
InferenceMethod
+ execute():void
OrComposite
+ addCompositeCondition():void
+ calculateAntecedent():void
+ removeCompositeCondition():void
AndComposite
+ addCompositeCondition():void
+ calculateAntecedent():void
+ removeCompositeCondition():void
ConsitionComposite
+ addCompositeCondition():void
+ calculateAntecedent():void
+ removeCompositeCondition():void
leaf
7. International Journal of Computer Science & Information Technology (IJCSIT) Vol 5, No 3, June 2013
7
Figure 3. Class Diagram – OO Metrics Subsystem
3. FUZZY SYSTEM DESIGN
3.1 Design of the diagnosis system
The objective of the system is to classify the reliability and potential design flaws of java
applications based on OO Metrics. Figure 4 shows the block diagram of the overall system.
Figure 4. Block Diagram of the fuzzy system
class metrics
CBO
+ execute() : void
LOC
+ execute() : void
WM C
+ execute() : void
ConcreteM etricsEngine
+ getClassInfo() : RealClassInfo
+ process(String) : M etricReport[]
JavaClassInfo
+ getAttributes() : String
+ getClassInfo() : void
+ getMethods() : void
ProxyClassInfo
+ getAttributes() : String
+ getClassInfo() : void
+ getM ethods() : void
Jav aApplication
+ getFile(String) : void
+ getFiles() : void
M etricReport
+ getDetail() : String[]
+ getId() : void
+ getValue() : double
«interface»
M etric
+ execute() : void
RealClassInfo
+ getAttributes() : void
+ getClassInfo() : void
+ getM ethods() : void
Jav aM ethodInfo Jav aAttributeInfo
«interface»
M etricsEngine
+ getClassInfo() : RealClassInfo
+ process(String) : MetricReport[]
realSubject
analysis Block Diagram
Knowledge Base
Metrics
Rules BasedEngine
Inference Engine Defuzzifier
FuzzyRules - Class
FuzzyRules -
Application
Fuzzifier Classification
FuzzySets
LOC, WMC, RFC, LCOM2, CBO, DIT, and NOC
NOC, DIT, MHF, AHF, MIF, AIF, COFand POF
Crisp value Fuzzy Fuzzy Crisp value
8. International Journal of Computer Science & Information Technology (IJCSIT) Vol 5, No 3, June 2013
8
The input of the system is the OO metrics extracted from java application. The Fuzzifier
calculates the matching degree of the metrics that matches the condition of the fuzzy rules. The
Inference Engine calculates the rule’s conclusion based on its matching degree by using the
clipping method, and combines the conclusion inferred by all fuzzy rules in a final conclusion.
Finally, the Defuzzifier process coverts the fuzzy conclusion into a crisp value by using the mean
of max method. There are two types of results given by the system: A fine-grained classification
for each of the classes and a general classification for the java application being evaluated [11].
For this reason two sets of rules are defined: one set of rules to classify single classes and another
one to evaluate the application. Moreover a decomposition tree is generated for all the classes
reported during the fined-grain classification. This tree will help the developer to analyze and
address classes with similar values. Unfortunately due to performance constraints only systems
that report less than 200 classes will generate this similarity tree.
3.2 Input variables
The input variables of the system are the following Object Oriented metrics:
LOC = Lines of code; WMC = Weighted Methods per Class
RFC = Response for a Class; LCOM2 = Lack of Cohesion
CBO= Coupling Between Object Classes; NOC= Number of Children; DIT = Depth of
Inheritance Tree; MHF= Method Hiding Factor; AHF= Attribute Hiding Factor; MIF= Method
Inheritance Factor; AIF= Attribute Inheritance Factor; COF= Coupling Factor;
POF= Polymorphism Factor
3.3 Output variables
The output variable of the system is defined as:
OODC= Software classification.
3.4 Definitions
The definition of the values used in the fuzzy sets and fuzzy rules are: C- Critical, H – High, M –
Medium, N – Normal, L – Low, VL – Very Low
3.5 Membership function definition
The membership functions have been designed based on empirical results presented by
Chidamber [1], Rosenberg [2] and Briand [13]. The design of the membership functions has
followed the conditions proposed by Yen and Langary [11] where “each function overlaps only
with the closest neighboring membership function and for any possible input data, its membership
values in all relevant fuzzy sets should sum to 1 or nearly so”. The following is the definition for
each of the metrics:
WMC: For this metric three membership functions were designed: normal (x: 10, 20), medium (x:
10, 20, 30) and high (x: 20, 30). The normal value was chosen based on two observations:
Rosenberg’s experiment [2] showed a histogram with values between 0 and 20 for most of the
classes; on the other hand Chidamber [1] reported most of the cases with values between 0 and
10. As a result the values for the normal membership function are chosen with values between 0
9. International Journal of Computer Science & Information Technology (IJCSIT) Vol 5, No 3, June 2013
9
and 20. The medium and high membership functions are derived based on Yen and Langary [11]
using an overlap of 10. The membership functions are shown in the figure 5.
Figure 5. WMC membership functions
RFC: For this metric three membership functions were created: normal (x: 30, 40), medium (x:
30, 40, 50) and high (x: 40, 50). The empirical data from Rosenberg [2] showed that the majority
of classes only invoke between 0 and 40 methods; on the other hand Chidamber [1] reported a
median value between 6 and 29. Based on this information the normal membership function is
defined with values between 0 and 40; and medium and high fuzzy sets are derived based on Yen
and Langary [14]. The membership functions are shown in figure 6.
Figure 6. RFC membership functions
LCOM2: For this metric three membership functions were created: normal (x: 60, 70), medium
(x: 60, 70, 80) and high (x: 70, 80). Rosenberg [2] did not present statistical data for this metric
however she said that “smaller LCOM to its maximum value the better”. On the other hand
Briand [13] obtained a median value 64% and min value 18%. The normal value is derived based
on this median and the other two membership functions are derived based on Yen and Langary
[11]. The membership functions are shown in figure 7.
Figure 7. LCOM2 membership functions
CBO: For this metric three membership functions were defined: normal (x: 5, 10), medium (x: 5,
10, 15), high (x: 10, 15). Rosenberg [2] reported than more than one-third of the classes reported
values between 0 and 10 and fewer classes between 11 and 13. On the other hand Chidamber [1]
obtained a median value between 0 and 9. Based on this information the normal membership
function is defined with values between 0 and 10; the other fuzzy sets are derived based on Yen
and Langary [11] using overlapping of 5. The membership functions are shown in figure 8.
0
2
0 10203050
NOR
MAL
MEDI
UM
0
1
2
0 40 60
NOR
MAL
MED
IUM
0
1
2
0 70 100
NOR
MAL
MEDI
UM
10. International Journal of Computer Science & Information Technology (IJCSIT) Vol 5, No 3, June 2013
10
Figure 8. CBO membership functions
DIT: For this metric three membership functions were defined: normal (x: 3, 6), medium (x: 3, 6,
9) and high (x: 6, 9). Rosenberg [2] reported 60% classes with a DIT less than or equal to 1, 20%
between 2 and 3; and only 5% greater than 5. Chidamber [1] on the other hand reported a
maximum DIT of 10, and a median value between 1 and 3. Based on this information the normal
membership function is chosen between 0 and 6 and the other membership functions are derived
based on Yen and Langary [11]. The membership functions are shown in figure 9.
Figure 9. DIT membership functions
NOC: For this metric three membership functions were created: normal (x: 10, 20), medium (x:
10, 20, 30) and high (20, 30). For this metric Rosenberg [2] reported that most of the classes had
between 0 and 10 children, and fewer classes between 10 and 20 children. On the other hand
Chidamber [1] reported that most of the classes did not have children, and that the maximum
value obtained in this metric was between 42 and 50. Giving an overlap of 10 the normal
membership function is chosen with values between 0 and 20; and the other fuzzy sets are derived
based on Yen and Langary [11]. The membership functions are shown in figure 10.
Figure 10. NOC membership functions
LOC: for this metric three membership functions were defined: normal (x: 750, 1000), medium
(x: 750, 1000, 1250) and high (x:1000,1250). The fuzzy sets for this metric have been defined
based on intuition rather than empirical or theoretical data. As per definition of this metric a class
with a low number of lines will be less complex and easier to maintain and test. We considered a
class with a normal value to be between 0 and 1000 lines of code. The other membership
0
0.5
1
1.5
0 10 20
NOR
MAL
MEDI
UM
HIGH
0
0.5
1
1.5
0 6 10
NOR
MAL
MED
IUM
0
0.5
1
1.5
0 20 50
NOR
MAL
MEDI
UM
HIGH
11. International Journal of Computer Science & Information Technology (IJCSIT) Vol 5, No 3, June 2013
11
functions are derived with an overlap of 250 based on Yen and Langary [11]. The membership
functions are shown in figure 11.
Figure 11. LOC membership functions
MHF: For this metric five membership functions were created: very low (x: 5, 10), low (x: 5, 10,
15), normal (x: 10, 15, 20, 25), medium (20, 25, 30) and high (x: 25, 30). The normal
membership function was defined based on the statistical distribution reported by Brito et al [10].
In this case most of the cases and contained values between 8-25%. Therefore a normal fuzzy set
is defined using trapezoidal form with values 10,15,20,25. The other membership functions are
derived based on Yen and Langary [11] using an overlap of 5. The membership functions are
shown in figure 12.
Figure 12. MHF membership functions
AHF: For this metric three membership functions were defined: normal (x: 80, 90), medium (70,
80, 90) and high (70, 80). Due to the encapsulation paradigm Brito et al [10] concluded that a
good value for this metric should be 100%. However taking into account static variables shared
across different classes then the normal membership function is defined with values between 80
and 100. The other membership functions are defined based on Yen and Langary [11] using an
overlap of 10. The membership functions are shown in figure 13 below.
Figure 13. AHF membership functions
0
0.5
1
1.5
0
1000
2000
NOR
MAL
MED
IUM
HIGH
0
0.5
1
1.5
0 10 20 30
VERY
LOW
LOW
NORM
AL
0
0.5
1
1.5
0 80 100
NORM
AL
MEDIU
M
HIGH
12. International Journal of Computer Science & Information Technology (IJCSIT) Vol 5, No 3, June 2013
12
MIF: For this metric five membership functions were defined: very low (x: 15, 20), low (15, 20,
25), normal (x: 20, 25, 75, 80), medium (x: 75, 80, 85) and high (80, 85). Brito et al [10] reported
an average of 85% among 5 applications and suggested a metric value between 20% and 80%.
Therefore the normal membership function is defined in a trapezoidal form with values 20, 25, 75
and 80. The other fuzzy sets are derived based on Yen and Langary [11] using an overlap of 5.
The membership functions are shown in figure 14 below.
Figure 14. MIF membership functions
AIF: For this metric three membership functions were defined: normal (x: 40, 50), medium (x:
40, 50, 55, 65) and high (x: 55, 65). Brito et al [10] reported a statistical distribution with most
classes between 50 and 65%, maximum value 80% and minimum value of 40%. They also
suggested a metric value between 0 and 48%. For this reason a normal membership function is
defined using a trapezoidal form with values 40, 50, 55, 65 and the other membership functions
are derived based on Yen and Langary [11] with an overlap of 10. The membership functions are
shown in figure 15.
Figure 15. AIF membership functions
COF: For this metric three membership functions were created: normal (x: 10, 20), medium (x:
10, 20, 30) and high (x: 20, 30). Brito et al [10]. The reported statistical distributions with most
values are between 5% and 15%, the maximum value is 30% and the minimum value is 3%. They
also suggested an ideal value of less than 12%. Therefore a normal membership function is
defined with values between 0 and 20 and the other membership functions are derived based on
Yen and Langary [11] using an overlap of 10. The membership functions are shown in figure 16.
0
0.5
1
1.5
0
20
75
85
VERY
LOW
LOW
NORM
AL
0
0.5
1
1.5
0 50 65
NORM
AL
MEDIU
M
HIGH
13. International Journal of Computer Science & Information Technology (IJCSIT) Vol 5, No 3, June 2013
13
Figure 16. COF membership functions
POF: For this metric three membership functions were created: normal (x: 0, 10), medium (x: 0,
10, 20) and high (x: 10, 20). Brito et al [10] reported two tendencies for this metric: one of them
states that POF should be greater than 10% due to polymorphism increases the flexibility of the
application, and the other one states than POF should be less than 10% because complexity
increases testability, maintainability and decreases understandability. In my opinion having very
low polymorphism defeats an important principle of object oriented programming, therefore a
normal membership function is chosen with values between 10 and 100. The other membership
functions are derived based on Yen and Langary [11] using and overlap of 10. The membership
functions are shown in figure 17.
Figure 17. POF membership functions
OODC: The output membership function has been defined with three membership functions:
critical (x: 80, 90, 100), high (x: 70, 80, 90) and medium (x: 60, 70, 80). If the matching degree
does not fall within these fuzzy sets then it is considered normal and not reported. The
membership functions are shown in figure 18.
Figure 18. OODC – Output membership functions
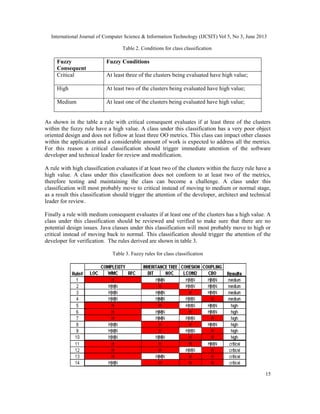
3.6 Fuzzy Rules Definition
The fuzzy rules are divided in two groups: fuzzy rules to classify single java classes and fuzzy
rules to classify the entire java application. The metrics to classify single java classes are: LOC,
WMC, RFC, LCOM2, CBO, DIT, and NOC. These metrics gather information about complexity,
0
0.5
1
1.5
0 10203050
NOR
MAL
MEDI
UM
HIGH
0
1
2
0 20 50
NOR
MAL
0
0.5
1
1.5
0 70 90
CRITIC
AL
HIGH
14. International Journal of Computer Science & Information Technology (IJCSIT) Vol 5, No 3, June 2013
14
cohesion, coupling and hierarchical tree of single classes. The metrics to classify the entire
application are: NOC, DIT, MHF, AHF, MIF, AIF, COF and POF; and they gather information
about encapsulation, inheritance, coupling and hierarchical tree structure of the entire application.
Both groups of metrics are complementary and their results provide detail and general
information about the application. It is worth to mention that despite of DIT and NOC do not
gather information at application level, their maximum value is used during the classification of
the application due to these metrics have a direct impact in the hierarchical structure of the
application.
The metrics are also divided in groups based on their objectives. Metrics that share the same
objective are grouped together and metrics that do not share same objective are left alone. Table 1
shows the results of this clustering.
Table 1. Metrics classification
Group # Metrics Objective
1 LOC, WMC, RFC Complexity
2 DIT, NOC Hierarchical tree.
3 LCOM2 Cohesion
4 CBO, CFO Coupling
5 MIF, AIF Inheritance
6 MHF, AHF Encapsulation
7 POF Polymorphism
These groups are used during the definition of the fuzzy rules. A single condition is defined by
one cluster and the entire fuzzy rule is defined with several conditions. The evaluation of the
metrics within the cluster is performed by using the OR command, and the evaluation of the
clusters within the fuzzy rule is performed by using the AND command. For example rule R1
defined as:
R1 IF (LOC IS HIGH OR WMC IS HIGH OR RFC IS HIGH) AND (DIT IS HIGH AND
NOC IS HIGH)… THEN
is evaluated within the fuzzy context using equation (8):
=
)}...(),(min{
)},(),(),(min{
max
21
321
1
Yy
xxx
R
ED
CBA
(8)
The next two sections explain the definition of the fuzzy rules for single java classes and for the
entire application.
Fuzzy Rules for Classification of Single Java Classes: These rules use the membership
functions LOC, WMC, RFC, LCOM2, CBO, DIT, and NOC; and classify the class as critical,
high or medium. Table 2 explains the conditions for each of the classifications.
15. International Journal of Computer Science & Information Technology (IJCSIT) Vol 5, No 3, June 2013
15
Table 2. Conditions for class classification
Fuzzy
Consequent
Fuzzy Conditions
Critical At least three of the clusters being evaluated have high value;
High At least two of the clusters being evaluated have high value;
Medium At least one of the clusters being evaluated have high value;
As shown in the table a rule with critical consequent evaluates if at least three of the clusters
within the fuzzy rule have a high value. A class under this classification has a very poor object
oriented design and does not follow at least three OO metrics. This class can impact other classes
within the application and a considerable amount of work is expected to address all the metrics.
For this reason a critical classification should trigger immediate attention of the software
developer and technical leader for review and modification.
A rule with high classification evaluates if at least two of the clusters within the fuzzy rule have a
high value. A class under this classification does not conform to at least two of the metrics,
therefore testing and maintaining the class can become a challenge. A class under this
classification will most probably move to critical instead of moving to medium or normal stage,
as a result this classification should trigger the attention of the developer, architect and technical
leader for review.
Finally a rule with medium consequent evaluates if at least one of the clusters has a high value. A
class under this classification should be reviewed and verified to make sure that there are no
potential design issues. Java classes under this classification will most probably move to high or
critical instead of moving back to normal. This classification should trigger the attention of the
developer for verification. The rules derived are shown in table 3.
Table 3. Fuzzy rules for class classification
16. International Journal of Computer Science & Information Technology (IJCSIT) Vol 5, No 3, June 2013
16
Fuzzy Rules for Application Classification: Similar to the fuzzy rules at the class level, the
rules of the application have critical, high or medium classification. These rules use the
membership functions: NOC, DIT, MHF, AHF, MIF, AIF, COF and POF. Table 4 shows the
conditions for each of the classifications mentioned.
Table 4. Conditions for application classification
Fuzzy
Consequent
Fuzzy Conditions
Critical At least three clusters have a high value;
High At least two clusters have a high value;
Medium At least one cluster has a high value.
As shown in the table a rule with critical fuzzy set consequent evaluates if at least three clusters in
the fuzzy rule have high value. Most probably the application has a very poor object oriented
design and a considerable amount is needed to redesign the application. This classification should
trigger immediate attention of the designer, architect, leader or project manager.
A rule with high fuzzy set consequent evaluates that at least two of the clusters in the fuzzy rule
have high value. If the result of the application falls under this classification then a review must
be performed and high values addressed. Medium values on the other hand should be reviewed
for potential redesign and modification. Usually an application under this classification will most
probably move to critical stage instead of medium or normal. This classification should trigger
the attention of the designer, architect, project leader or project manager for review of the design
and correction of the metrics.
Finally a rule with medium fuzzy set consequent evaluates if at least one of the clusters within the
fuzzy rule has high value. An application under this classification should be reviewed for
evaluation and verification. Without revision the application most probably will move to high or
critical instead of moving back to normal. This classification should trigger the attention of the
designer, leader or project manager for review. The rules derived are shown in table 5:
Table 5. Fuzzy rules for application classification
17. International Journal of Computer Science & Information Technology (IJCSIT) Vol 5, No 3, June 2013
17
4. DATAANALYSIS AND DATA PREPARATION
Three applications were diagnose during the experiments: two of them were provided by CGI,
one of the largest IT companies in Canada, and the other one is the java application developed for
this project. The experiments were executed using most of the java classes; however JUnit test
classes and Exception classes were excluded from the experiments. Because of its nature these
classes do not follow object oriented design principles, therefore can affect the results of the
metrics. Table 6 shows detail information of the applications.
Table 6. Java applications used during the experiment
Application #
Packages
#
Classes
Lines of Code
OODiagnose 6 90 6088
BIE Portal 43 842 77395
ETLF 4 45 2497
Manual analysis of the application was performed using histograms of the metrics, class diagrams
and java code. For this analysis concepts like rigidity, fragility, immobility and viscosity were
used to classify the application. Rigidity states that a simple change causes a cascade change in
the dependent modules. Fragility is defined as the tendency of a program to break in many places
when a single change is made. Immobility is the unsuccessful software reuse of the same design.
And viscosity is when usability and employability of the existing methods is very poor making
viscosity of the design very high [14]. These results were compared to those of the fuzzy
application for validation.
5. EXPEREIMENTS AND RESULTS
5.1 OO Diagnose application
Results of the Fuzzy System
During the diagnosis of the application the fuzzy system classified the application as normal.
Only MHF and NOC metrics were categorized as medium and the other metrics as normal. Table
7 shows the details of the metrics reported under this classification. These results showed a high
polymorphism, low coupling, good encapsulation, normal inheritance class and normal
inheritance tree reinforcing good object oriented principles.
Table 7. Classification of the Diagnose Application
Metric Classification Value
AHF Normal 96.80842
AIF Normal 35.80247
COF Normal 3.655041
DIT Normal 2
MHF Medium 24.18428
MIF Normal 69.55381
NOC Medium 15
POF Normal 90.625
18. International Journal of Computer Science & Information Technology (IJCSIT) Vol 5, No 3, June 2013
18
Regarding the diagnosis of the classes, the system reported 21 classes out of 90 classes being
evaluated: 3 of the classes with high and 18 medium classification. Figure 19 shows the Classes
vs. Classification per Metric. LCOM2 had the highest number of classes reported with 20 out of
21 classes with high and medium classification. On the other hand, DIT, LOC and NOC reported
normal classification for all the classes. As a result, the classes did not have a high complexity,
the inheritance was kept under control, and the coupling was low. The only concern was the high
of classes reported with multiple responsibilities.
Figure 19. Classes Reported vs Classification per Metric
The system also generated a decomposition tree for the classes reported. As shown in figure 20,
twenty one levels were generated, and the classes were grouped depending on the similarity of the
metrics. Two sample groups were verified:
1. Similarity group 2.76190476190476 reported JavaClassInfo and FuzzyRulesEngine
within the same group. They had normal CBO, DIT, LOC, RFC and WMC. One of the
classes reported medium and the other one high LCOM2.
2. Similarity group 1.78061224489796 reported DecompositionTreeAlgorithm and RFC
within the same group. They had high LCOM2, and normal DIT, LOC, RFC and WMC.
Once class had medium and the other normal CBO.
Figure 20. Similarity Groups- OO Design Application
0
10
20
30
CBODITLCOM2LOCNOCRFCWMC
hi
gh
19. International Journal of Computer Science & Information Technology (IJCSIT) Vol 5, No 3, June 2013
19
Results of the Manual Analysis
During the manual analysis the rigidity, fragility, immobility and viscosity of the application
showed low values based on the results of the metrics shown in figure 21. The inheritance of the
attributes (AIF) with 40% seems to be high because all the attributes should be encapsulated.
Figure 21. Metrics Results used during classification of the application.
The application seems to have “top heavy” architecture because DIT and NOC have lower values
keeping the inheritance under control. Application seems to be very flexible because POF and
MIF have high values. Due to these values it is suggested that the application has high inheritance
and high polymorphism. Revision of the source code demonstrated that this is due to the usage of
bridge and strategy pattern [15].
Figure 22. Histogram – CBO metric
Regarding the classification of the java classes the following observations draw the attention
during the verification: In general the classes seem to be well written however coupling (CBO)
seems to have a couple of outlier classes that need to be reviewed. This is shown in figure 22.
Comparison and Discussion
The results of the manual analysis and the fuzzy system are comparable. In general both results
reported a relatively good object oriented design. Regarding the fine-grained details both results
reported high lack of cohesion. There seems to be a problem with LCOM2 metric because false-
positives are being reported. During manual verification of the source code java bean objects are
being reported with medium and high values despite of the fact that they do have single
responsibility, low coupling and high encapsulation. Java Beans are reusable objects utilized in
java to represent objects and follow conventions about method naming, construction and
behavior; therefore these classes should be valid objects with normal cohesion [12].
0
50
100
150
AHF
COF
MHF
NOC
Series1
0
20
40
CBO
S…
20. International Journal of Computer Science & Information Technology (IJCSIT) Vol 5, No 3, June 2013
20
The only difference between the diagnosis procedures is that low values in deep of inheritance
tree (DIT) and number of children (NOC) were detected during the manual analysis of the
histograms. The fuzzy rules seem to be overseeing low values for these metrics; however this
appears to be a subjective assessment. As pointed by Rosenberg [2] higher values indicate higher
complexity which affects the maintainability and testability of the classes and therefore the
application [2]. The metrics provide a trade-off and their values should be assigned depending on
human experts, company policies, etc.
5. CONCLUSION AND FUTURE WORK
In this paper we developed a software system to diagnose the reliability of java applications using
object oriented metrics and a fuzzy rule-based system. The fuzzy membership functions and
fuzzy rules have been defined using statistical data from previous studies that have defined and
analyzed the different object oriented metrics. Three applications for different business purposes
and sizes have been analyzed, and results of the fuzzy system have been compared to those of a
manual analysis. The following can be inferred from the experiment:
• The fuzzy system has an appropriate default set of fuzzy sets and fuzzy rules to classify
object oriented java applications.
• The decomposition tree is a very useful analysis tool for developers who need to address
issues with classes with similar metric values.
• The results help the developers, designers and team leaders to enforce the use of object
oriented principles in the design and development of java applications.
• Unfortunately the fuzzy system does not prevent metrics to report false-positives
therefore manual analysis is needed in cases were abnormal results are suspected.
• Overall the current fuzzy sets and fuzzy rules provide accurate results however the
system does not report low values in NOC and DIT at the application level, therefore
modifications of these rules and fuzzy sets are expected if these values need to be
considered by the final user.
• The fuzzy rules did not entirely utilize medium and normal membership functions, but
these fuzzy sets are provided so the user can modify the current fuzzy rules if a more
accurate result is needed.
• The fuzzy system provides objective results because they contain information from
statistical sources and several human experts in contrast to manual analysis that is bias
and can vary depending on the knowledge and experience of the expert.
The following suggestions are provided for future work:
• Integration of the fuzzy system with the popular java compiler ant, to obtain instant
results at compilation time.
• Include a neural network prediction system to forecast the reliability of the applications
using statistical and historical information of the fuzzy reports.
• Integrate the fuzzy system with a continuous monitoring system (Hudson dashboard, etc)
so historic and current reports are available to developers, project leaders, architects,
managers and clients in order to increase productivity, reliability, usability, testability of
the application.
21. International Journal of Computer Science & Information Technology (IJCSIT) Vol 5, No 3, June 2013
21
REFERENCES
[1] S. R. Chidamber and C. F. Kemerer, “A Metrics Suite for Object Oriented Design,” IEEE Trans. Soft.
Eng., vol. 20, no. 6, pp. 476-493, Jun. 1994
[2] L. Rosenberg, “Applying and Interpreting Object Oriented Metrics,” in Soft. Tech. Conf. Utah, 1998.
[3] M. M. Thwin and T. S. Quah, “Application of neural networks for software quality prediction using
object-oriented metrics,” J. Syst. Soft., vol. 76, pp. 147-156, Jun. 2004.
[4] A. Ampatzoglou, and A. Chatzigeorgiou, “Evaluation of object-oriented design patterns in game
development,” Inform. Soft. Tech. vol. 49, pp. 445-454, Aug. 2006.
[5] T. S. Quah, “Estimating software readiness using predictive models,” J. Inf. Sci., vol. 179, pp. 430-
445, Oct. 2008.
[6] K. O. Elish and M. O. Elish, “Predicting defect-prone software modules using support vector
machines,” J. Syst. Soft., vol. 81, pp. 649-660, Oct. 2007.
[7] N. J. Pizzia and W. Pedrycz, “Effective classification using feature selection and fuzzy integration,”
Fuz. Sets and Syst., vol. 159, pp. 2859-2872, Mar. 2008.
[8] S. Sarkar, “Metrics for Measuring the Quality of Modularization of Large-Scale Object-Oriented
Software,” IEEE Trans. Soft. Eng., vol. 34, no. 5, pp. 700-720, Sep. 2008.
[9] Virtual Machinery. (2010). JHawk 5 Product Overview [Online].Available:
http://www.virtualmachinery.com/jhawkprod.htm
[10] F. Brito, “The Design of Eiffel Programs: Quantitative Evaluation using the MOOD Metrics,” INESC,
Lisboa, Portugal, Proc. Tools’96 USA Rep., Jul. 1996.
[11] J Yen and R. Langary, “Basic Concepts of Fuzzy Logic,” in Fuzzy Logic: intelligence, control, and
information, Upper Saddle River, NJ: Prentice-Hall, 1998, pp. 21-53.
[12] G. Voss. (1996, Nov.). Java Beans: Introducing Java Beans [Online]. Available:
http://java.sun.com/developer/onlineTraining/Beans/Beans1/index.html
[13] L.C. Briand, “A Comprehensive Empirical Validation of Design Measures for Object-Oriented
Systems,” Proc. 5th Int. Symp. Soft. Metr. 1998, pp. 20-21.
[14] M. Sarker, “An overview of Object Oriented Design Metrics,” M.S. thesis, Dept. Comp. Scn., Umeå
Univ., Umeå, Sweden, 2005.
[15] E Gamma, “Design Pattern Catalog,” in Design Patterns – elements of Reusable Object-Oriented
Software. Indianapolis, IN: Addison-Wesley, 1994, pp. 151-315.
Authors
Dr. Adnan Shaout is a full professor in the Electrical and Computer Engineering
Department at the University of Michigan – Dearborn. At present, he teaches courses
in fuzzy logic and engineering applications and computer engineering (hardware and
software). His current research is in applications of software engineering methods,
computer architecture, embedded systems, fuzzy systems, real time systems and
artificial intelligence. Dr. Shaout has more than 29 years of experience in teaching
and conducting research in the electrical and computer engineering fields at Syracuse
University and the University of Michigan - Dearborn. Dr. Shaout has published over
140 papers in topics related to electrical and computer engineering fields. Dr. Shaout
has obtained his B.S.c, M.S. and Ph.D. in Computer Engineering from Syracuse University, Syracuse, NY,
in 1982, 1983, 1987, respectively.
Juan C. Garcia is a graduate student in the Electrical and Computer Engineering Department at the
University of Michigan – Dearbron