Download as PDF, PPTX
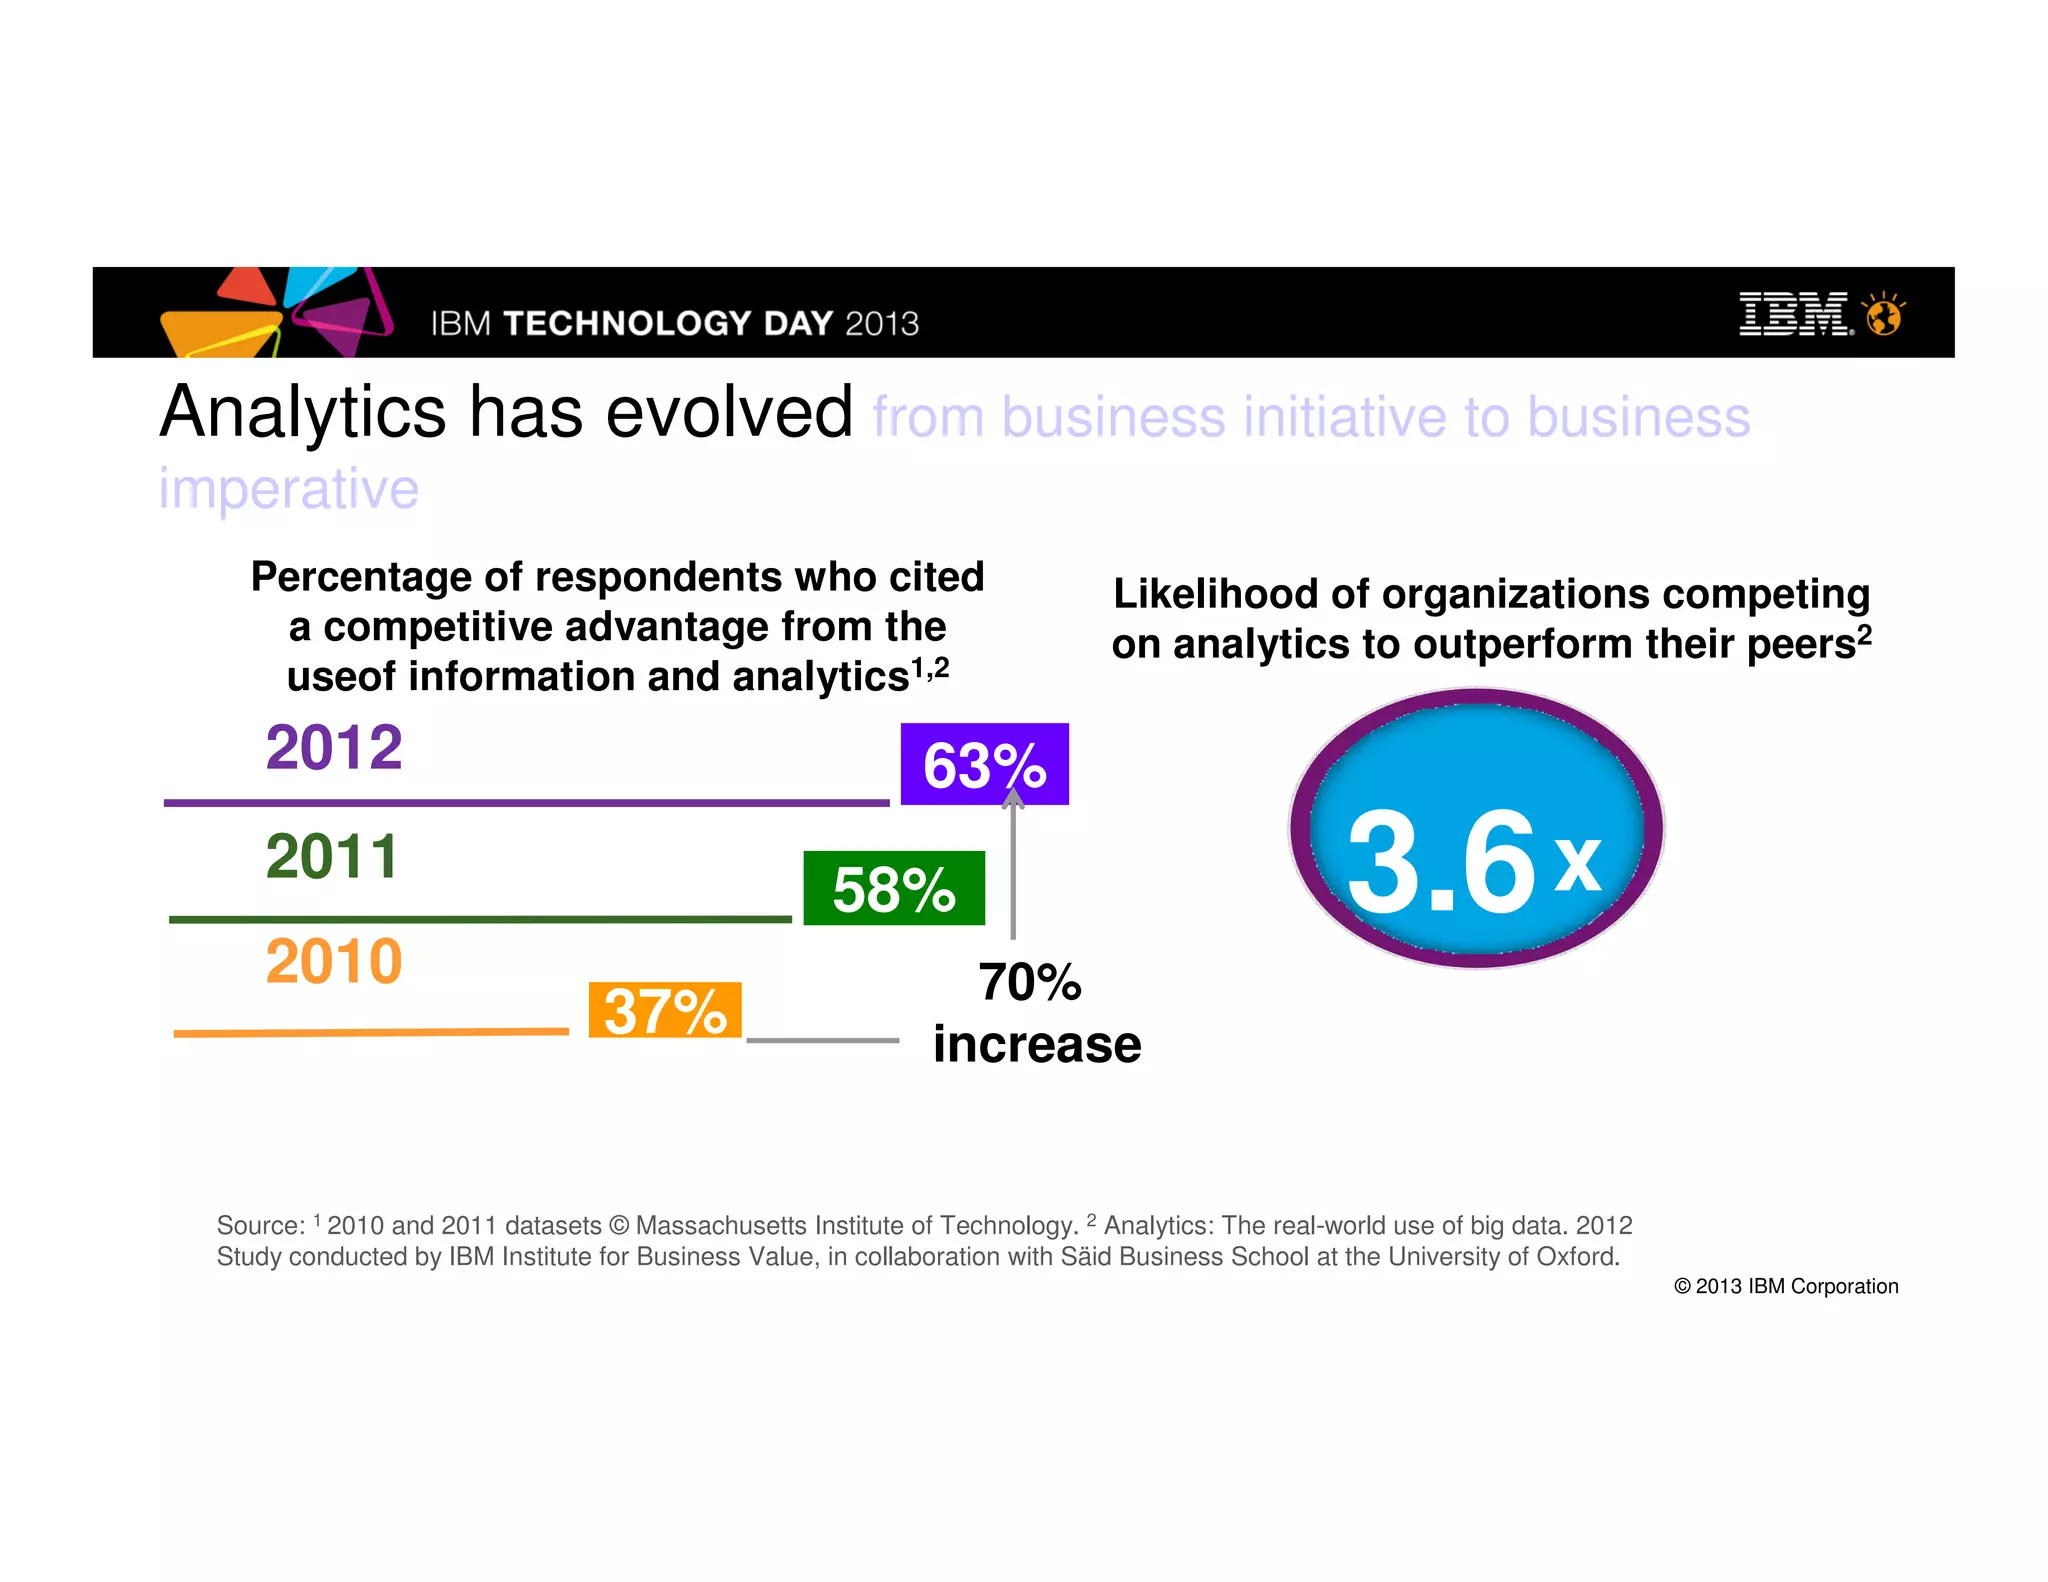
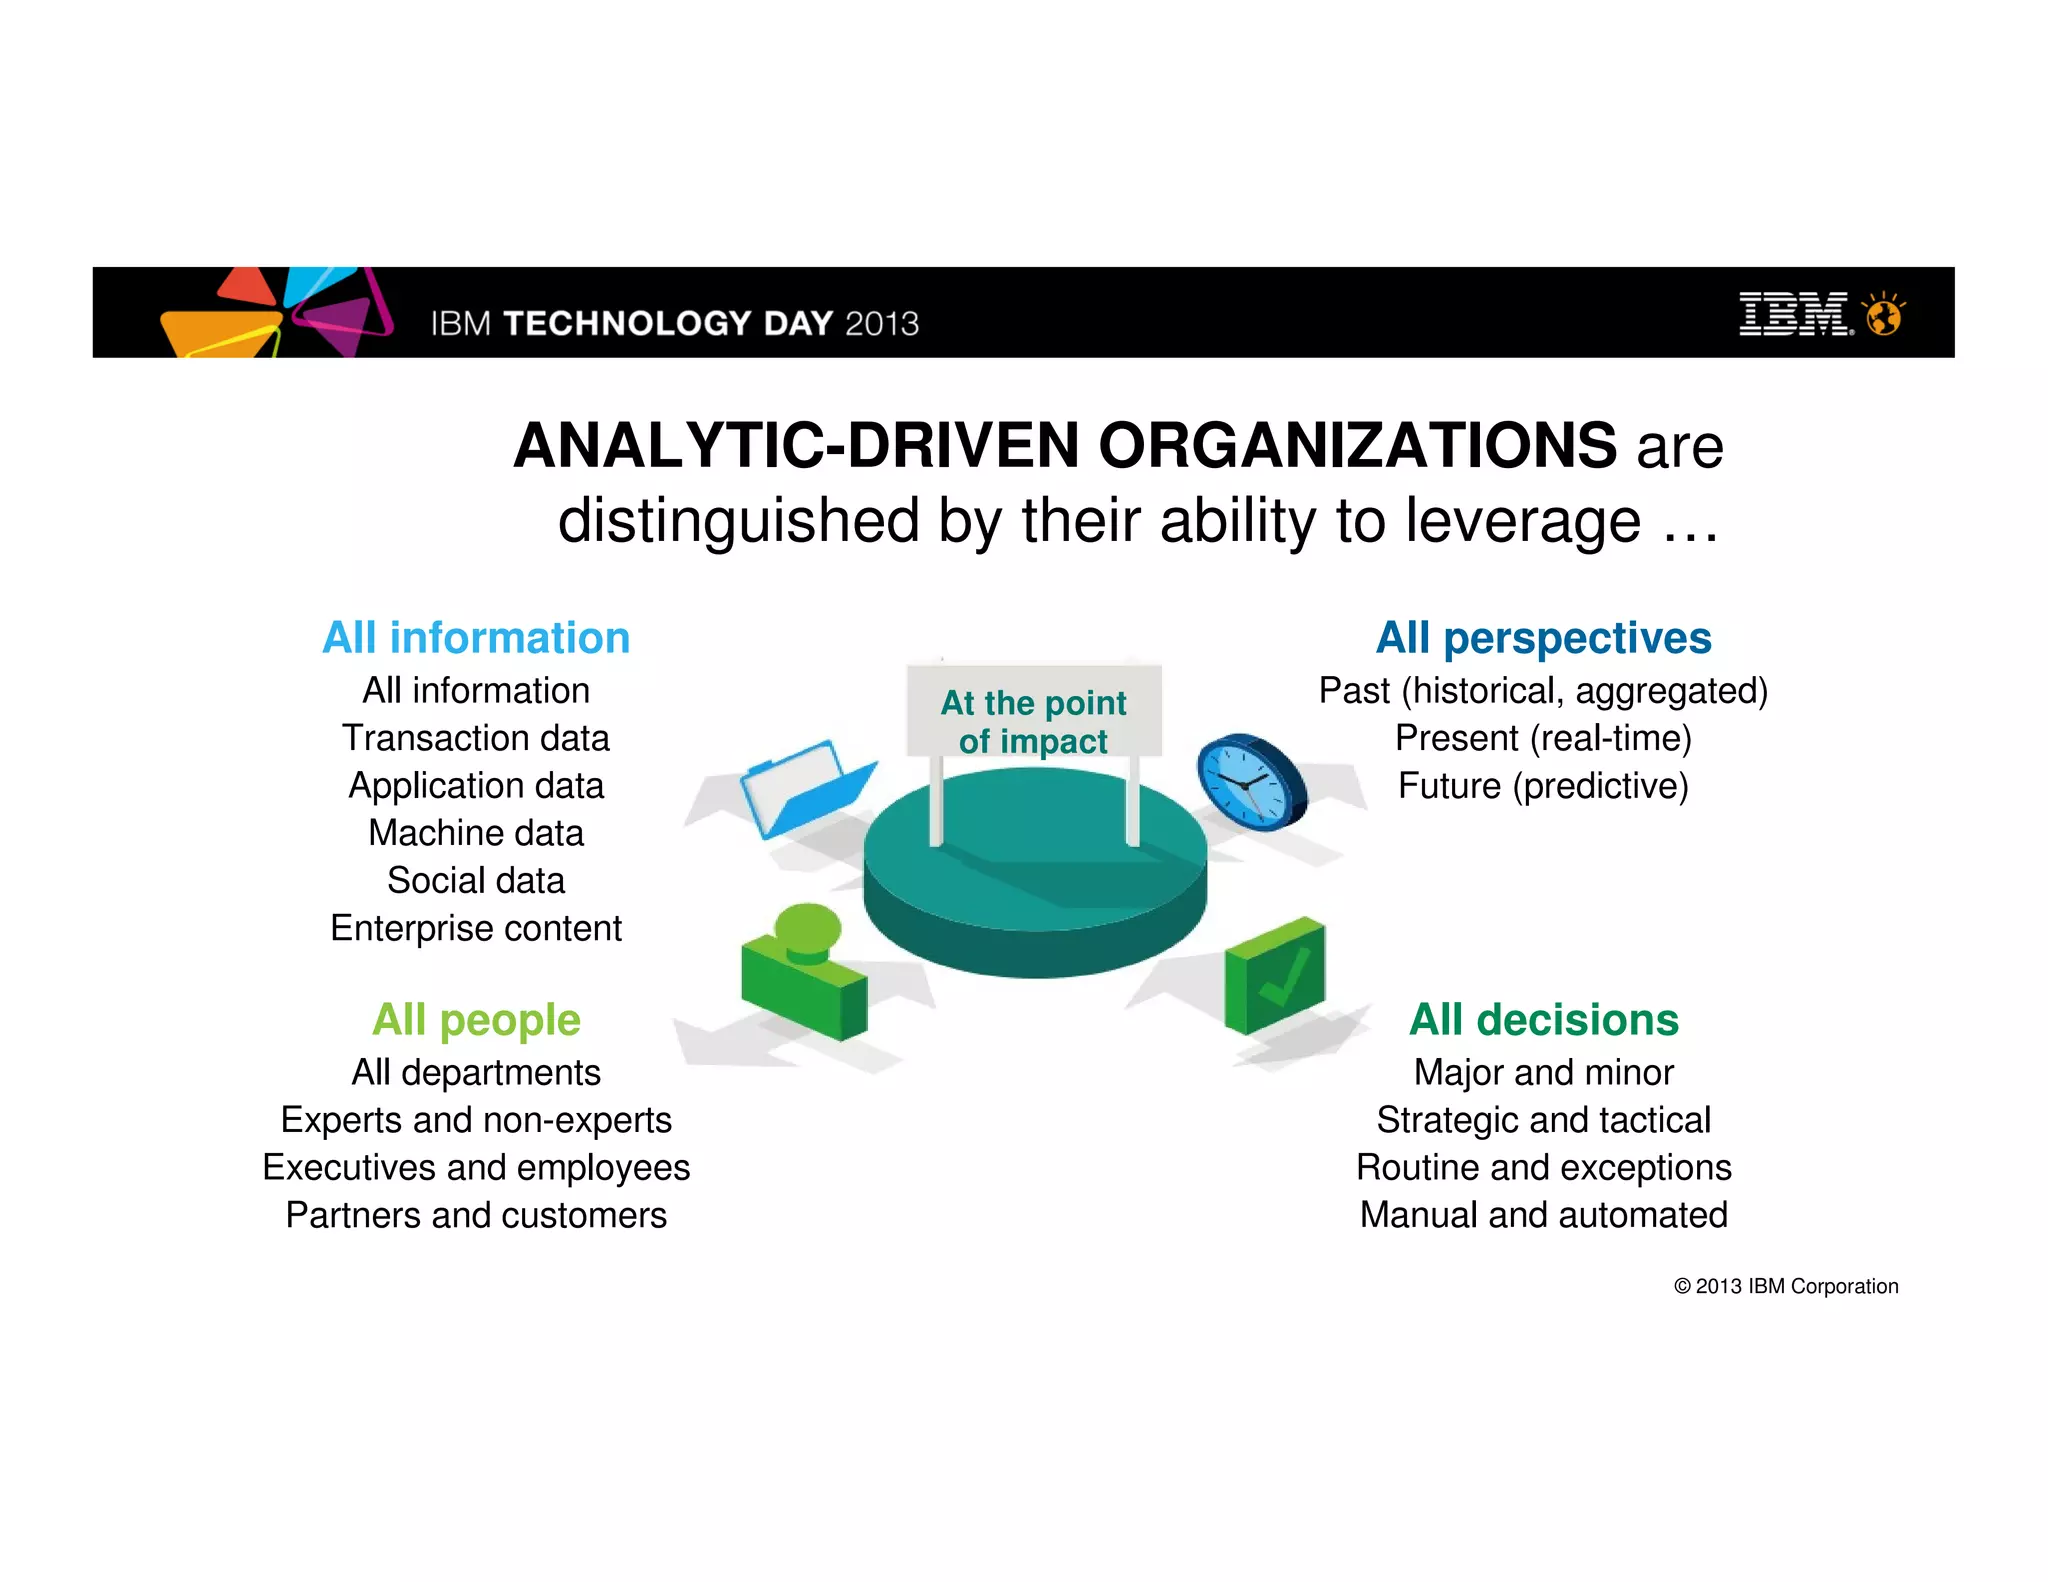
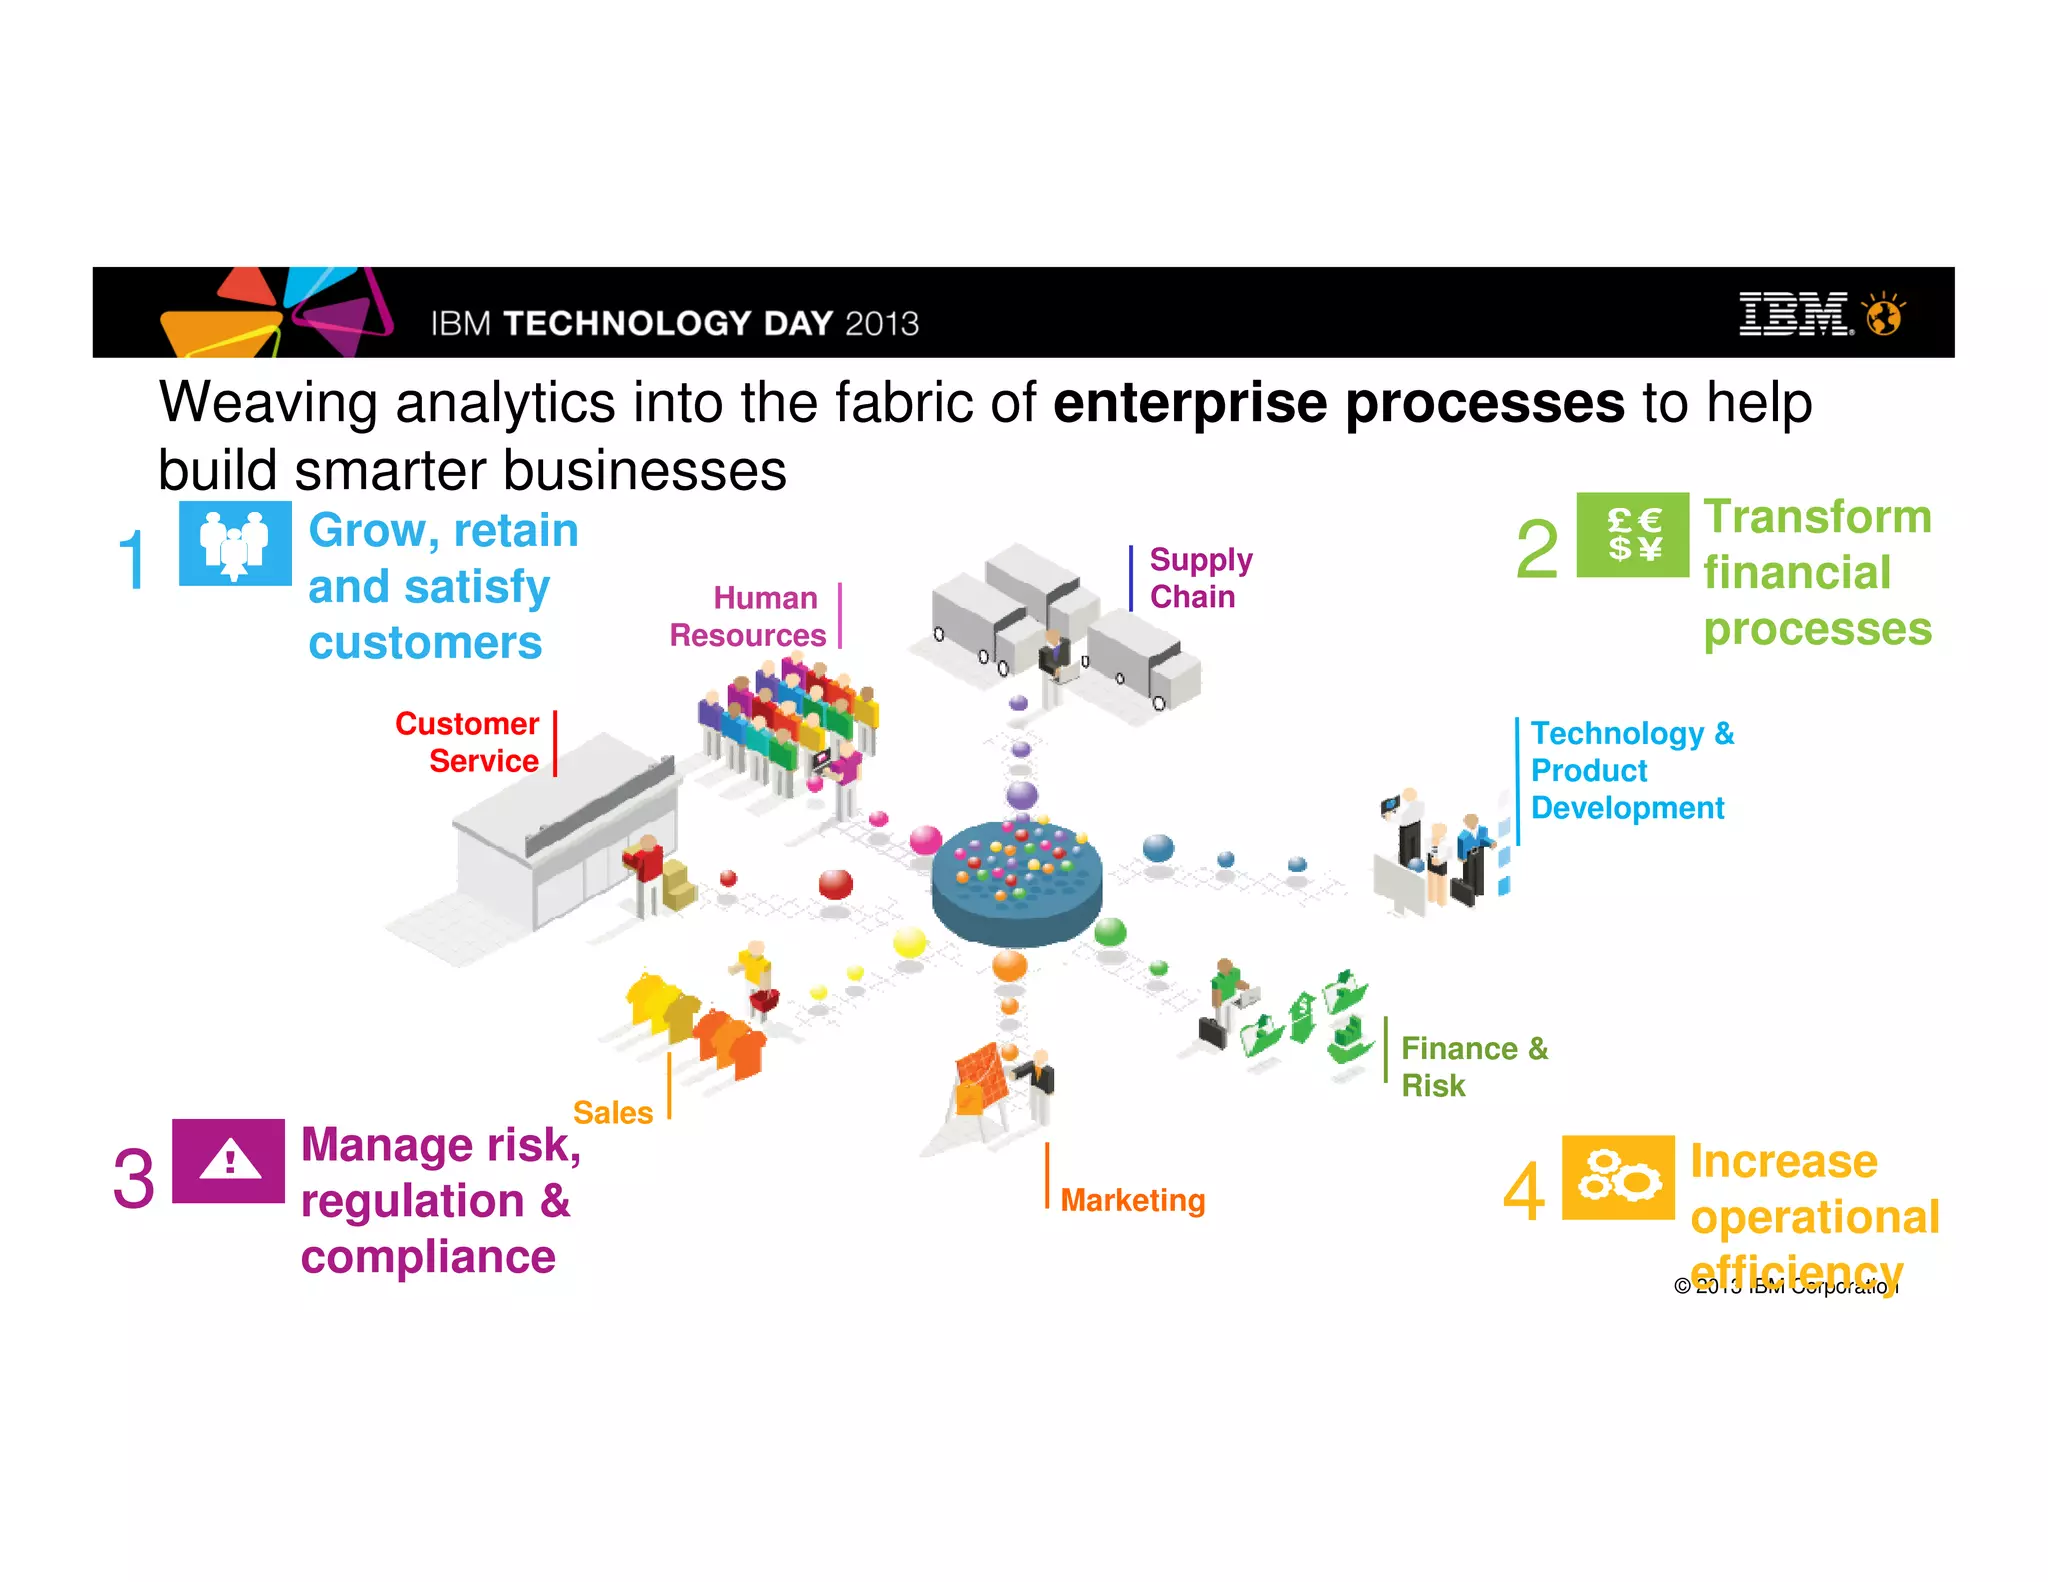
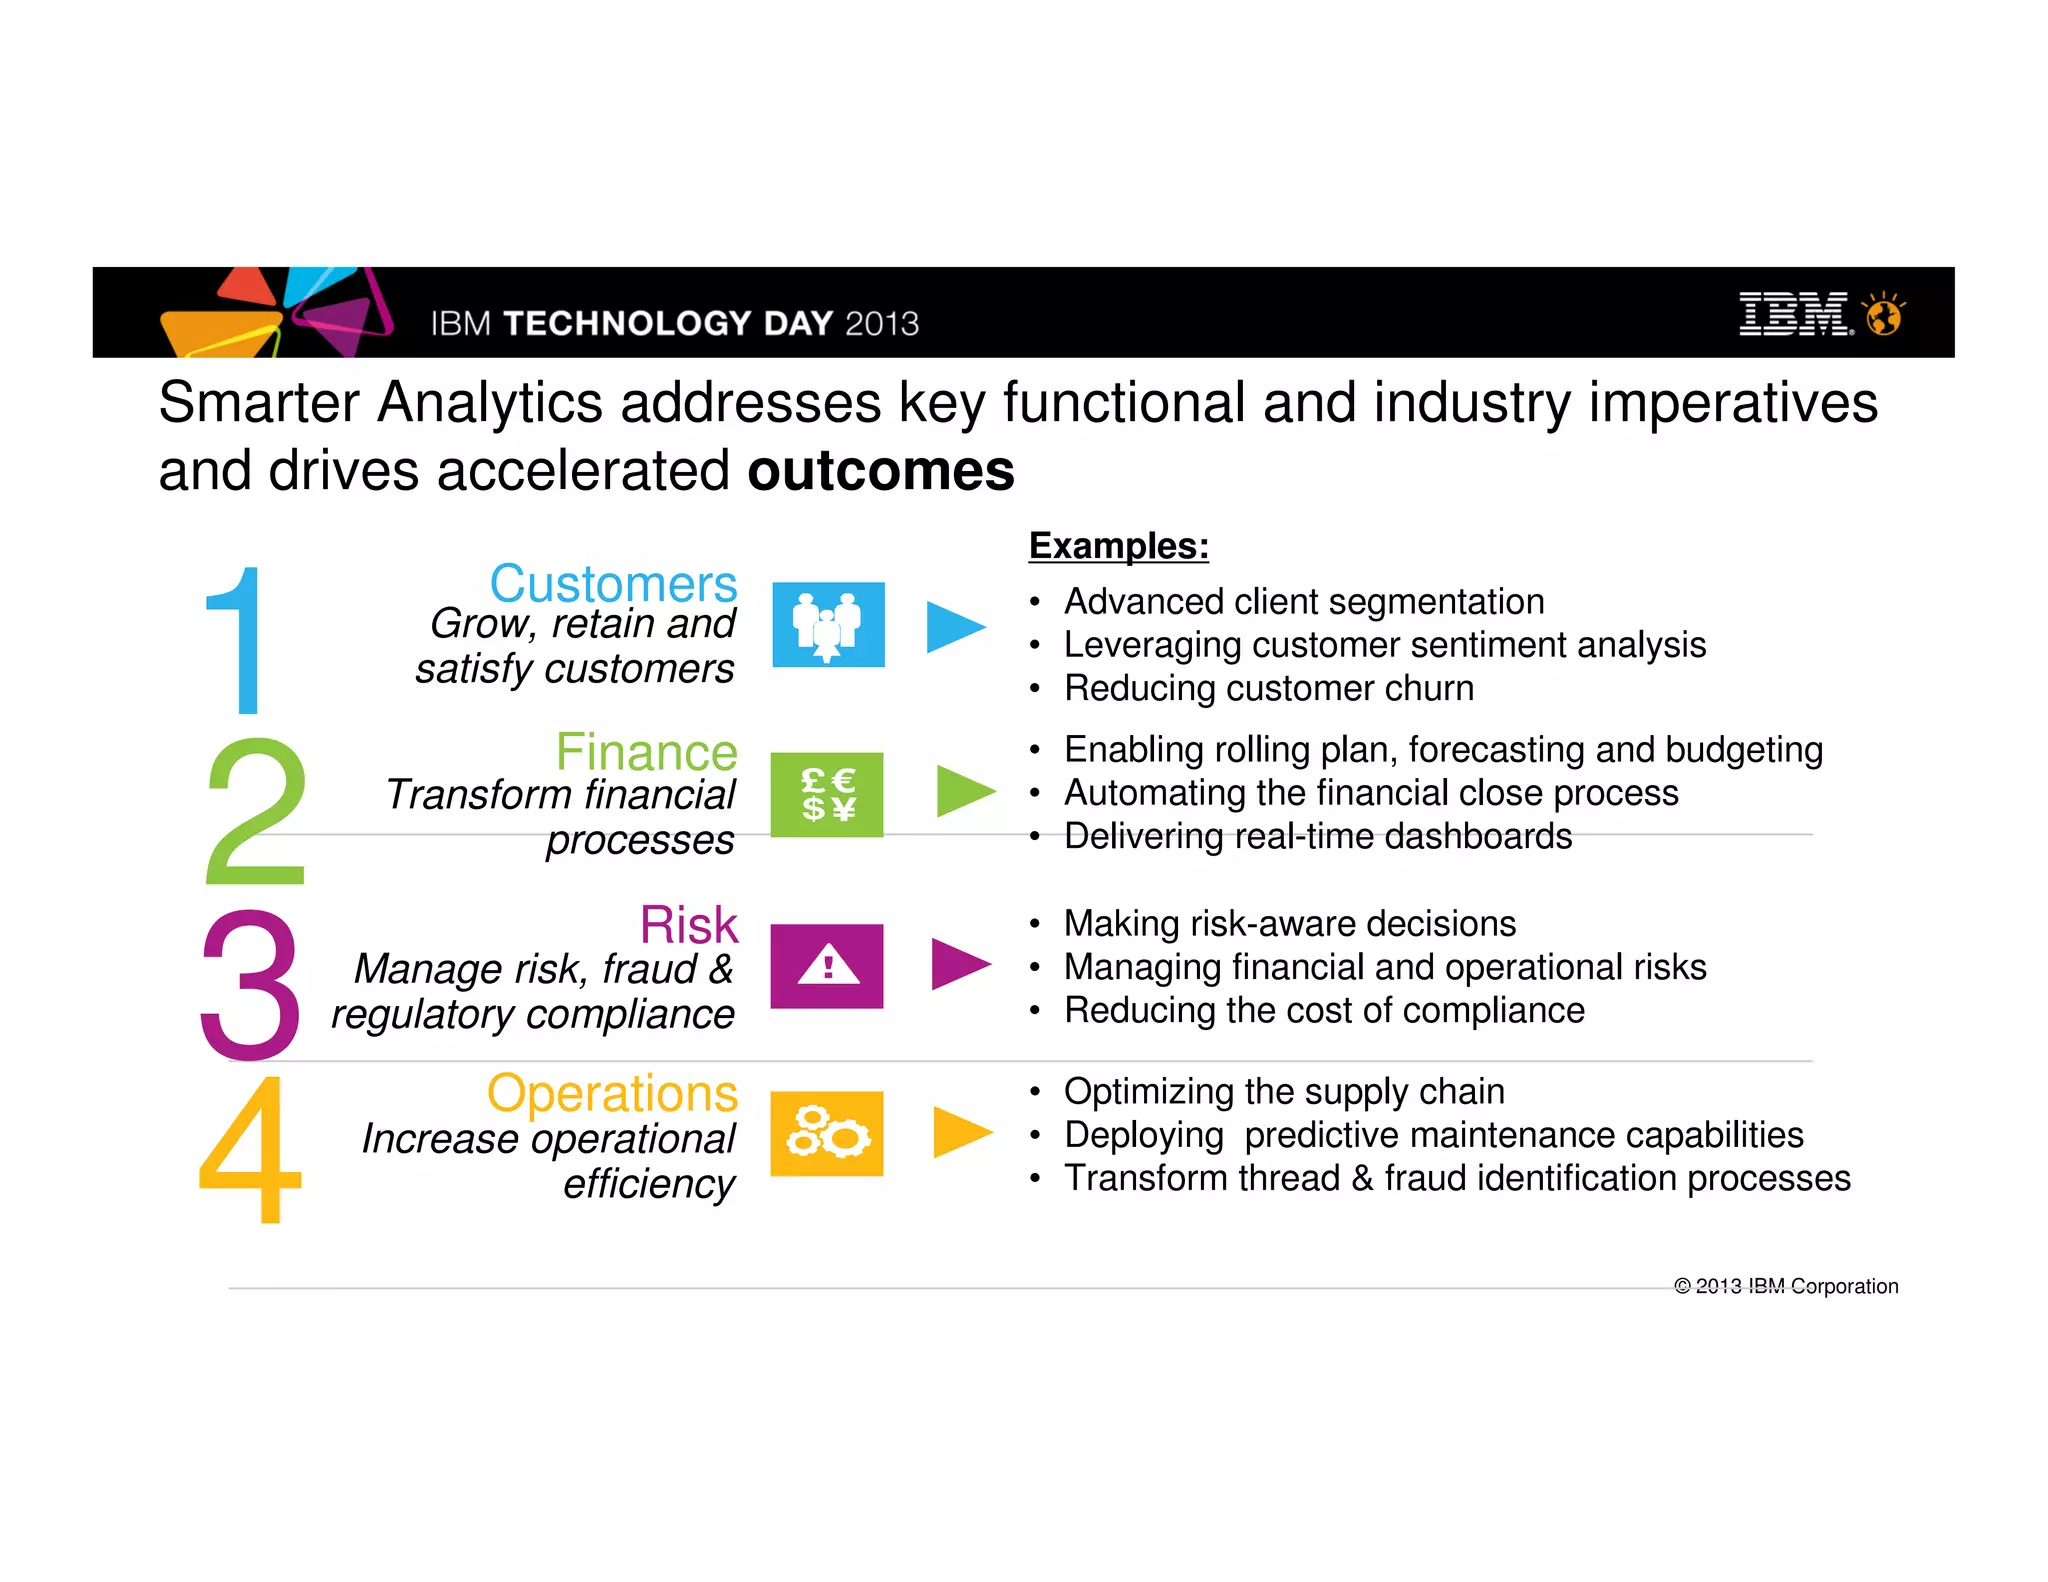
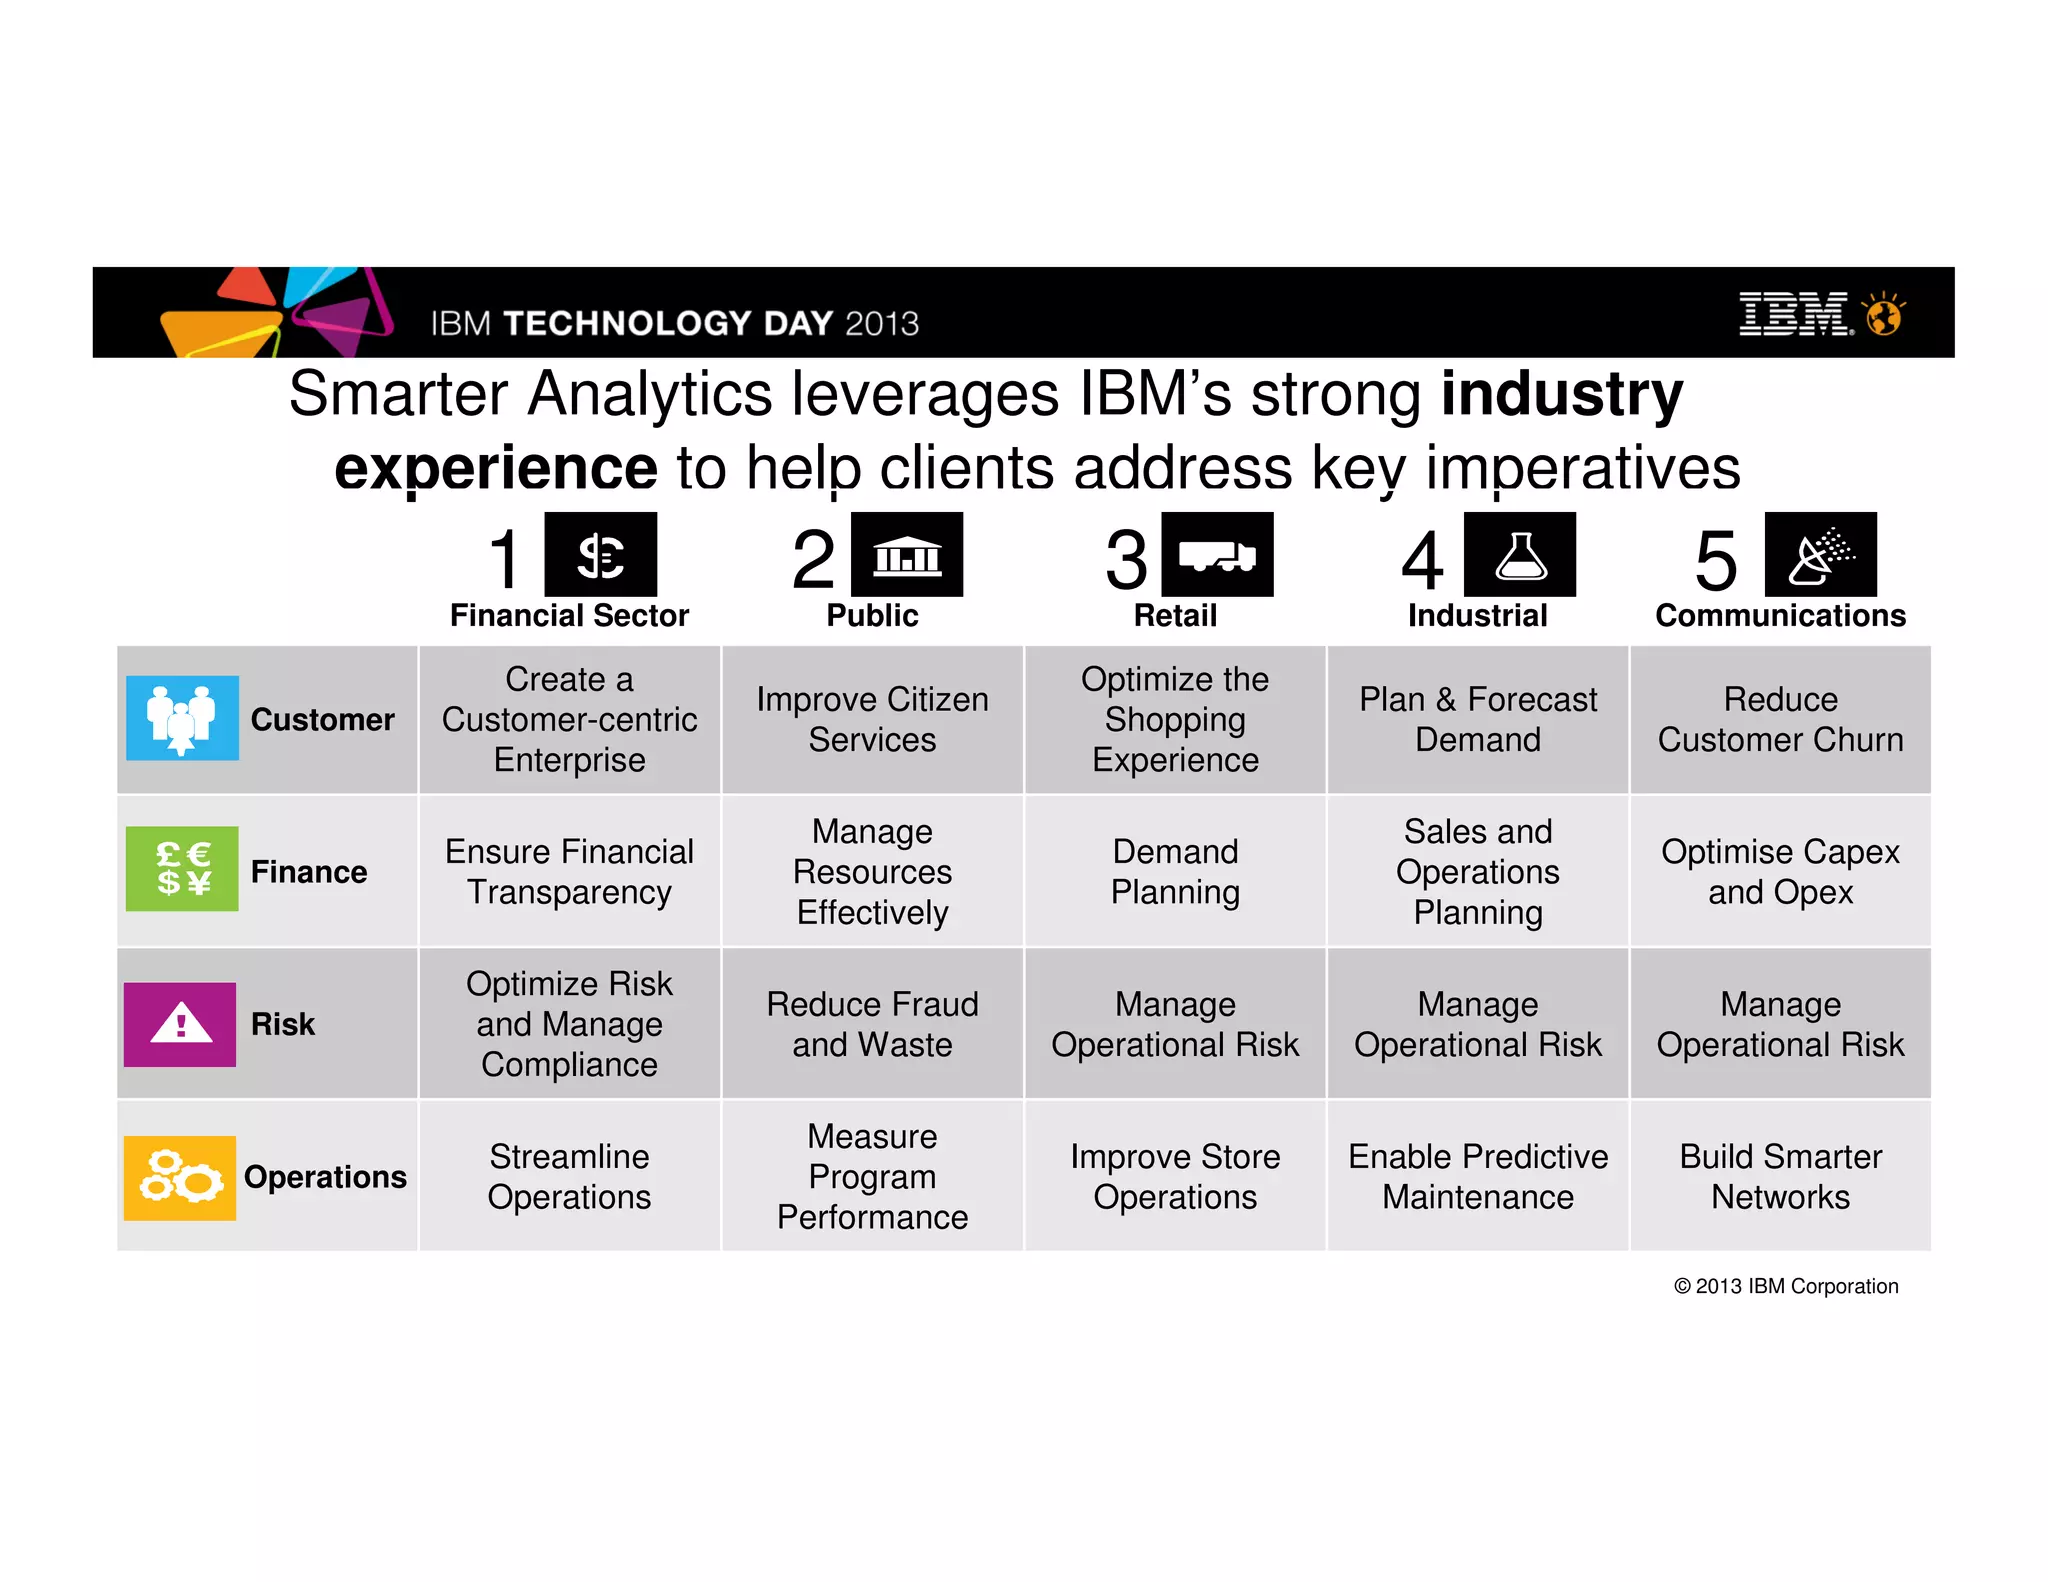
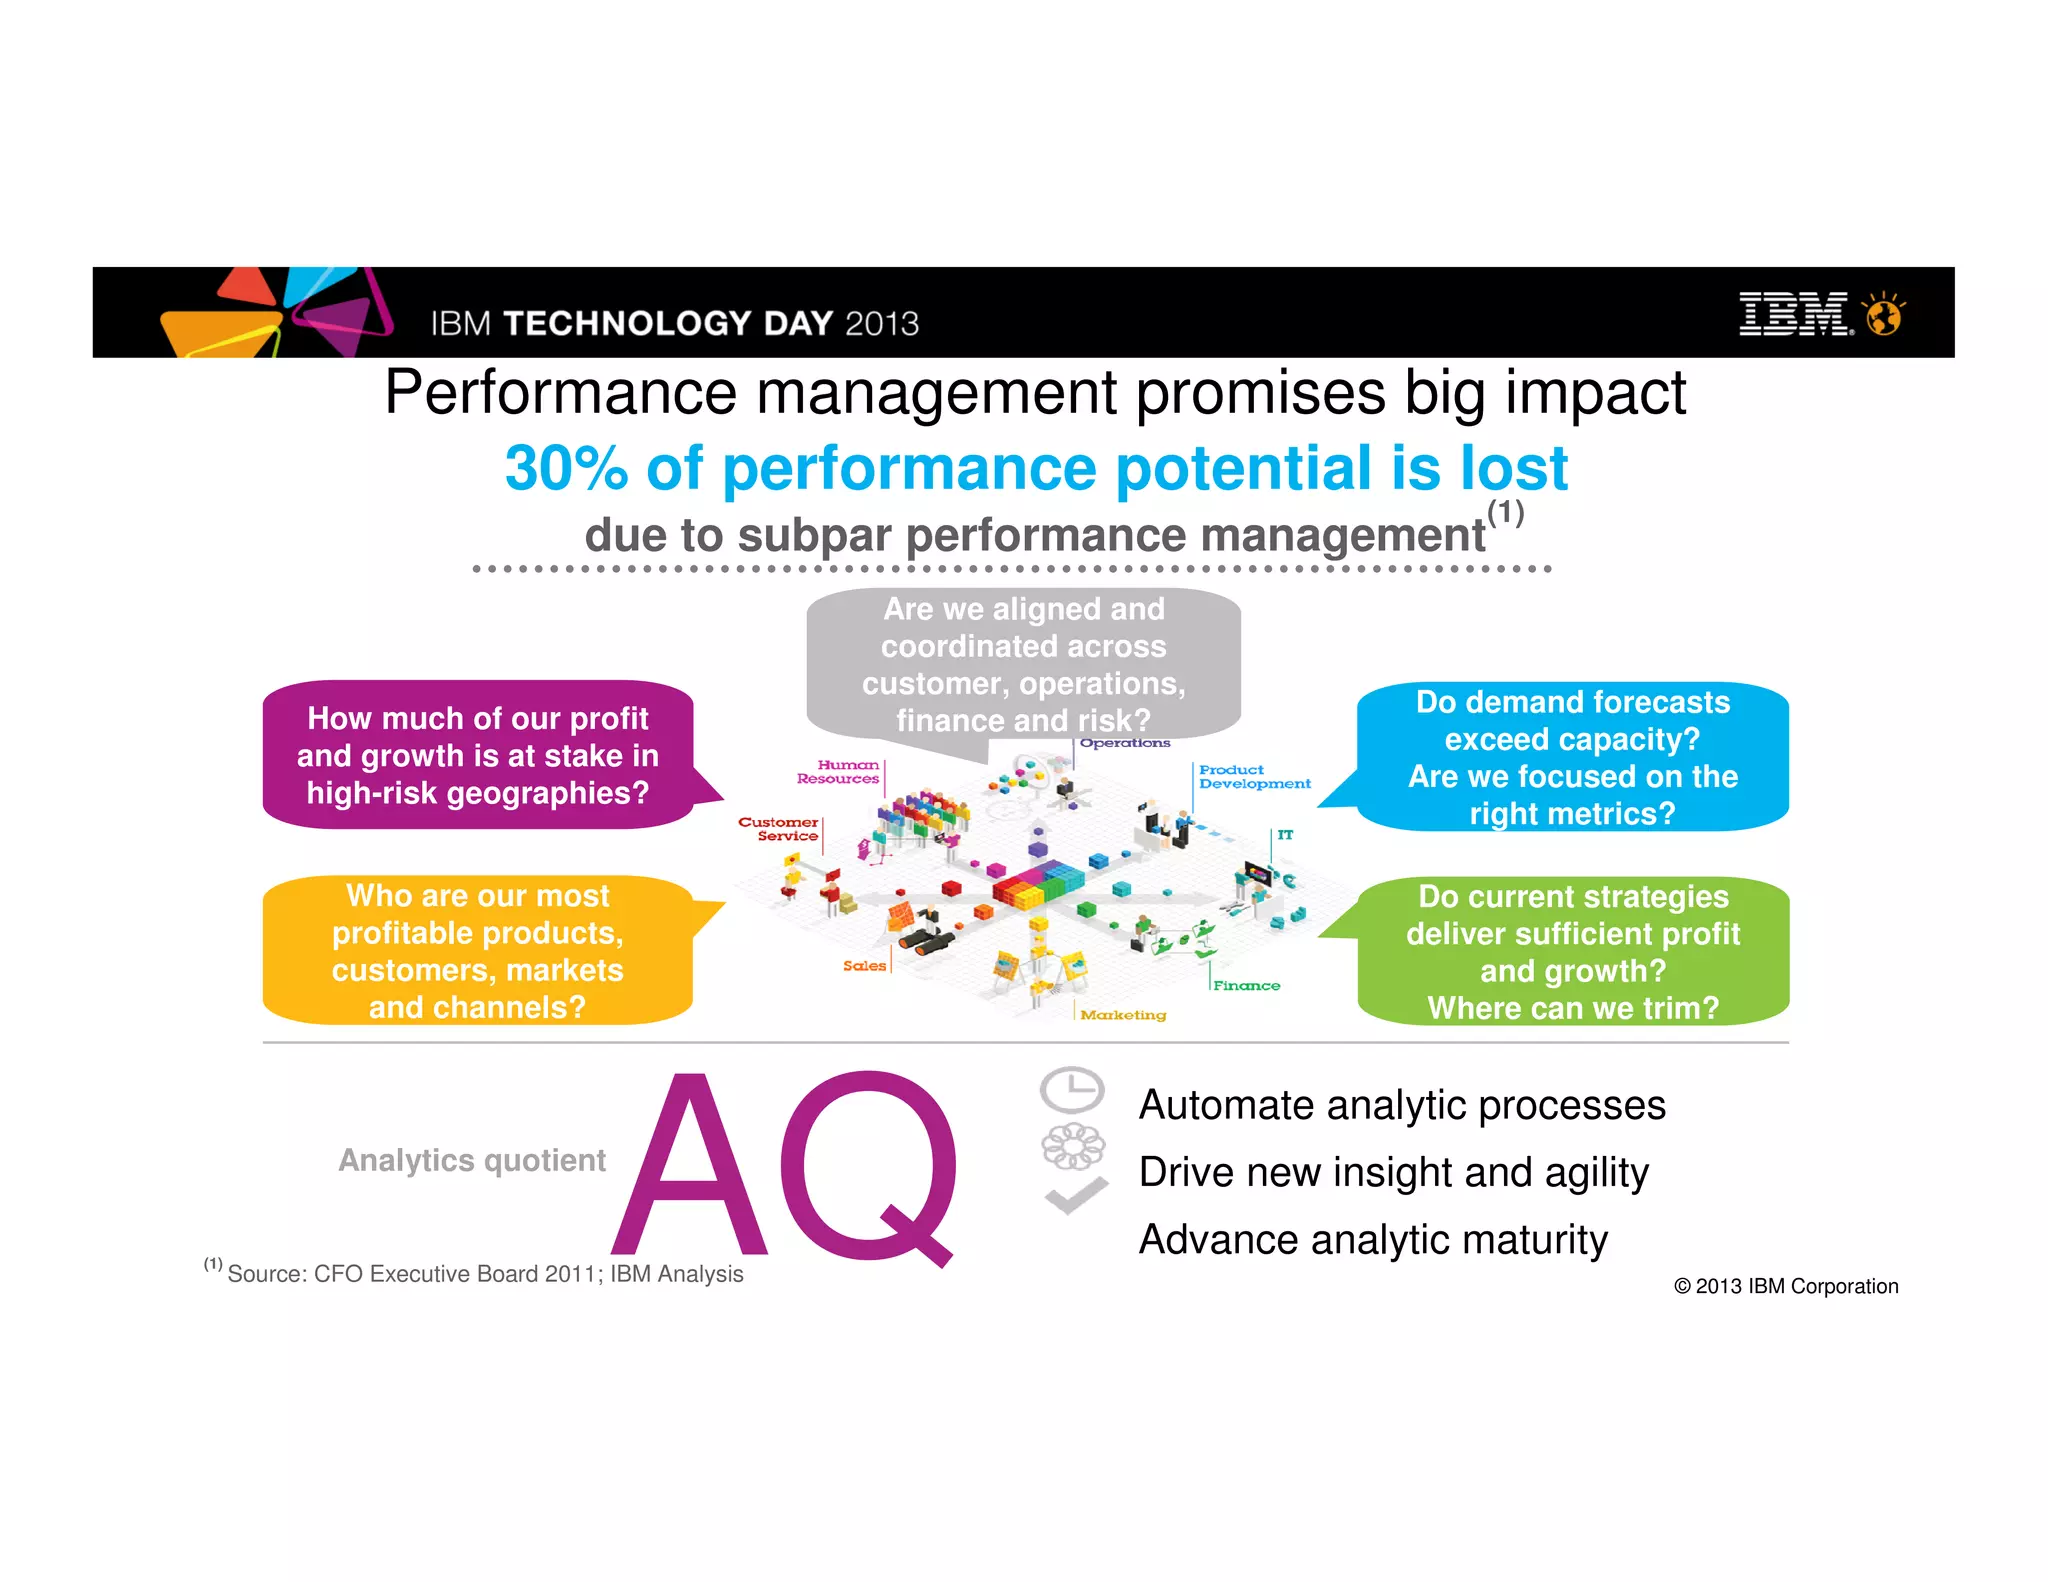
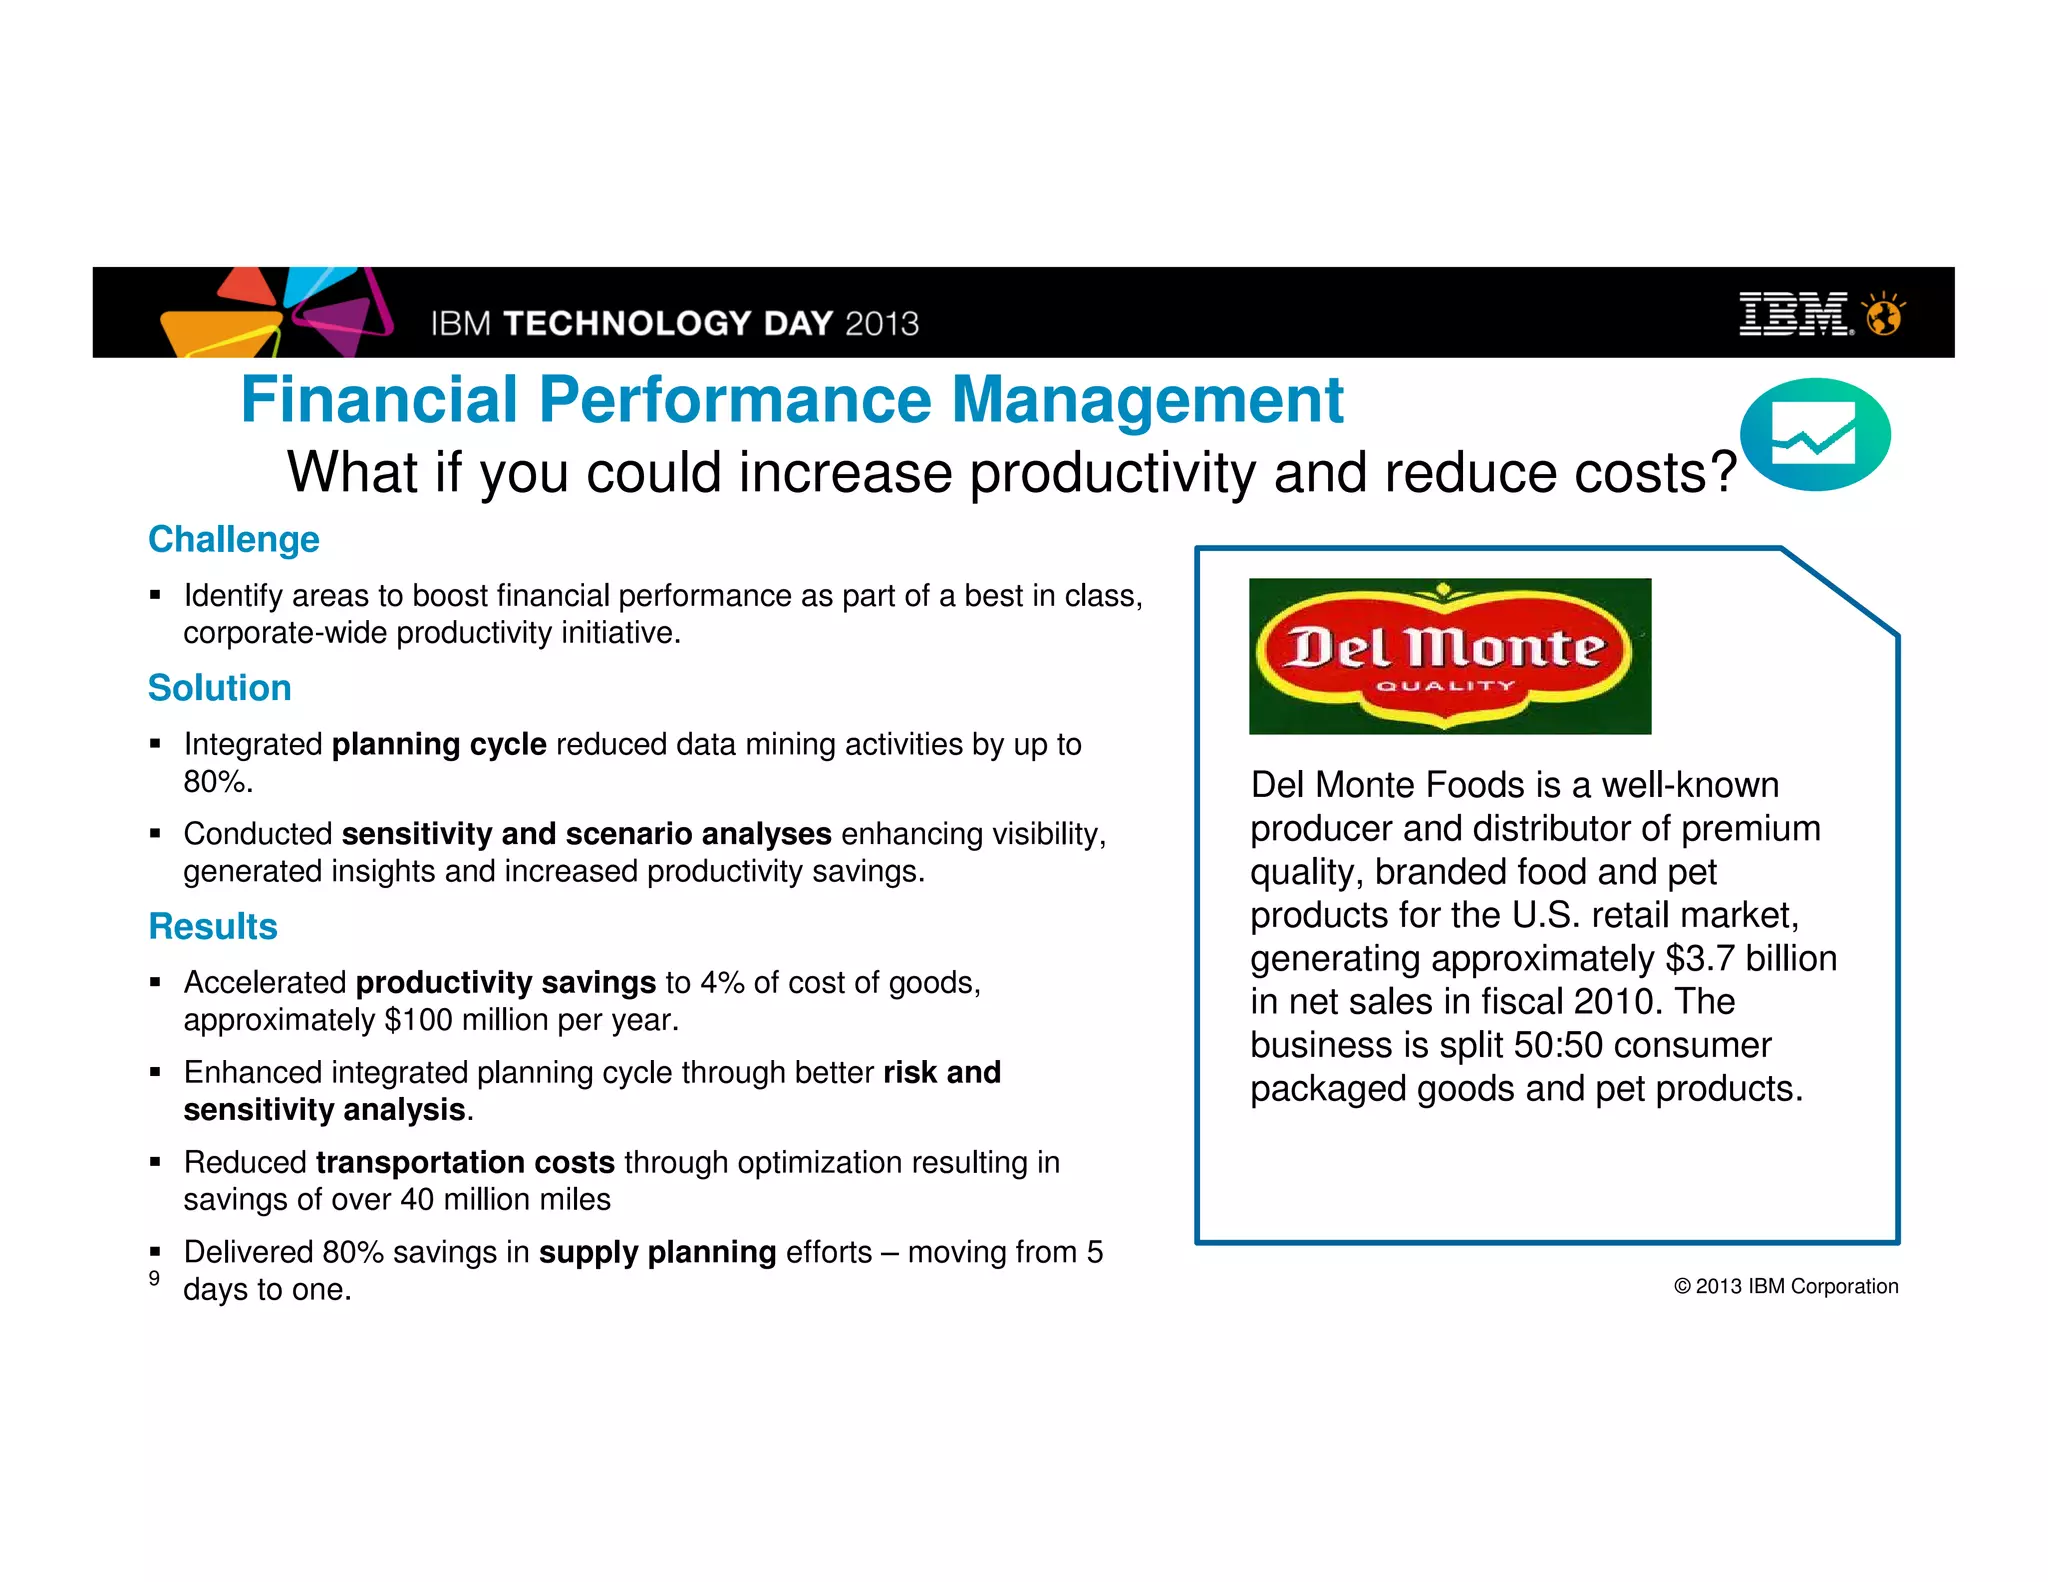
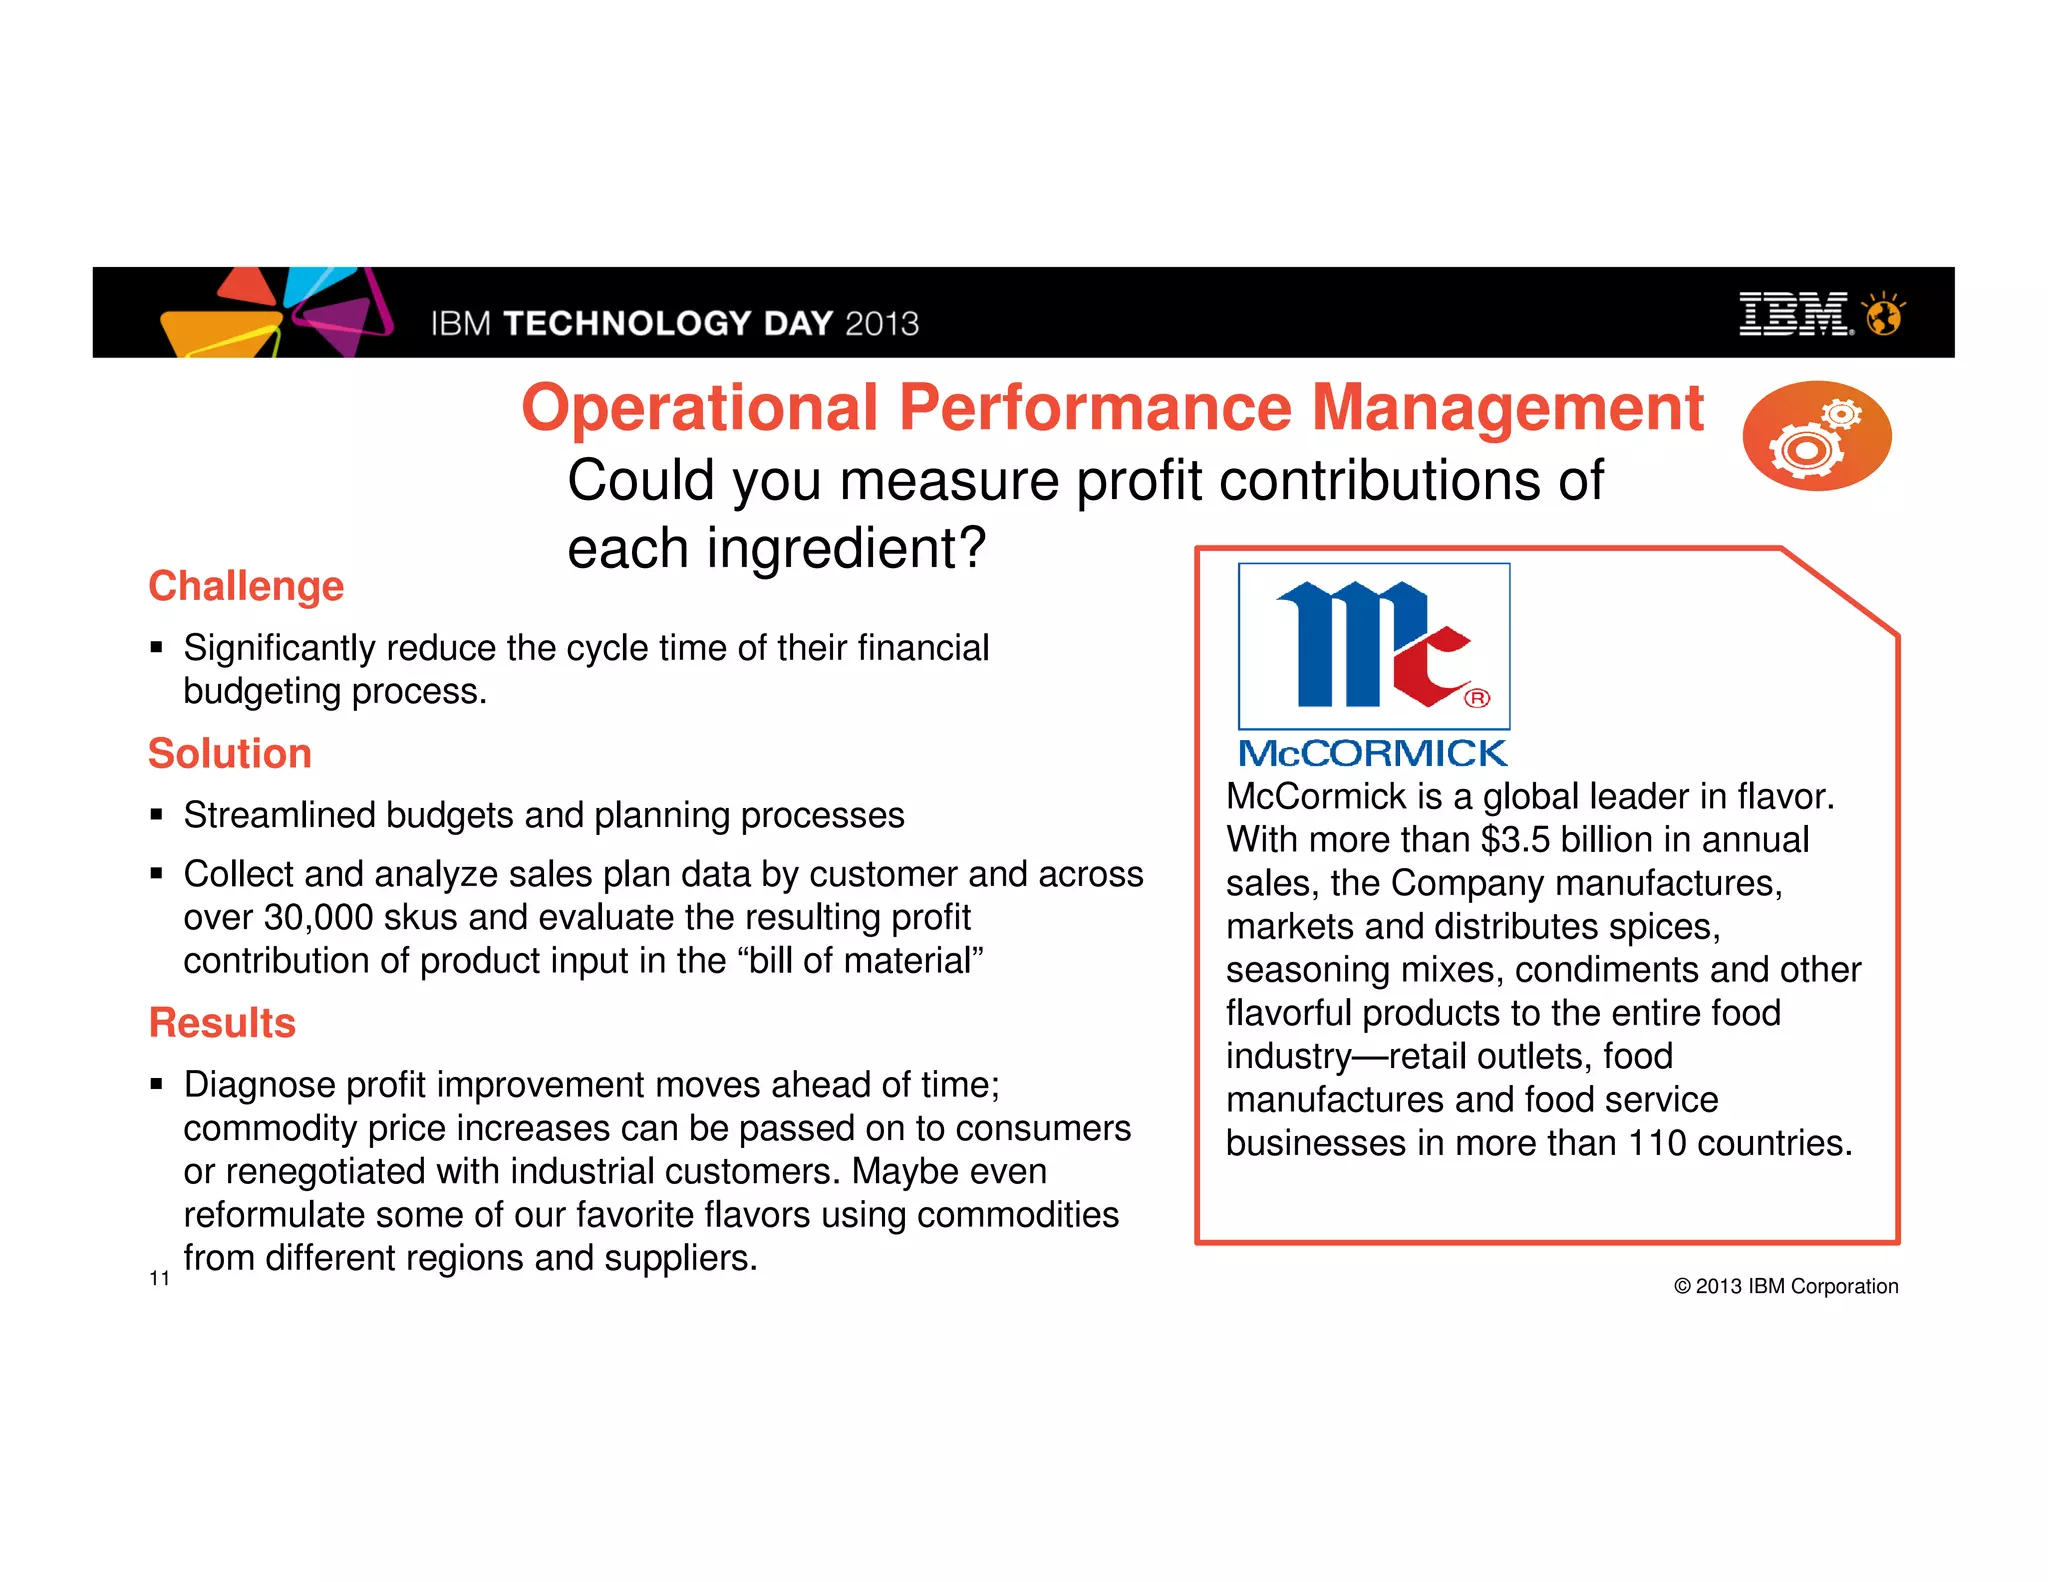
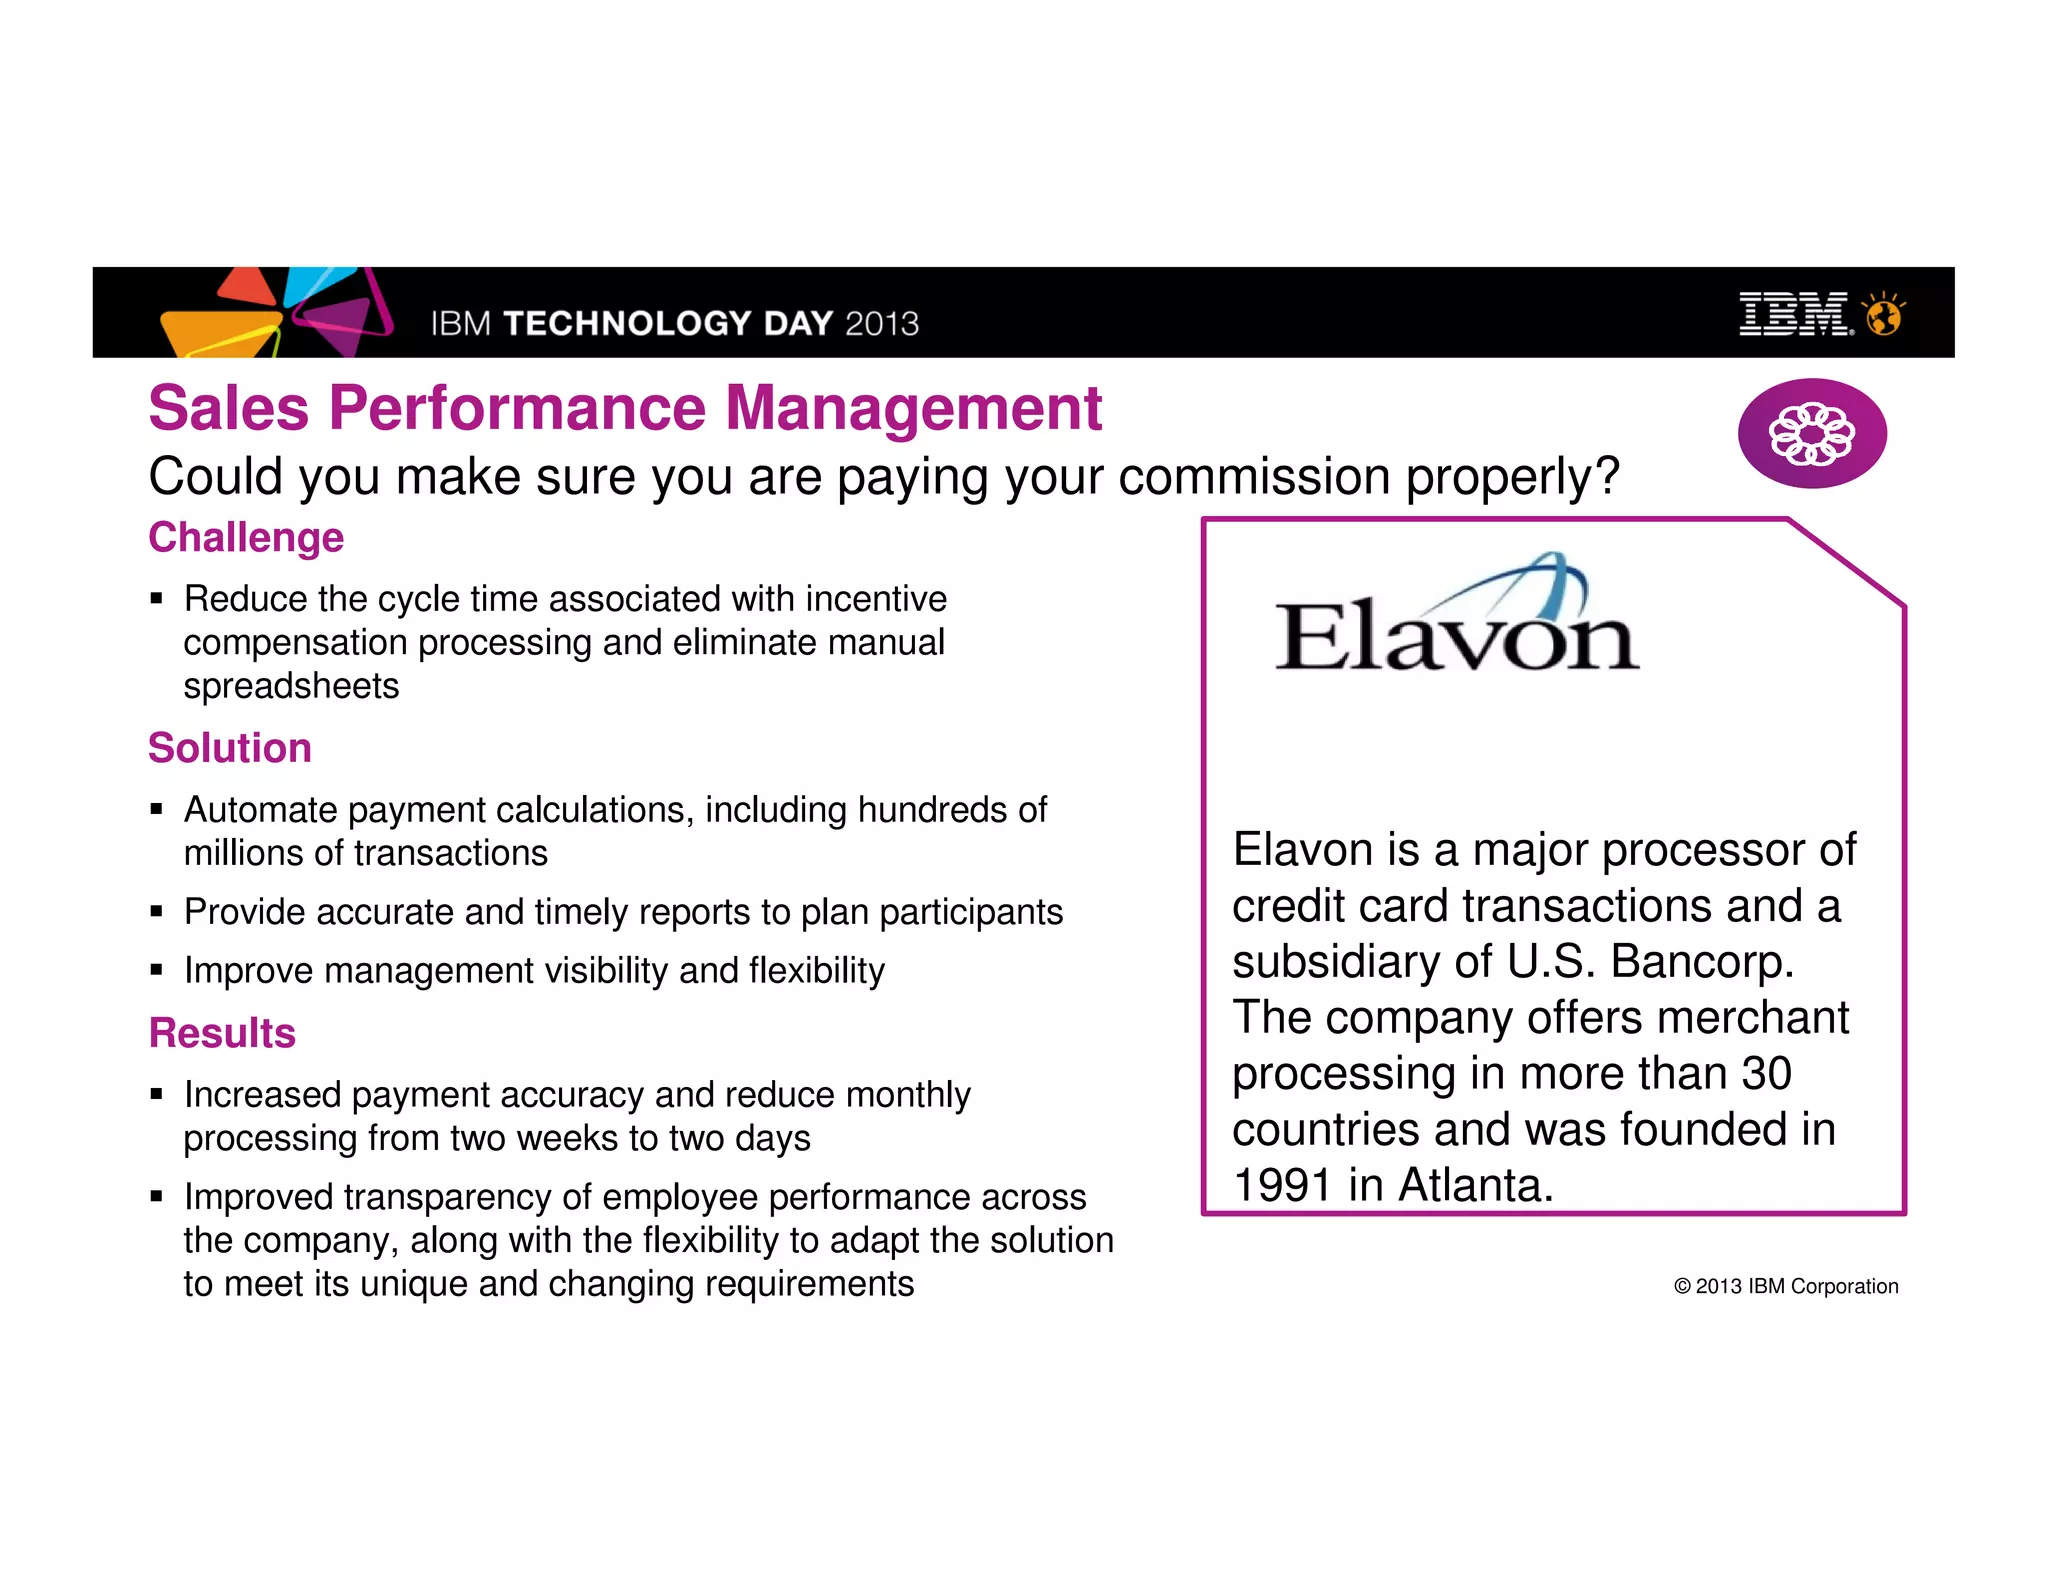


This document discusses IBM's business analytics software for performance management. It provides an overview of how analytics has become essential for businesses to gain competitive advantages. It then discusses how analytic-driven organizations are able to leverage all types of data and perspectives to make informed decisions. The rest of the document discusses IBM's software solutions for key areas like customers, operations, finance, and risk management. It also includes case studies showing how companies have benefited from IBM's performance management solutions.