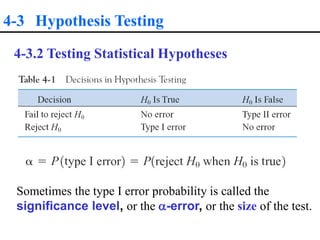
4-1 Statistical Inference
• The field of statistical inference consists of those
methods used to make decisions or draw
conclusions about a population.
•These methods utilize the information contained in
a sample from the population in drawing
conclusions.
4-1 Statistical Inference
4-2 Point Estimation
4-3 Hypothesis Testing
We like to think of statistical hypothesis testing as the
data analysis stage of a comparative experiment,
in which the engineer is interested, for example, in
comparing the mean of a population to a specified
value (e.g. mean pull strength).
4-3.1 Statistical Hypotheses
4-3 Hypothesis Testing
For example, suppose that we are interested in the
burning rate of a solid propellant used to power aircrew
escape systems.
• Now burning rate is a random variable that can be
described by a probability distribution.
• Suppose that our interest focuses on the mean burning
rate (a parameter of this distribution).
• Specifically, we are interested in deciding whether or
not the mean burning rate is 50 centimeters per second.
4-3.1 Statistical Hypotheses
4-3 Hypothesis Testing
4-3.1 Statistical Hypotheses
Two-sided Alternative Hypothesis
One-sided Alternative Hypotheses
4-3 Hypothesis Testing
4-3.1 Statistical Hypotheses
Test of a Hypothesis
• A procedure leading to a decision about a particular
hypothesis
• Hypothesis-testing procedures rely on using the information
in a random sample from the population of interest.
• If this information is consistent with the hypothesis, then we
will conclude that the hypothesis is true; if this information is
inconsistent with the hypothesis, we will conclude that the
hypothesis is false.
4-3 Hypothesis Testing
4-3.2 Testing Statistical Hypotheses
4-3 Hypothesis Testing
4-3.2 Testing Statistical Hypotheses
4-3 Hypothesis Testing
4-3.2 Testing Statistical Hypotheses
Sometimes the type I error probability is called the
significance level, or the -error, or the size of the test.
4-3 Hypothesis Testing
4-3.2 Testing Statistical Hypotheses
4-3 Hypothesis Testing
4-3.2 Testing Statistical Hypotheses
4-3 Hypothesis Testing
4-3.2 Testing Statistical Hypotheses
4-3 Hypothesis Testing
4-3.2 Testing Statistical Hypotheses
4-3 Hypothesis Testing
4-3.2 Testing Statistical Hypotheses
4-3 Hypothesis Testing
4-3.2 Testing Statistical Hypotheses
• The power is computed as 1 - b, and power can be interpreted as
the probability of correctly rejecting a false null hypothesis. We
often compare statistical tests by comparing their power properties.
• For example, consider the propellant burning rate problem when
we are testing H 0 : m = 50 centimeters per second against H 1 : m not
equal 50 centimeters per second . Suppose that the true value of the
mean is m = 52. When n = 10, we found that b = 0.2643, so the
power of this test is 1 - b = 1 - 0.2643 = 0.7357 when m = 52.
4-3 Hypothesis Testing
4-3.3 One-Sided and Two-Sided Hypotheses
Two-Sided Test:
One-Sided Tests:
4-3 Hypothesis Testing
4-3.3 P-Values in Hypothesis Testing
4-3 Hypothesis Testing
4-3.5 General Procedure for Hypothesis Testing
4-4 Inference on the Mean of a Population,
Variance Known
Assumptions
4-4 Inference on the Mean of a Population,
Variance Known
4-4.1 Hypothesis Testing on the Mean
We wish to test:
The test statistic is:
4-4 Inference on the Mean of a Population,
Variance Known
4-4.1 Hypothesis Testing on the Mean
Reject H0 if the observed value of the test statistic z0 is
either:
or
Fail to reject H0 if
4-4 Inference on the Mean of a Population,
Variance Known
4-4.1 Hypothesis Testing on the Mean
4-4 Inference on the Mean of a Population,
Variance Known
4-4.1 Hypothesis Testing on the Mean
4-4 Inference on the Mean of a Population,
Variance Known
4-4.2 Type II Error and Choice of Sample Size
Finding The Probability of Type II Error b
4-4 Inference on the Mean of a Population,
Variance Known
4-4.2 Type II Error and Choice of Sample Size
Sample Size Formulas
4-4 Inference on the Mean of a Population,
Variance Known
4-4.2 Type II Error and Choice of Sample Size
Sample Size Formulas
4-4 Inference on the Mean of a Population,
Variance Known
4-4.2 Type II Error and Choice of Sample Size
4-4 Inference on the Mean of a Population,
Variance Known
4-4.2 Type II Error and Choice of Sample Size
4-4 Inference on the Mean of a Population,
Variance Known
4-4.3 Large Sample Test
In general, if n  30, the sample variance s2
will be close to σ2 for most samples, and so s
can be substituted for σ in the test procedures
with little harmful effect.
4-4 Inference on the Mean of a Population,
Variance Known
4-4.4 Some Practical Comments on Hypothesis
Testing
The Seven-Step Procedure
Only three steps are really required:
4-4 Inference on the Mean of a Population,
Variance Known
4-4.4 Some Practical Comments on Hypothesis
Testing
Statistical versus Practical Significance
4-4 Inference on the Mean of a Population,
Variance Known
4-4.4 Some Practical Comments on Hypothesis
Testing
Statistical versus Practical Significance
4-4 Inference on the Mean of a Population,
Variance Known
4-4.5 Confidence Interval on the Mean
Two-sided confidence interval:
One-sided confidence intervals:
Confidence coefficient:
4-4 Inference on the Mean of a Population,
Variance Known
4-4.5 Confidence Interval on the Mean
4-4 Inference on the Mean of a Population,
Variance Known
4-4.6 Confidence Interval on the Mean
4-4 Inference on the Mean of a Population,
Variance Known
4-4.5 Confidence Interval on the Mean
4-4 Inference on the Mean of a Population,
Variance Known
4-4.5 Confidence Interval on the Mean
Relationship between Tests of Hypotheses and
Confidence Intervals
If [l,u] is a 100(1 - ) percent confidence interval for the
parameter, then the test of significance level  of the
hypothesis
will lead to rejection of H0 if and only if the hypothesized
value is not in the 100(1 - ) percent confidence interval
[l, u].
4-4 Inference on the Mean of a Population,
Variance Known
4-4.5 Confidence Interval on the Mean
Confidence Level and Precision of Estimation
The length of the two-sided 95% confidence interval is
whereas the length of the two-sided 99% confidence
interval is
4-4 Inference on the Mean of a Population,
Variance Known
4-4.5 Confidence Interval on the Mean
Choice of Sample Size
4-4 Inference on the Mean of a Population,
Variance Known
4-4.5 Confidence Interval on the Mean
Choice of Sample Size
4-4 Inference on the Mean of a Population,
Variance Known
4-4.5 Confidence Interval on the Mean
Choice of Sample Size
4-4 Inference on the Mean of a Population,
Variance Known
4-4.5 Confidence Interval on the Mean
One-Sided Confidence Bounds
4-4 Inference on the Mean of a Population,
Variance Known
4-4.6 General Method for Deriving a Confidence
Interval
4-5 Inference on the Mean of a Population,
Variance Unknown
4-5.1 Hypothesis Testing on the Mean
4-5 Inference on the Mean of a Population,
Variance Unknown
4-5.1 Hypothesis Testing on the Mean
4-5 Inference on the Mean of a Population,
Variance Unknown
4-5.1 Hypothesis Testing on the Mean
4-5 Inference on the Mean of a Population,
Variance Unknown
4-5.1 Hypothesis Testing on the Mean
Calculating the P-value
4-5 Inference on the Mean of a Population,
Variance Unknown
4-5.1 Hypothesis Testing on the Mean
4-5 Inference on the Mean of a Population,
Variance Unknown
4-5.1 Hypothesis Testing on the Mean
4-5 Inference on the Mean of a Population,
Variance Unknown
4-5.1 Hypothesis Testing on the Mean
4-5 Inference on the Mean of a Population,
Variance Unknown
4-5.1 Hypothesis Testing on the Mean
4-5 Inference on the Mean of a Population,
Variance Unknown
4-5.2 Type II Error and Choice of Sample Size
Fortunately, this unpleasant task has already been done,
and the results are summarized in a series of graphs in
Appendix A Charts Va, Vb, Vc, and Vd that plot for the
t-test against a parameter d for various sample sizes n.
4-5 Inference on the Mean of a Population,
Variance Unknown
4-5.2 Type II Error and Choice of Sample Size
These graphics are called operating characteristic
(or OC) curves. Curves are provided for two-sided
alternatives on Charts Va and Vb. The abscissa scale
factor d on these charts is defined as
4-5 Inference on the Mean of a Population,
Variance Unknown
4-5.3 Confidence Interval on the Mean
4-5 Inference on the Mean of a Population,
Variance Unknown
4-5.3 Confidence Interval on the Mean
4-5 Inference on the Mean of a Population,
Variance Unknown
4-5.4 Confidence Interval on the Mean
4-6 Inference on the Variance of a
Normal Population
4-6.1 Hypothesis Testing on the Variance of a
Normal Population
4-6 Inference on the Variance of a
Normal Population
4-6.1 Hypothesis Testing on the Variance of a
Normal Population
4-6 Inference on the Variance of a
Normal Population
4-6.1 Hypothesis Testing on the Variance of a
Normal Population
4-6 Inference on the Variance of a
Normal Population
4-6.1 Hypothesis Testing on the Variance of a
Normal Population
4-6 Inference on the Variance of a
Normal Population
4-6.1 Hypothesis Testing on the Variance of a
Normal Population
4-6 Inference on the Variance of a
Normal Population
4-6.1 Hypothesis Testing on the Variance of a
Normal Population
4-6 Inference on the Variance of a
Normal Population
4-6.2 Confidence Interval on the Variance of a
Normal Population
4-7 Inference on Population Proportion
4-7.1 Hypothesis Testing on a Binomial Proportion
We will consider testing:
4-7 Inference on Population Proportion
4-7.1 Hypothesis Testing on a Binomial Proportion
4-7 Inference on Population Proportion
4-7.1 Hypothesis Testing on a Binomial Proportion
4-7 Inference on Population Proportion
4-7.1 Hypothesis Testing on a Binomial Proportion
4-7 Inference on Population Proportion
4-7.2 Type II Error and Choice of Sample Size
4-7 Inference on Population Proportion
4-7.2 Type II Error and Choice of Sample Size
4-7 Inference on Population Proportion
4-7.3 Confidence Interval on a Binomial Proportion
4-7 Inference on Population Proportion
4-7.3 Confidence Interval on a Binomial Proportion
4-7 Inference on Population Proportion
4-7.3 Confidence Interval on a Binomial Proportion
Choice of Sample Size
4-8 Other Interval Estimates for a
Single Sample
4-8.1 Prediction Interval
4-8 Other Interval Estimates for a
Single Sample
4-8.2 Tolerance Intervals for a Normal Distribution
4-10 Testing for Goodness of Fit
• So far, we have assumed the population or probability
distribution for a particular problem is known.
• There are many instances where the underlying
distribution is not known, and we wish to test a particular
distribution.
• Use a goodness-of-fit test procedure based on the chi-
square distribution.
Hypothesis testing

Hypothesis testing

  • 4.
    4-1 Statistical Inference •The field of statistical inference consists of those methods used to make decisions or draw conclusions about a population. •These methods utilize the information contained in a sample from the population in drawing conclusions.
  • 5.
  • 6.
  • 7.
  • 8.
  • 9.
    4-3 Hypothesis Testing Welike to think of statistical hypothesis testing as the data analysis stage of a comparative experiment, in which the engineer is interested, for example, in comparing the mean of a population to a specified value (e.g. mean pull strength). 4-3.1 Statistical Hypotheses
  • 10.
    4-3 Hypothesis Testing Forexample, suppose that we are interested in the burning rate of a solid propellant used to power aircrew escape systems. • Now burning rate is a random variable that can be described by a probability distribution. • Suppose that our interest focuses on the mean burning rate (a parameter of this distribution). • Specifically, we are interested in deciding whether or not the mean burning rate is 50 centimeters per second. 4-3.1 Statistical Hypotheses
  • 11.
    4-3 Hypothesis Testing 4-3.1Statistical Hypotheses Two-sided Alternative Hypothesis One-sided Alternative Hypotheses
  • 12.
    4-3 Hypothesis Testing 4-3.1Statistical Hypotheses Test of a Hypothesis • A procedure leading to a decision about a particular hypothesis • Hypothesis-testing procedures rely on using the information in a random sample from the population of interest. • If this information is consistent with the hypothesis, then we will conclude that the hypothesis is true; if this information is inconsistent with the hypothesis, we will conclude that the hypothesis is false.
  • 13.
    4-3 Hypothesis Testing 4-3.2Testing Statistical Hypotheses
  • 14.
    4-3 Hypothesis Testing 4-3.2Testing Statistical Hypotheses
  • 15.
    4-3 Hypothesis Testing 4-3.2Testing Statistical Hypotheses Sometimes the type I error probability is called the significance level, or the -error, or the size of the test.
  • 16.
    4-3 Hypothesis Testing 4-3.2Testing Statistical Hypotheses
  • 17.
    4-3 Hypothesis Testing 4-3.2Testing Statistical Hypotheses
  • 18.
    4-3 Hypothesis Testing 4-3.2Testing Statistical Hypotheses
  • 19.
    4-3 Hypothesis Testing 4-3.2Testing Statistical Hypotheses
  • 20.
    4-3 Hypothesis Testing 4-3.2Testing Statistical Hypotheses
  • 21.
    4-3 Hypothesis Testing 4-3.2Testing Statistical Hypotheses • The power is computed as 1 - b, and power can be interpreted as the probability of correctly rejecting a false null hypothesis. We often compare statistical tests by comparing their power properties. • For example, consider the propellant burning rate problem when we are testing H 0 : m = 50 centimeters per second against H 1 : m not equal 50 centimeters per second . Suppose that the true value of the mean is m = 52. When n = 10, we found that b = 0.2643, so the power of this test is 1 - b = 1 - 0.2643 = 0.7357 when m = 52.
  • 22.
    4-3 Hypothesis Testing 4-3.3One-Sided and Two-Sided Hypotheses Two-Sided Test: One-Sided Tests:
  • 23.
    4-3 Hypothesis Testing 4-3.3P-Values in Hypothesis Testing
  • 24.
    4-3 Hypothesis Testing 4-3.5General Procedure for Hypothesis Testing
  • 25.
    4-4 Inference onthe Mean of a Population, Variance Known Assumptions
  • 26.
    4-4 Inference onthe Mean of a Population, Variance Known 4-4.1 Hypothesis Testing on the Mean We wish to test: The test statistic is:
  • 27.
    4-4 Inference onthe Mean of a Population, Variance Known 4-4.1 Hypothesis Testing on the Mean Reject H0 if the observed value of the test statistic z0 is either: or Fail to reject H0 if
  • 28.
    4-4 Inference onthe Mean of a Population, Variance Known 4-4.1 Hypothesis Testing on the Mean
  • 29.
    4-4 Inference onthe Mean of a Population, Variance Known 4-4.1 Hypothesis Testing on the Mean
  • 30.
    4-4 Inference onthe Mean of a Population, Variance Known 4-4.2 Type II Error and Choice of Sample Size Finding The Probability of Type II Error b
  • 31.
    4-4 Inference onthe Mean of a Population, Variance Known 4-4.2 Type II Error and Choice of Sample Size Sample Size Formulas
  • 32.
    4-4 Inference onthe Mean of a Population, Variance Known 4-4.2 Type II Error and Choice of Sample Size Sample Size Formulas
  • 33.
    4-4 Inference onthe Mean of a Population, Variance Known 4-4.2 Type II Error and Choice of Sample Size
  • 34.
    4-4 Inference onthe Mean of a Population, Variance Known 4-4.2 Type II Error and Choice of Sample Size
  • 35.
    4-4 Inference onthe Mean of a Population, Variance Known 4-4.3 Large Sample Test In general, if n  30, the sample variance s2 will be close to σ2 for most samples, and so s can be substituted for σ in the test procedures with little harmful effect.
  • 36.
    4-4 Inference onthe Mean of a Population, Variance Known 4-4.4 Some Practical Comments on Hypothesis Testing The Seven-Step Procedure Only three steps are really required:
  • 37.
    4-4 Inference onthe Mean of a Population, Variance Known 4-4.4 Some Practical Comments on Hypothesis Testing Statistical versus Practical Significance
  • 38.
    4-4 Inference onthe Mean of a Population, Variance Known 4-4.4 Some Practical Comments on Hypothesis Testing Statistical versus Practical Significance
  • 39.
    4-4 Inference onthe Mean of a Population, Variance Known 4-4.5 Confidence Interval on the Mean Two-sided confidence interval: One-sided confidence intervals: Confidence coefficient:
  • 40.
    4-4 Inference onthe Mean of a Population, Variance Known 4-4.5 Confidence Interval on the Mean
  • 41.
    4-4 Inference onthe Mean of a Population, Variance Known 4-4.6 Confidence Interval on the Mean
  • 42.
    4-4 Inference onthe Mean of a Population, Variance Known 4-4.5 Confidence Interval on the Mean
  • 43.
    4-4 Inference onthe Mean of a Population, Variance Known 4-4.5 Confidence Interval on the Mean Relationship between Tests of Hypotheses and Confidence Intervals If [l,u] is a 100(1 - ) percent confidence interval for the parameter, then the test of significance level  of the hypothesis will lead to rejection of H0 if and only if the hypothesized value is not in the 100(1 - ) percent confidence interval [l, u].
  • 44.
    4-4 Inference onthe Mean of a Population, Variance Known 4-4.5 Confidence Interval on the Mean Confidence Level and Precision of Estimation The length of the two-sided 95% confidence interval is whereas the length of the two-sided 99% confidence interval is
  • 45.
    4-4 Inference onthe Mean of a Population, Variance Known 4-4.5 Confidence Interval on the Mean Choice of Sample Size
  • 46.
    4-4 Inference onthe Mean of a Population, Variance Known 4-4.5 Confidence Interval on the Mean Choice of Sample Size
  • 47.
    4-4 Inference onthe Mean of a Population, Variance Known 4-4.5 Confidence Interval on the Mean Choice of Sample Size
  • 48.
    4-4 Inference onthe Mean of a Population, Variance Known 4-4.5 Confidence Interval on the Mean One-Sided Confidence Bounds
  • 49.
    4-4 Inference onthe Mean of a Population, Variance Known 4-4.6 General Method for Deriving a Confidence Interval
  • 50.
    4-5 Inference onthe Mean of a Population, Variance Unknown 4-5.1 Hypothesis Testing on the Mean
  • 51.
    4-5 Inference onthe Mean of a Population, Variance Unknown 4-5.1 Hypothesis Testing on the Mean
  • 52.
    4-5 Inference onthe Mean of a Population, Variance Unknown 4-5.1 Hypothesis Testing on the Mean
  • 53.
    4-5 Inference onthe Mean of a Population, Variance Unknown 4-5.1 Hypothesis Testing on the Mean Calculating the P-value
  • 54.
    4-5 Inference onthe Mean of a Population, Variance Unknown 4-5.1 Hypothesis Testing on the Mean
  • 55.
    4-5 Inference onthe Mean of a Population, Variance Unknown 4-5.1 Hypothesis Testing on the Mean
  • 56.
    4-5 Inference onthe Mean of a Population, Variance Unknown 4-5.1 Hypothesis Testing on the Mean
  • 57.
    4-5 Inference onthe Mean of a Population, Variance Unknown 4-5.1 Hypothesis Testing on the Mean
  • 58.
    4-5 Inference onthe Mean of a Population, Variance Unknown 4-5.2 Type II Error and Choice of Sample Size Fortunately, this unpleasant task has already been done, and the results are summarized in a series of graphs in Appendix A Charts Va, Vb, Vc, and Vd that plot for the t-test against a parameter d for various sample sizes n.
  • 59.
    4-5 Inference onthe Mean of a Population, Variance Unknown 4-5.2 Type II Error and Choice of Sample Size These graphics are called operating characteristic (or OC) curves. Curves are provided for two-sided alternatives on Charts Va and Vb. The abscissa scale factor d on these charts is defined as
  • 60.
    4-5 Inference onthe Mean of a Population, Variance Unknown 4-5.3 Confidence Interval on the Mean
  • 61.
    4-5 Inference onthe Mean of a Population, Variance Unknown 4-5.3 Confidence Interval on the Mean
  • 62.
    4-5 Inference onthe Mean of a Population, Variance Unknown 4-5.4 Confidence Interval on the Mean
  • 63.
    4-6 Inference onthe Variance of a Normal Population 4-6.1 Hypothesis Testing on the Variance of a Normal Population
  • 64.
    4-6 Inference onthe Variance of a Normal Population 4-6.1 Hypothesis Testing on the Variance of a Normal Population
  • 65.
    4-6 Inference onthe Variance of a Normal Population 4-6.1 Hypothesis Testing on the Variance of a Normal Population
  • 66.
    4-6 Inference onthe Variance of a Normal Population 4-6.1 Hypothesis Testing on the Variance of a Normal Population
  • 67.
    4-6 Inference onthe Variance of a Normal Population 4-6.1 Hypothesis Testing on the Variance of a Normal Population
  • 68.
    4-6 Inference onthe Variance of a Normal Population 4-6.1 Hypothesis Testing on the Variance of a Normal Population
  • 69.
    4-6 Inference onthe Variance of a Normal Population 4-6.2 Confidence Interval on the Variance of a Normal Population
  • 70.
    4-7 Inference onPopulation Proportion 4-7.1 Hypothesis Testing on a Binomial Proportion We will consider testing:
  • 71.
    4-7 Inference onPopulation Proportion 4-7.1 Hypothesis Testing on a Binomial Proportion
  • 72.
    4-7 Inference onPopulation Proportion 4-7.1 Hypothesis Testing on a Binomial Proportion
  • 73.
    4-7 Inference onPopulation Proportion 4-7.1 Hypothesis Testing on a Binomial Proportion
  • 74.
    4-7 Inference onPopulation Proportion 4-7.2 Type II Error and Choice of Sample Size
  • 75.
    4-7 Inference onPopulation Proportion 4-7.2 Type II Error and Choice of Sample Size
  • 76.
    4-7 Inference onPopulation Proportion 4-7.3 Confidence Interval on a Binomial Proportion
  • 77.
    4-7 Inference onPopulation Proportion 4-7.3 Confidence Interval on a Binomial Proportion
  • 78.
    4-7 Inference onPopulation Proportion 4-7.3 Confidence Interval on a Binomial Proportion Choice of Sample Size
  • 79.
    4-8 Other IntervalEstimates for a Single Sample 4-8.1 Prediction Interval
  • 80.
    4-8 Other IntervalEstimates for a Single Sample 4-8.2 Tolerance Intervals for a Normal Distribution
  • 81.
    4-10 Testing forGoodness of Fit • So far, we have assumed the population or probability distribution for a particular problem is known. • There are many instances where the underlying distribution is not known, and we wish to test a particular distribution. • Use a goodness-of-fit test procedure based on the chi- square distribution.