This document summarizes a study that used two techniques - linear interpolation and Lagrangian interpolation - to extract red edge positions (REPs) from hyperspectral data of different vegetation covers in a forest area. The linear technique used four bands to calculate REP wavelength and reflectance values simply. The Lagrangian technique fitted a polynomial to derivative reflectance values around the red edge to estimate REP. Both techniques were compared to ground reference data. Results showed younger plants with higher chlorophyll had REPs at longer wavelengths and higher reflectances than older plants with lower chlorophyll.
NIR in Leaf Chlorophyll Concentration EstimationIRJET Journal
This document discusses using field imaging spectroscopy and random forests to estimate leaf chlorophyll concentration in soybeans. A field imaging spectrometer system was used to collect hyperspectral reflectance data from soybean leaves. The PROSPECT radiative transfer model was used to relate the spectral data to chlorophyll content. Random forests were then used to develop a model for estimating chlorophyll content based on the spectral data. The model was able to accurately retrieve chlorophyll content from validation spectral data, demonstrating the potential of this approach for remote monitoring of crop health conditions. Future work involves applying this method from field to satellite data to allow monitoring soybean health over large areas.
Application of spectral remote sensing in agronomic decision by Dr.V.Harihara...Hari Hariharasudhan
Spectral remote sensing allows for the non-destructive evaluation of plant responses to environmental stresses. Remote sensing utilizes the distinctive spectral signatures of healthy and stressed vegetation. Key plant pigments like chlorophyll strongly influence reflectance patterns and can indicate crop health. Various vegetation indices using reflectance values in different wavelength bands have been developed to retrieve agronomic parameters and assess stress from remote sensors. This provides opportunities for early and efficient monitoring of crop conditions.
To meet the various information requirements in forest management, different data sources like field survey, aerial photography, and satellite imagery is used, depending on the level of detail required and the extension of the area under study.
This document discusses classifying land cover, forest, and tree species using data from the ZiYuan-3 satellite. It finds that using multiple data sources, like spectral bands, vegetation indices, textures, and topographic factors, improves classification accuracy compared to just using spectral bands. It also finds that combining multi-season images further improves accuracy. While some machine learning algorithms performed better than traditional classifiers when using multiple data sources, no single classification algorithm worked best for all tree species classes. The document concludes it is necessary to develop a customized classification approach using specific data and algorithms for each class.
Prediction of soil urea content using rf spectroscopy and partial least squar...IAEME Publication
This document summarizes a study that used radio frequency (RF) spectroscopy and partial least squares regression (PLSR) to predict soil urea content. 20 soil samples with varying concentrations of nutrients including urea were analyzed using an RF spectrometer. 16 samples were used to calibrate a PLSR model and the remaining 4 samples were used to validate the model's predictions of urea content. The PLSR model achieved an R2 value of 0.987 and prediction errors ranging from 0.49% to 2.78% for the validation samples, indicating RF spectroscopy combined with PLSR can accurately predict soil urea content. The study demonstrated the potential of this approach for analyzing soil nutrients but was limited to laboratory-
Application of remote sensing in forest ecosystemaliya nasir
Established remote sensing systems provide opportunities to develop and apply new measurements of ecosystem function across landscapes, regions and continents.
New efforts to predict the consequences of ecosystem function change, both natural and human- induced, on the regional and global distributions and abundances of species should be a high research priority
Algorithm for detecting deforestation and forest degradation using vegetation...TELKOMNIKA JOURNAL
In forestry sector, the remote sensing technology hold a key role on forest inventory and
monitoring their changes. This paper describes the algorithm for detecting deforestation and forest
degradation using high resolution satellite imageries with knowledge-based approach. The main objective
of the study is to develop a practical technique for monitoring deforestation and forest degradation
occurred within the mangrove and swamp forest ecosystem. The SPOT 4, 5, and 6 images acquired in
2007, 2012 and 2014 were transformed into three vegetation indices, i.e., Normalized Difference
Vegetation Index (NDVI), Green-Normalized Difference Vegetation index (GNDVI) and Normalized
Green-Red Vegetation index (NRGI). The study found that deforestation was well detected and identified
using the NDVI and GNDVI, however the forest degradation could be well detected using NRGI, better
than NDVI and GNDVI. The study concludes that the strategy for monitoring deforestation, biomass-based
forest degradation as well as forest growth could be done by combining the use of NDVI, GNDVI and
NRGI respectively.
study and analysis of hy si data in 400 to 500IJAEMSJORNAL
This document summarizes a research paper that analyzed hyperspectral data in the 400-500nm visible and near infrared (VNIR) spectrum for precision agriculture applications. Specifically:
1) Hyperspectral imagery of the Amravati region of India was classified using maximum likelihood classification to determine soil, water, and vegetation indices. Spectral graphs showed reflectance curves for each.
2) The analysis aims to extract information about the terrain from hyperspectral data in a way that is easily understood. Such data provides more accurate information than multispectral data due to the large number of narrow bands.
3) Supervised classification with maximum likelihood was used to categorize pixels into classes for producing the
This document discusses how remote sensing can be used to manage forests as a natural resource. It explains that remote sensing involves collecting information about the Earth's surface using sensors, and describes how different wavelengths of electromagnetic radiation interact with and provide information about forest vegetation. It then provides examples of specific forestry applications of remote sensing, such as forest fire monitoring, biomass estimation, forest management, and environmental monitoring.
Measuring Individual Tree Height and Crown Diameter for Mangrove Trees with A...INFOGAIN PUBLICATION
Mangroves are unique ecosystems that provide valuable coastal area habitats, protection, and services. Access to observing mangrove forests is typically difficult on the ground. Therefore, it is of interest to develop and evaluate remote sensing methods that enable us to obtain accurate information on the structure of mangrove forests and to monitor their condition in time. The main objective of this study was to develop a methodology for processing airborne lidar data for measuring height and crown diameter for mangrove forests in the north-eastern coastal areas of Brazil. Specific objectives were to: (1) evaluate the most appropriate lidar data processing approach, such as area-based or individual tree methods, (2) investigate the most appropriate parameters for lidar-derived data products when estimating height and crown diameter, such as the spatial resolution of canopy height models and ground elevation models; and (3) compare the accuracy of lidar estimates to field measurements of height and crown diameter. The lidar dataset was acquired over mangrove forest of the northeast of Brazil. The crown diameter was calculated as the average of two values measured along two perpendicular directions from the location of each tree top by fitting a fourth-degree polynomial on both profiles. The lidar-derived tree measurements were used with regression models and cross-validation to estimate plot level field-measured crown diameter. Root mean square error, linear regression and the Nash-Sutcliffe coefficient were also used to compare lidar height and field height. The mean of lidar-estimated tree height was 9,48m and the mean of field tree height was 8.44m. The correlation between lidar tree height and field tree height was r= 0.60, E=-0.06 and RMSE= 2.8. The correlation between height and crown diameter needed to parameterized the individual tree identification software obtained for 32 trees was r= 0.83 and determination coefficient was r2 = 0.69. The results of the current study show that lidar data could be used to estimate height and average crown diameter of mangrove trees and to improve estimates of other mangrove forest biophysical parameters of interest by focusing at the individual tree level. The research presented in this study contributes to the overall knowledge of using lidar remote sensing to measure and monitor mangrove forests.
Carbon Stocks Estimation in South East Sulawesi Tropical Forest, Indonesia, u...ijceronline
This document summarizes a study that estimated carbon stocks in a tropical forest in Southeast Sulawesi, Indonesia using Polarimetric Interferometry Synthetic Aperture Radar (PolInSAR). Two ALOS PALSAR images with a 46 day temporal baseline were processed to form a Random Volume over Ground model and optimize coherence. Field measurements of tree heights and diameters were converted to carbon stock volumes using allometric equations. The resulting forest heights and carbon stocks from PolInSAR inversion correlated positively with ground measurements.
A low cost spectroscopy with Raspberry Pi for soil macronutrient monitoringTELKOMNIKA JOURNAL
Soil spectroscopy measurement is widely used to determine the macronutrients content in the soil. Spectrometer is costly equipment and commonly used to determine the transmittance, absorbance or reflectance level of various liquids and opaque solids by measuring the intensity of light as a light source passes through a sample chemical substance. This paper is reported on a low cost experimental assessment of soil macronutrient for soil spectroscopy utilizing Raspberry Pi (RPI) module in visible and near-infrared (NIR) wavelength. The sensitivity measurements are mainly due to the concentration level and the intensity of light emitting diode (LED) light source. The work is focusing on the absorbance spectroscopy particularly on linear relationship to determine the Nitrogen (N), Phosphorus (P) and Potassium (K) content level in soil using colour-developing reagent. The development of low cost and portable RPI based spectrophotometer has created new possibilities to measure the concentration level of the existed soil macronutrient within visible and infrared light wavelength of light sources. The absorbance of light was computed based on Beer-Lambert Law. The low cost RPI based spectrometer costs 80% less than the spectrometer available in the market and is capable of recording the absorbance measurements up to 5 samples. The performance of this prototype shows that it is possible to build the spectrometer using open-source software and hardware by considering the limiting factors such as light transfer to the sample, spectral filtering and the sensitivity due to the signal-to-noise ratio.
Hyperspectral & Remote Sensing on Remote Sensing and GIS.pptxKabaliVasudevasu
This document provides an overview of a presentation on hyperspectral analysis. It discusses hyperspectral imaging techniques, sensors, applications, and includes references. The presentation was given by 4 students - Nilotpal Lahkar, Navya Bharathi, Sai Bharathi, and Vamshi Palaparthi - at the National Institute of Technology in Warangal, India in 2024-2025. The document covers the working principles of hyperspectral imaging, advantages, differences between hyperspectral, multispectral and optical sensors, examples of hyperspectral sensors including airborne and spaceborne sensors, and applications of hyperspectral analysis.
This document discusses using imaging spectroscopy to estimate chlorophyll content in soybean leaves. It begins with an introduction to near infrared spectroscopy and its history. It then describes how a field imaging spectroscopy system was used to collect spectral data from soybean leaves. Random forests regression and the PROSPECT radiative transfer model were used to establish a model for estimating chlorophyll concentration from the spectral data. The model was able to accurately estimate chlorophyll content in soybean leaves and has potential applications for precision agriculture management and monitoring crop health at larger scales using remote sensing.
This document describes a class project that aims to map crop residues using hyperspectral data. It will generate estimates of crop residue cover and amount in agricultural fields in Central Indiana using Landsat 7 ETM+, EO-1 ALI, and EO-1 Hyperion data from April 12, 2003. Methods will include pre-processing the hyperspectral data through de-striping and atmospheric corrections, then calculating indices like the Cellulose Absorption Index to classify crop residues and differentiate tillage systems. The results will provide information on quantifying and mapping crop residues using remote sensing techniques.
Using Infrared Spectroscopy for Detection of Changes in Soil Properties in Se...ExternalEvents
This presentation was presented during the 3 Parallel session on Theme 1, Monitoring, mapping, measuring, reporting and verification (MRV) of SOC, of the Global Symposium on Soil Organic Carbon that took place in Rome 21-23 March 2017. The presentation was made by Ms. Caroline Ouko, from CETRAD - Kenya, in FAO Hq, Rome
Remote sensing of biophysical parameters: linking field, airborne and contine...TERN Australia
The document discusses the Australian Supersites Network (ASN) and AusCover program for collecting field, airborne, and satellite data on biophysical parameters across Australia. AusCover establishes consistent field sites and collects ground measurements of vegetation structure and composition to validate satellite-derived maps of persistent green vegetation cover. Airborne lidar and hyperspectral data are also collected and compared to Landsat imagery and field data. The goal is to link multi-scale data to further ecosystem monitoring and understanding of productivity, biomass, and vegetation change over time. National collaborations support ongoing data collection and research using the unique datasets.
LiDAR technology and its application in forestry. Three papers are summarized that examine the use of airborne LiDAR data in characterizing forest structure. Paper 1 estimates indices of structural diversity like tree height and diameter variation across a study area in Italy. Paper 2 presents a method to characterize forest ecological structure in Tasmania using different LiDAR pulse returns. Paper 3 develops new methods to estimate tree-level biomass using metrics from LiDAR point clouds, improving accuracy of biomass estimates. Overall, the studies find LiDAR useful for quantifying forest structural complexity at multiple scales in an efficient manner.
The document outlines a framework for measuring and monitoring land health and degradation through field measurements and remote sensing. It describes a stratified sampling approach with sentinel sites, clusters, plots and sub-plots to collect biophysical data on vegetation, soils, and trace gases. Remote sensing is used to extrapolate ground measurements and characterize spatial heterogeneity. Soil and carbon models integrate field and remote sensing data for carbon accounting and analysis at local to global scales.
Standard Soil Testing Laboratory
time consuming, Laborious, use of chemical and reagents which effect human health and environment, costly, do not consider spatial variation in the field.
Electrochemical Sensing
Ion Selective Electrodes
Ion Sensitive Field Effect Transistor
Optical Spectroscopy
NIR Spectroscopy
This document discusses the application of near infrared reflectance spectroscopy (NIRS) in the feed industry. NIRS is a rapid, nondestructive technique used to determine the protein, moisture, starch, lipid, and ash content of feed ingredients. It has been accepted as an official method for analyzing crude protein, acid detergent fiber, and moisture in feeds. NIRS can also be used to detect heat damaged proteins, fungal contamination, and adulteration in feeds. Calibrations are developed using statistical methods to relate NIR spectra to wet chemistry values. NIRS offers advantages such as rapid analysis, little to no sample preparation, simultaneous analysis of multiple components, and environmental friendliness.
Near infrared reflectance spectroscopy (NIRS) is a technique that can be used to analyze the chemical composition of feed and fishmeal by measuring the absorption of near infrared light. NIRS allows for rapid, non-destructive testing of samples to determine levels of components like protein, moisture, fat, and ash. The document discusses the principles behind NIRS, calibration procedures, applications in analyzing fishmeal and other feeds, and the advantages and limitations of using NIRS for feed analysis.
Geoinformatics For Precision AgricultureRahul Gadakh
1) Geoinformatics deals with the capture, classification, storage, processing, portrayal, and dissemination of spatial information. It involves technologies like remote sensing, GIS, GPS, and photogrammetry.
2) It is used for applications like land use mapping, precision agriculture, crop discrimination and yield monitoring, soil mapping, and monitoring of land degradation.
3) Hyperspectral data and narrowband vegetation indices derived from it allow detailed analysis of crop biochemical and biophysical properties for improved classification and mapping of agricultural crops.
This document discusses the use of infrared spectroscopy, specifically mid-infrared (MIR) and near-infrared (NIR), as an analytical tool in the food industry. It explains that MIR and NIR spectroscopy can be used to quantify major food constituents like water, proteins, lipids, and sugars quickly and without sample preparation. The document provides examples of applications for MIR and NIR spectroscopy in analyzing cereals, grains, flour, bread, dairy products, and more. Infrared spectroscopy is presented as a powerful technique that provides both qualitative and quantitative food analysis faster and with less chemicals than traditional methods.
In India, agriculture is one of the major application areas of the remote sensing technology. Various national level agricultural applications have been developed which showcases the use of remote sensing data provided by the sensors/satellites launched by the country’s space agency, Indian Space Research Organisation (ISRO)
Sensational How To Write A College Level Essay StepErin Torres
1. The document outlines a five-step process for getting college-level essay writing help from HelpWriting.net, including registering for an account, completing an order form with instructions and deadline, reviewing writer bids and choosing one, authorizing payment upon approval of the paper, and requesting revisions if needed.
2. Students can get a paper written for them by completing a 10-minute order form providing instructions, sources, and deadline, and writers will bid on the request with their qualifications and order history taken into account.
3. HelpWriting.net promises original, high-quality content and refunds for plagiarized papers, allowing students to get writing
Cat Letter Writing Set Cute Cats Writing Paper With PrErin Torres
This document provides instructions for requesting writing assistance from the HelpWriting.net website in 5 steps:
1. Create an account with a password and email.
2. Complete a 10-minute order form providing instructions, sources, deadline and attach a sample if wanting style imitation.
3. Review bids from writers and choose one based on qualifications, history and feedback, then pay a deposit.
4. Review the completed paper and authorize final payment if pleased, or request revisions using free revision services.
5. Choose HelpWriting.net confidently knowing needs will be fully met, or receive a full refund if plagiarized.
More Related Content
Similar to Hyperspectral Remote Sensing Of Vegetation Using Red Edge Position Techniques
This document discusses how remote sensing can be used to manage forests as a natural resource. It explains that remote sensing involves collecting information about the Earth's surface using sensors, and describes how different wavelengths of electromagnetic radiation interact with and provide information about forest vegetation. It then provides examples of specific forestry applications of remote sensing, such as forest fire monitoring, biomass estimation, forest management, and environmental monitoring.
Measuring Individual Tree Height and Crown Diameter for Mangrove Trees with A...INFOGAIN PUBLICATION
Mangroves are unique ecosystems that provide valuable coastal area habitats, protection, and services. Access to observing mangrove forests is typically difficult on the ground. Therefore, it is of interest to develop and evaluate remote sensing methods that enable us to obtain accurate information on the structure of mangrove forests and to monitor their condition in time. The main objective of this study was to develop a methodology for processing airborne lidar data for measuring height and crown diameter for mangrove forests in the north-eastern coastal areas of Brazil. Specific objectives were to: (1) evaluate the most appropriate lidar data processing approach, such as area-based or individual tree methods, (2) investigate the most appropriate parameters for lidar-derived data products when estimating height and crown diameter, such as the spatial resolution of canopy height models and ground elevation models; and (3) compare the accuracy of lidar estimates to field measurements of height and crown diameter. The lidar dataset was acquired over mangrove forest of the northeast of Brazil. The crown diameter was calculated as the average of two values measured along two perpendicular directions from the location of each tree top by fitting a fourth-degree polynomial on both profiles. The lidar-derived tree measurements were used with regression models and cross-validation to estimate plot level field-measured crown diameter. Root mean square error, linear regression and the Nash-Sutcliffe coefficient were also used to compare lidar height and field height. The mean of lidar-estimated tree height was 9,48m and the mean of field tree height was 8.44m. The correlation between lidar tree height and field tree height was r= 0.60, E=-0.06 and RMSE= 2.8. The correlation between height and crown diameter needed to parameterized the individual tree identification software obtained for 32 trees was r= 0.83 and determination coefficient was r2 = 0.69. The results of the current study show that lidar data could be used to estimate height and average crown diameter of mangrove trees and to improve estimates of other mangrove forest biophysical parameters of interest by focusing at the individual tree level. The research presented in this study contributes to the overall knowledge of using lidar remote sensing to measure and monitor mangrove forests.
Measuring Individual Tree Height and Crown Diameter for Mangrove Trees with A...INFOGAIN PUBLICATION
Mangroves are unique ecosystems that provide valuable coastal area habitats, protection, and services. Access to observing mangrove forests is typically difficult on the ground. Therefore, it is of interest to develop and evaluate remote sensing methods that enable us to obtain accurate information on the structure of mangrove forests and to monitor their condition in time. The main objective of this study was to develop a methodology for processing airborne lidar data for measuring height and crown diameter for mangrove forests in the north-eastern coastal areas of Brazil. Specific objectives were to: (1) evaluate the most appropriate lidar data processing approach, such as area-based or individual tree methods, (2) investigate the most appropriate parameters for lidar-derived data products when estimating height and crown diameter, such as the spatial resolution of canopy height models and ground elevation models; and (3) compare the accuracy of lidar estimates to field measurements of height and crown diameter. The lidar dataset was acquired over mangrove forest of the northeast of Brazil. The crown diameter was calculated as the average of two values measured along two perpendicular directions from the location of each tree top by fitting a fourth-degree polynomial on both profiles. The lidar-derived tree measurements were used with regression models and cross-validation to estimate plot level field-measured crown diameter. Root mean square error, linear regression and the Nash-Sutcliffe coefficient were also used to compare lidar height and field height. The mean of lidar-estimated tree height was 9,48m and the mean of field tree height was 8.44m. The correlation between lidar tree height and field tree height was r= 0.60, E=-0.06 and RMSE= 2.8. The correlation between height and crown diameter needed to parameterized the individual tree identification software obtained for 32 trees was r= 0.83 and determination coefficient was r2 = 0.69. The results of the current study show that lidar data could be used to estimate height and average crown diameter of mangrove trees and to improve estimates of other mangrove forest biophysical parameters of interest by focusing at the individual tree level. The research presented in this study contributes to the overall knowledge of using lidar remote sensing to measure and monitor mangrove forests.
Measuring Individual Tree Height and Crown Diameter for Mangrove Trees with A...INFOGAIN PUBLICATION
Mangroves are unique ecosystems that provide valuable coastal area habitats, protection, and services. Access to observing mangrove forests is typically difficult on the ground. Therefore, it is of interest to develop and evaluate remote sensing methods that enable us to obtain accurate information on the structure of mangrove forests and to monitor their condition in time. The main objective of this study was to develop a methodology for processing airborne lidar data for measuring height and crown diameter for mangrove forests in the north-eastern coastal areas of Brazil. Specific objectives were to: (1) evaluate the most appropriate lidar data processing approach, such as area-based or individual tree methods, (2) investigate the most appropriate parameters for lidar-derived data products when estimating height and crown diameter, such as the spatial resolution of canopy height models and ground elevation models; and (3) compare the accuracy of lidar estimates to field measurements of height and crown diameter. The lidar dataset was acquired over mangrove forest of the northeast of Brazil. The crown diameter was calculated as the average of two values measured along two perpendicular directions from the location of each tree top by fitting a fourth-degree polynomial on both profiles. The lidar-derived tree measurements were used with regression models and cross-validation to estimate plot level field-measured crown diameter. Root mean square error, linear regression and the Nash-Sutcliffe coefficient were also used to compare lidar height and field height. The mean of lidar-estimated tree height was 9,48m and the mean of field tree height was 8.44m. The correlation between lidar tree height and field tree height was r= 0.60, E=-0.06 and RMSE= 2.8. The correlation between height and crown diameter needed to parameterized the individual tree identification software obtained for 32 trees was r= 0.83 and determination coefficient was r2 = 0.69. The results of the current study show that lidar data could be used to estimate height and average crown diameter of mangrove trees and to improve estimates of other mangrove forest biophysical parameters of interest by focusing at the individual tree level. The research presented in this study contributes to the overall knowledge of using lidar remote sensing to measure and monitor mangrove forests.
Carbon Stocks Estimation in South East Sulawesi Tropical Forest, Indonesia, u...ijceronline
This document summarizes a study that estimated carbon stocks in a tropical forest in Southeast Sulawesi, Indonesia using Polarimetric Interferometry Synthetic Aperture Radar (PolInSAR). Two ALOS PALSAR images with a 46 day temporal baseline were processed to form a Random Volume over Ground model and optimize coherence. Field measurements of tree heights and diameters were converted to carbon stock volumes using allometric equations. The resulting forest heights and carbon stocks from PolInSAR inversion correlated positively with ground measurements.
A low cost spectroscopy with Raspberry Pi for soil macronutrient monitoringTELKOMNIKA JOURNAL
Soil spectroscopy measurement is widely used to determine the macronutrients content in the soil. Spectrometer is costly equipment and commonly used to determine the transmittance, absorbance or reflectance level of various liquids and opaque solids by measuring the intensity of light as a light source passes through a sample chemical substance. This paper is reported on a low cost experimental assessment of soil macronutrient for soil spectroscopy utilizing Raspberry Pi (RPI) module in visible and near-infrared (NIR) wavelength. The sensitivity measurements are mainly due to the concentration level and the intensity of light emitting diode (LED) light source. The work is focusing on the absorbance spectroscopy particularly on linear relationship to determine the Nitrogen (N), Phosphorus (P) and Potassium (K) content level in soil using colour-developing reagent. The development of low cost and portable RPI based spectrophotometer has created new possibilities to measure the concentration level of the existed soil macronutrient within visible and infrared light wavelength of light sources. The absorbance of light was computed based on Beer-Lambert Law. The low cost RPI based spectrometer costs 80% less than the spectrometer available in the market and is capable of recording the absorbance measurements up to 5 samples. The performance of this prototype shows that it is possible to build the spectrometer using open-source software and hardware by considering the limiting factors such as light transfer to the sample, spectral filtering and the sensitivity due to the signal-to-noise ratio.
Hyperspectral & Remote Sensing on Remote Sensing and GIS.pptxKabaliVasudevasu
This document provides an overview of a presentation on hyperspectral analysis. It discusses hyperspectral imaging techniques, sensors, applications, and includes references. The presentation was given by 4 students - Nilotpal Lahkar, Navya Bharathi, Sai Bharathi, and Vamshi Palaparthi - at the National Institute of Technology in Warangal, India in 2024-2025. The document covers the working principles of hyperspectral imaging, advantages, differences between hyperspectral, multispectral and optical sensors, examples of hyperspectral sensors including airborne and spaceborne sensors, and applications of hyperspectral analysis.
This document discusses using imaging spectroscopy to estimate chlorophyll content in soybean leaves. It begins with an introduction to near infrared spectroscopy and its history. It then describes how a field imaging spectroscopy system was used to collect spectral data from soybean leaves. Random forests regression and the PROSPECT radiative transfer model were used to establish a model for estimating chlorophyll concentration from the spectral data. The model was able to accurately estimate chlorophyll content in soybean leaves and has potential applications for precision agriculture management and monitoring crop health at larger scales using remote sensing.
This document describes a class project that aims to map crop residues using hyperspectral data. It will generate estimates of crop residue cover and amount in agricultural fields in Central Indiana using Landsat 7 ETM+, EO-1 ALI, and EO-1 Hyperion data from April 12, 2003. Methods will include pre-processing the hyperspectral data through de-striping and atmospheric corrections, then calculating indices like the Cellulose Absorption Index to classify crop residues and differentiate tillage systems. The results will provide information on quantifying and mapping crop residues using remote sensing techniques.
Using Infrared Spectroscopy for Detection of Changes in Soil Properties in Se...ExternalEvents
This presentation was presented during the 3 Parallel session on Theme 1, Monitoring, mapping, measuring, reporting and verification (MRV) of SOC, of the Global Symposium on Soil Organic Carbon that took place in Rome 21-23 March 2017. The presentation was made by Ms. Caroline Ouko, from CETRAD - Kenya, in FAO Hq, Rome
Remote sensing of biophysical parameters: linking field, airborne and contine...TERN Australia
The document discusses the Australian Supersites Network (ASN) and AusCover program for collecting field, airborne, and satellite data on biophysical parameters across Australia. AusCover establishes consistent field sites and collects ground measurements of vegetation structure and composition to validate satellite-derived maps of persistent green vegetation cover. Airborne lidar and hyperspectral data are also collected and compared to Landsat imagery and field data. The goal is to link multi-scale data to further ecosystem monitoring and understanding of productivity, biomass, and vegetation change over time. National collaborations support ongoing data collection and research using the unique datasets.
LiDAR technology and its application in forestry. Three papers are summarized that examine the use of airborne LiDAR data in characterizing forest structure. Paper 1 estimates indices of structural diversity like tree height and diameter variation across a study area in Italy. Paper 2 presents a method to characterize forest ecological structure in Tasmania using different LiDAR pulse returns. Paper 3 develops new methods to estimate tree-level biomass using metrics from LiDAR point clouds, improving accuracy of biomass estimates. Overall, the studies find LiDAR useful for quantifying forest structural complexity at multiple scales in an efficient manner.
The document outlines a framework for measuring and monitoring land health and degradation through field measurements and remote sensing. It describes a stratified sampling approach with sentinel sites, clusters, plots and sub-plots to collect biophysical data on vegetation, soils, and trace gases. Remote sensing is used to extrapolate ground measurements and characterize spatial heterogeneity. Soil and carbon models integrate field and remote sensing data for carbon accounting and analysis at local to global scales.
Standard Soil Testing Laboratory
time consuming, Laborious, use of chemical and reagents which effect human health and environment, costly, do not consider spatial variation in the field.
Electrochemical Sensing
Ion Selective Electrodes
Ion Sensitive Field Effect Transistor
Optical Spectroscopy
NIR Spectroscopy
This document discusses the application of near infrared reflectance spectroscopy (NIRS) in the feed industry. NIRS is a rapid, nondestructive technique used to determine the protein, moisture, starch, lipid, and ash content of feed ingredients. It has been accepted as an official method for analyzing crude protein, acid detergent fiber, and moisture in feeds. NIRS can also be used to detect heat damaged proteins, fungal contamination, and adulteration in feeds. Calibrations are developed using statistical methods to relate NIR spectra to wet chemistry values. NIRS offers advantages such as rapid analysis, little to no sample preparation, simultaneous analysis of multiple components, and environmental friendliness.
Near infrared reflectance spectroscopy (NIRS) is a technique that can be used to analyze the chemical composition of feed and fishmeal by measuring the absorption of near infrared light. NIRS allows for rapid, non-destructive testing of samples to determine levels of components like protein, moisture, fat, and ash. The document discusses the principles behind NIRS, calibration procedures, applications in analyzing fishmeal and other feeds, and the advantages and limitations of using NIRS for feed analysis.
Geoinformatics For Precision AgricultureRahul Gadakh
1) Geoinformatics deals with the capture, classification, storage, processing, portrayal, and dissemination of spatial information. It involves technologies like remote sensing, GIS, GPS, and photogrammetry.
2) It is used for applications like land use mapping, precision agriculture, crop discrimination and yield monitoring, soil mapping, and monitoring of land degradation.
3) Hyperspectral data and narrowband vegetation indices derived from it allow detailed analysis of crop biochemical and biophysical properties for improved classification and mapping of agricultural crops.
This document discusses the use of infrared spectroscopy, specifically mid-infrared (MIR) and near-infrared (NIR), as an analytical tool in the food industry. It explains that MIR and NIR spectroscopy can be used to quantify major food constituents like water, proteins, lipids, and sugars quickly and without sample preparation. The document provides examples of applications for MIR and NIR spectroscopy in analyzing cereals, grains, flour, bread, dairy products, and more. Infrared spectroscopy is presented as a powerful technique that provides both qualitative and quantitative food analysis faster and with less chemicals than traditional methods.
In India, agriculture is one of the major application areas of the remote sensing technology. Various national level agricultural applications have been developed which showcases the use of remote sensing data provided by the sensors/satellites launched by the country’s space agency, Indian Space Research Organisation (ISRO)
Similar to Hyperspectral Remote Sensing Of Vegetation Using Red Edge Position Techniques (20)
Sensational How To Write A College Level Essay StepErin Torres
1. The document outlines a five-step process for getting college-level essay writing help from HelpWriting.net, including registering for an account, completing an order form with instructions and deadline, reviewing writer bids and choosing one, authorizing payment upon approval of the paper, and requesting revisions if needed.
2. Students can get a paper written for them by completing a 10-minute order form providing instructions, sources, and deadline, and writers will bid on the request with their qualifications and order history taken into account.
3. HelpWriting.net promises original, high-quality content and refunds for plagiarized papers, allowing students to get writing
Cat Letter Writing Set Cute Cats Writing Paper With PrErin Torres
This document provides instructions for requesting writing assistance from the HelpWriting.net website in 5 steps:
1. Create an account with a password and email.
2. Complete a 10-minute order form providing instructions, sources, deadline and attach a sample if wanting style imitation.
3. Review bids from writers and choose one based on qualifications, history and feedback, then pay a deposit.
4. Review the completed paper and authorize final payment if pleased, or request revisions using free revision services.
5. Choose HelpWriting.net confidently knowing needs will be fully met, or receive a full refund if plagiarized.
1. A solution of imine (L3) was slowly added to a solution of palladium(II) chloride and lithium chloride in methanol.
2. The resulting solution was stirred at room temperature for 8 hours to form a yellow precipitate.
3. The precipitate was filtered, washed, dried under vacuum to obtain the final product [Pd(HL)2Cl2] (C3) in 87% yield.
Short Essay On Saving Money - Mbadissertation.WErin Torres
This document discusses virtual high school versus traditional high school. It notes that virtual high school offers more flexibility in class selection, a relaxed home setting, and the ability to learn at one's own pace. However, virtual high school also requires discipline, structure, and focus to be successful. The author chose to attend a virtual high school called Manhattan Virtual Academy because it better fit their learning needs and allowed them to take broader dual credit classes than traditional high schools they previously attended.
The document provides instructions for using the HelpWriting.net service to have papers written. It outlines a 5-step process: 1) Create an account; 2) Submit a request with instructions and deadline; 3) Review bids from writers and choose one; 4) Review the completed paper and authorize payment; 5) Request revisions if needed, knowing the company guarantees original, high-quality work or a refund.
How To Begin A Story About Your Life. How To WritErin Torres
The document provides a 5-step process for requesting writing assistance from HelpWriting.net:
1. Create an account with a password and email.
2. Complete a 10-minute order form providing instructions, sources, deadline, and attaching a sample if wanting the writer to imitate your style.
3. Review bids from writers and choose one based on qualifications, history, and feedback, then pay a deposit to start the assignment.
4. Ensure the completed paper meets expectations, and if so, authorize full payment to the writer. Revisions are free.
5. Multiple revisions are allowed to ensure satisfaction, and plagiarized work results in a full refund.
The document provides instructions for how to get writing assistance from HelpWriting.net. It outlines a 5-step process: 1) Create an account with a password and email; 2) Complete a 10-minute order form providing instructions, sources, and deadline; 3) Review bids from writers and choose one; 4) Review the completed paper and authorize payment if satisfied; 5) Request revisions to ensure satisfaction and get a refund if plagiarized.
The document provides steps for requesting and receiving writing assistance from HelpWriting.net. It outlines the registration process, how to submit a request including instructions and deadlines, how writers bid on requests and are selected, reviewing and authorizing payment for completed work, and the option for multiple revisions to ensure satisfaction. The service promises original, high-quality content and refunds for plagiarized work.
1. The document discusses the steps to get writing help from HelpWriting.net, including creating an account, submitting a request form, reviewing writer bids, authorizing payment, and requesting revisions.
2. Writers use a bidding system, and clients can choose a writer based on qualifications, history, and feedback.
3. HelpWriting.net promises original, high-quality content and offers refunds for plagiarized work.
009 Educational And Career Goals Essay Examples ExErin Torres
This document discusses different types of business entities, including sole proprietorships and general partnerships. A sole proprietorship is owned and run by one individual, with no legal separation between the business and owner. It has unlimited liability, with the owner's personal assets at risk for business debts. A general partnership has two or more owners who share profits and losses equally. It requires an assumed name certificate if the business name does not include all partner names.
Essay Help 4 Tips For Writing Anthropology Research PapErin Torres
This document provides tips for writing an anthropology research paper, including 5 steps: 1) Create an account on HelpWriting.net, 2) Complete an order form providing instructions, sources, and deadline, 3) Review bids from writers and choose one, 4) Ensure the paper meets expectations and authorize payment, 5) Request revisions until satisfied. It emphasizes obtaining original, high-quality content and standing by the promise to fully meet customer needs.
008 Self Introduction Essay Sample Help Groups EssaysErin Torres
St. Edward's University proposes a College Assistance Migrant Program to provide financial and academic support services to 22 business education majors who are migrant or seasonal farmworkers or children of farmworkers. The program aims to increase access, retention, and graduation rates for this underrepresented group. Services include assistance with tuition, books, housing, and other resources. Despite their significant work, most farmworkers receive little aid and lack benefits. The proposal aims to help students complete their degrees through supplemental financial and academic support.
Patriotic Writing Paper Printable - Pgbari.X.Fc2.ComErin Torres
Here are a few key points about Asians and Asian American culture:
- Asia is a massive continent with immense diversity across many countries and cultures. While there are some overarching themes, there is no single "Asian culture."
- Asian Americans trace their roots to many different Asian countries and cultures. The experience of being Asian American involves balancing cultural traditions from one's ancestry with life in American society.
- Stereotypes and overgeneralizations about Asians and Asian Americans are common but often fail to capture the richness and complexity of these groups. Greater understanding requires learning about specific cultures rather than relying on broad assumptions.
- Issues like immigration history, language barriers, racism, cultural assimilation versus preservation of heritage are all
50+ Comparison Contrast Essay Examples The LateErin Torres
The document discusses the methodology used in a thesis that examines grand corruption in Nigeria from an interpretivist perspective, using qualitative interviews and a review of primary and secondary sources. It outlines selecting 13 elite participants in Nigeria for interviews and discusses the structure of the 9-chapter thesis, which will include examining Nigeria's history with corruption and its current anti-corruption legal framework.
1. The document discusses a service called terminal services that allows multiple clients to access a server computer remotely. All processing occurs on the server, which the clients interact with like terminals.
2. Terminal services provides benefits like centralized application management, easier application deployment, improved performance for remote users, and support for older hardware as thin clients.
3. It can reduce costs through a single application installation, easier application updates, and use of inexpensive thin clients instead of upgrading older hardware for each user.
The document provides instructions for requesting essay writing help from the HelpWriting.net website. It outlines a 5-step process: 1) Create an account with an email and password. 2) Complete a 10-minute order form with instructions, sources, and deadline. 3) Review bids from writers and choose one based on qualifications. 4) Review the completed paper and authorize payment if satisfied. 5) Request revisions until fully satisfied, with a refund option for plagiarized work. The document also includes sample essay prompts and partial essay responses that can be accessed on the HelpWriting.net site.
Cheap Write My Essay Personal Statement For PeErin Torres
This document provides instructions for requesting essay writing help from HelpWriting.net. It outlines a 5-step process: 1) Create an account with a password and email. 2) Complete a order form with instructions, sources, and deadline. 3) Review bids from writers and choose one. 4) Review the completed paper and authorize payment. 5) Request revisions until satisfied with the paper. It emphasizes that original, high-quality work is guaranteed or a full refund will be provided.
Uc Personal Insight Questions Examples - SlidErin Torres
The document discusses the steps to get writing assistance from HelpWriting.net. It involves creating an account, completing a request form providing instructions and deadlines, and reviewing writer bids before choosing a writer and placing a deposit. The writer will then complete the paper and customers can request revisions until satisfied. HelpWriting.net promises original, high-quality work and refunds for plagiarized content.
The document discusses using phosphomannose isomerase (PMI) as a selectable marker gene for plant transformation. PMI allows the use of mannose as a carbon source, conferring an advantage for transformed cells. Commonly used antibiotic resistance markers are undesirable for commercial crops. PMI shows potential as an alternative selectable marker since it occurs naturally in some plants and mannose is non-toxic. Further research is needed to optimize PMI expression for reliable selection in more plant species.
IMPACT OF FORENSIC ACCOUNTING ON INDIAN INDUSTRYErin Torres
Forensic accounting investigates financial fraud and expert misconduct. It combines accounting, auditing and analytical skills. Forensic accountants communicate financial information clearly and concisely in court. Their work helps reduce financial crimes in India. However, forensic accounting faces challenges in India like a lack of qualified fraud examiners, difficulty pursuing cases against lawmakers, and keeping up with new fraud techniques using technology.
Main Java[All of the Base Concepts}.docxadhitya5119
This is part 1 of my Java Learning Journey. This Contains Custom methods, classes, constructors, packages, multithreading , try- catch block, finally block and more.
Introduction to AI for Nonprofits with Tapp NetworkTechSoup
Dive into the world of AI! Experts Jon Hill and Tareq Monaur will guide you through AI's role in enhancing nonprofit websites and basic marketing strategies, making it easy to understand and apply.
Executive Directors Chat Leveraging AI for Diversity, Equity, and InclusionTechSoup
Let’s explore the intersection of technology and equity in the final session of our DEI series. Discover how AI tools, like ChatGPT, can be used to support and enhance your nonprofit's DEI initiatives. Participants will gain insights into practical AI applications and get tips for leveraging technology to advance their DEI goals.
Thinking of getting a dog? Be aware that breeds like Pit Bulls, Rottweilers, and German Shepherds can be loyal and dangerous. Proper training and socialization are crucial to preventing aggressive behaviors. Ensure safety by understanding their needs and always supervising interactions. Stay safe, and enjoy your furry friends!
বাংলাদেশের অর্থনৈতিক সমীক্ষা ২০২৪ [Bangladesh Economic Review 2024 Bangla.pdf] কম্পিউটার , ট্যাব ও স্মার্ট ফোন ভার্সন সহ সম্পূর্ণ বাংলা ই-বুক বা pdf বই " সুচিপত্র ...বুকমার্ক মেনু 🔖 ও হাইপার লিংক মেনু 📝👆 যুক্ত ..
আমাদের সবার জন্য খুব খুব গুরুত্বপূর্ণ একটি বই ..বিসিএস, ব্যাংক, ইউনিভার্সিটি ভর্তি ও যে কোন প্রতিযোগিতা মূলক পরীক্ষার জন্য এর খুব ইম্পরট্যান্ট একটি বিষয় ...তাছাড়া বাংলাদেশের সাম্প্রতিক যে কোন ডাটা বা তথ্য এই বইতে পাবেন ...
তাই একজন নাগরিক হিসাবে এই তথ্য গুলো আপনার জানা প্রয়োজন ...।
বিসিএস ও ব্যাংক এর লিখিত পরীক্ষা ...+এছাড়া মাধ্যমিক ও উচ্চমাধ্যমিকের স্টুডেন্টদের জন্য অনেক কাজে আসবে ...
Physiology and chemistry of skin and pigmentation, hairs, scalp, lips and nail, Cleansing cream, Lotions, Face powders, Face packs, Lipsticks, Bath products, soaps and baby product,
Preparation and standardization of the following : Tonic, Bleaches, Dentifrices and Mouth washes & Tooth Pastes, Cosmetics for Nails.
How to Build a Module in Odoo 17 Using the Scaffold MethodCeline George
Odoo provides an option for creating a module by using a single line command. By using this command the user can make a whole structure of a module. It is very easy for a beginner to make a module. There is no need to make each file manually. This slide will show how to create a module using the scaffold method.
A review of the growth of the Israel Genealogy Research Association Database Collection for the last 12 months. Our collection is now passed the 3 million mark and still growing. See which archives have contributed the most. See the different types of records we have, and which years have had records added. You can also see what we have for the future.
it describes the bony anatomy including the femoral head , acetabulum, labrum . also discusses the capsule , ligaments . muscle that act on the hip joint and the range of motion are outlined. factors affecting hip joint stability and weight transmission through the joint are summarized.
2. Am. J. Appl. Sci3 (6): 1864-1871, 2006
1865
polynomial fitting and high order curve fitting
techniques have been developed to minimize errors in
determining the red edge position[4, 27]
. Through these
techniques, the Gaussian and high order curve fitting
techniques are more complex in implementation than
the Linear and Lagrangian techniques[27]
. The Linear
approach is computationally simple, robust, the most
practical and suitable method for extracting the REP
from hyperspectral data rather than other methods
because only four bands and a simple interpolation
computation are needed[35]
. On the other hand, the
Lagrangian interpolation which is based on derivative
analysis, estimates REP by using wavebands with no
equal-space requirement, minimizes interpolation errors
and soil background effects and computationally, it is
one of the simpler curve fitting techniques[36]
. Based on
these advantages of the two Linear and Lagrangian
methods, recently many applications have been
considered to these methods for estimating REP[4, 27, 37-
44]
. Therefore, in this analysis the objective is to study
the performance of Linear and Lagrangian approaches
for extracting the REP from HyMap data for estimating
different vegetation covers (types and ages), to compare
the two methods in detecting REP and to assess the
ability of hyperspectral remote sensing data to estimate
different vegetation covers based on the Linear and
Lagrangian REP.
STUDY AREA AND DATA SETS
Study area: The study area is located in the Thetford
Forest of Breckland, East Anglia. It is Britain’s largest
lowland pine forest area and occupies an area of
approximately 22,000 hectares. The forest area consists
mainly of planted and managed Corsican and Scots pine
of different age classes, and has a low relative relief.
Corsican pine is the most profitable and suitable conifer
for planting in much of lowland Britain particularly on
light soils in the East of the country. It grows quickly
and the combination of its straight trunks and light
branches produces good timber with few knots.
Corsican pine dominates Thetford Forest in East Anglia,
which is the largest man-made pine forest in Britain.
Timber from this pine is used in building, roofing,
flooring and interior framing.
The native Scots pine is also common in Britain.
Scots pine was planted as early as 1922 but has been
slowly replaced with Corsican pine due to the latter’s
higher yield, better timber and greater resistance to
disease. The Forestry Commission (UK) is the
government agency responsible for the management and
maintenance of British forests.
Hyperspectral data: The hyperspectral data used in
this study was acquired from the HyMap sensor for a
forested area in Thetford Forest, UK. The HyMap data
was acquired on 17 June 2000 as part of the BNSC-
NERC SHAC airborne campaign. This campaign aims
to support UK academic and industrial research and
application developments[45]
. The spatial resolution of
the data is 5 m. The spectral characteristics of the
HyMap data are shown in Table 1. The HyMap sensor
provides an excellent signal to noise ratio (>500:1) and
image quality that is setting the industry standard[46]
.
Table 1: The spectral characteristics of the HyMap sensor (Adapted
from HyVista, 2002[46]
)
Spectral configuration
Module Spectral range
Bandwidth
across module
Average spectral
sampling interval
VIS 0.45 – 0.89 m 15 – 16 nm 15 nm
NIR 0.89 – 1.35 m 15 – 16 nm 15 nm
SWIR1 1.40 – 1.80 m 15 – 16 nm 13 nm
SWIR2 1.95 – 2.48 m 18 – 20 nm 17 nm
Fig. 1: Ground reference image of the study area
Ground reference data: The ground reference data are
generated from the UK Forestry Commission’s GIS
vector data and stock map, which is a scanned image of
the digitized and vectorised ground reference data, is
presented in Fig. 1. There are several regions in the
ground reference data, which include seven different
vegetation covers such as old Scots pine (OCP), young
Scots pine (YSP), mature Corsican pine (MCP), young
Corsican pine (YCP), old Corsican pine (OCP),
broadleaved (BL) and grassland (GL).
MATERIALS AND METHODS
Linear interpolation technique: Guyot and Baret
(1988)[37]
have applied a simple linear model to the red
infrared slope. They used four wavelength bands,
centered at 670, 700, 740 and 780nm. Reflectance
measurements at 670nm and 780nm are used to estimate
the inflection point reflectance (Equation 1) and a linear
interpolation procedure is applied between 700nm and
740nm to estimate the wavelength of the inflection
point (Equation 2)[7]
2
780
670 R
R
RREP
+
= (1)
3. Am. J. Appl. Sci3 (6): 1864-1871, 2006
1866
−
−
×
−
+
=
700
740
700
700
740
700 )
(
R
R
R
RREP
REP λ
λ
λ
λ . (2)
For calculating red edge position of each pixel,
reflectance and wavelength of those bands, which have
closest wavelength values to the 670, 700, 740 and 780
nm, need to be extracted from the original image.
Calculation of REP for the selected pixel based on
Equations 1 and 2 are presented in the following, in
which the reflectance at the inflection point (RREP) is:
5
.
1192
2
2089
296
2
780
670
=
+
=
+
=
R
R
RREP
and wavelength of red edge )
( REP
λ corresponding to
the estimated reflectance value at the inflection point is:
−
−
×
−
+
=
700
740
700
700
740
700 )
(
R
R
R
RREP
REP λ
λ
λ
λ
9812
.
722
706
1677
706
5
.
1192
)
8
.
707
1
.
738
(
8
.
707 =
−
−
×
−
+
=
REP
λ
(nm).
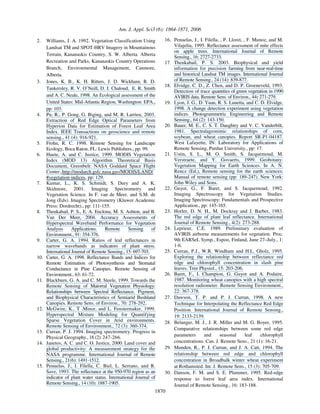
REP for the selected pixel which was calculated by
using the Linear method is represented on its zoomed
plot of spectral profile as shown in Fig. 2.
Fig. 2: REP for the selected pixel, which was
calculated by using the Linear method
Lagrangian interpolation technique: Another
technique for calculating REP in this study is the
Lagrangian technique, which is based on spectrum
derivative analysis, proposed by Dawson and Curran
(1998)[27]
. The advantage of derivative spectroscopy is
that it is relatively insensitive to variations in
illumination intensity, which may be caused by changes
in sun angle, cloud cover, topography and atmospheric
attenuation[43]
. When such factors are removed, any
differences observed are more likely to be due to leaf
chemical composition, leaf structure or water content[47]
.
Secondly, derivative spectroscopy can enhance smaller
peaks that are obscured by larger peaks due to noise[48]
and can be used to facilitate the location of key spectral
features such as the red edge and chlorophyll peak
reflectance[49]
.
The Lagrangian technique uses three points
interpolation for estimating REP. A second order
polynomial uses to fit the first derivative vegetation
reflectance spectrum and reflectance in three
wavebands, in which they are the bands with maximum
first derivative reflectance and two adjoining bands. The
derivative reflectance (DRREP) and wavelength ( REP) of
REP were calculated using equation (3) and (4)
respectively, i.e.,
)
(
1
1
1
1
)
1
(
1
1
1
1
)
)(
(
)
)(
(
)
)(
(
)
)(
(
i
i
i
i
i
i
i
i
i
i
i
i
i
i
REP D
D
DR λ
λ
λ
λ
λ
λ
λ
λ
λ
λ
λ
λ
λ
λ
λ
λ
λ
λ
+
−
+
−
−
+
−
−
+
−
−
−
−
+
−
−
−
−
=
)
1
(
1
1
1
1
)
)(
(
)
)(
(
+
+
−
+
−
−
−
−
−
+ i
i
i
i
i
i
i
Dλ
λ
λ
λ
λ
λ
λ
λ
λ (3)
)
(
2
)
(
)
(
)
( 1
1
1
1
C
B
A
C
B
A i
i
i
i
i
i
REP
+
+
+
+
+
+
+
= −
+
−
+ λ
λ
λ
λ
λ
λ
λ (4)
where
)
)(
( 1
1
1
)
1
(
+
−
−
−
−
−
=
i
i
i
i
i
D
A
λ
λ
λ
λ
λ
,
)
)(
( 1
1
)
(
+
− −
−
=
i
i
i
i
i
D
B
λ
λ
λ
λ
λ
and
)
)(
( 1
1
1
)
1
(
i
i
i
i
i
D
C
λ
λ
λ
λ
λ
−
−
=
+
−
+
+
(5)
and where D (i-1), D (i) and D (i+1) are the first derivative
reflectance values around the red edge position of the
maximum slope at wavelengths i-1, i and i+1
respectively. In this study, for each pixel, wavelength
and derivative reflectance of the maximum first
derivative (band 20) and the two adjoining bands 19 and
21 are extracted from first derivative of original
hyperspectral image. Then, the Lagrangian’s equations
applied to estimate red edge position of the selected
pixel, are shown as the following:
=
−
−
=
)
)(
( 21
19
20
19
)
19
(
λ
λ
λ
λ
λ
D
A 8688
.
0
)
1
.
738
8
.
707
)(
9
.
722
8
.
707
(
5
.
397
=
−
−
,
=
−
−
=
)
)(
( 21
20
19
20
)
20
(
λ
λ
λ
λ
λ
D
B
1153
.
2
)
1
.
738
9
.
722
)(
8
.
707
9
.
722
(
5
.
485
−
=
−
−
and
=
−
−
=
)
)(
( 20
21
19
21
)
21
(
λ
λ
λ
λ
λ
D
C
8055
.
0
)
9
.
722
1
.
738
)(
8
.
707
1
.
738
(
371
=
−
−
.
Based on Equation 4, the wavelength value of REP
( REP) is calculated as:
Reflectance
Value
4. Am. J. Appl. Sci3 (6): 1864-1871, 2006
1867
)
(
2
)
(
)
(
)
( 20
19
21
19
21
20
C
B
A
C
B
A
REP
+
+
+
+
+
+
+
=
λ
λ
λ
λ
λ
λ
λ
+
+
−
+
= )
1
.
738
8
.
707
(
1153
.
2
)
1
.
738
9
.
722
(
8688
.
0
[
+
−
+ )]
8055
.
0
1153
.
2
8688
.
0
(
2
/[
)]
8
.
722
8
.
707
(
8055
.
0
721.9583
=
REP
λ (nm)
and derivative reflectance value of REP (DRREP) is
calculated as:
)
19
(
21
19
20
19
21
20
)
)(
(
)
)(
(
λ
λ
λ
λ
λ
λ
λ
λ
λ
D
DRREP
−
−
−
−
=
)
20
(
21
20
19
20
21
19
)
)(
(
)
)(
(
λ
λ
λ
λ
λ
λ
λ
λ
λ
D
−
−
−
−
+
)
21
(
20
21
19
21
20
19
)
)(
(
)
)(
(
λ
λ
λ
λ
λ
λ
λ
λ
λ
D
−
−
−
−
+
×
−
−
−
−
= 5
.
397
)
1
.
738
8
.
707
)(
9
.
722
8
.
707
(
)
1
.
738
9583
.
721
)(
9
.
722
9583
.
721
(
REP
DR
×
−
−
−
−
+ 5
.
485
)
1
.
738
9
.
722
)(
8
.
707
9
.
722
(
)
1
.
738
9583
.
721
)(
8
.
707
9583
.
721
(
×
−
−
−
−
+ 371
)
9
.
722
1
.
738
)(
8
.
707
1
.
738
(
)
9
.
722
9583
.
721
)(
8
.
707
9583
.
721
(
485.8910
= .
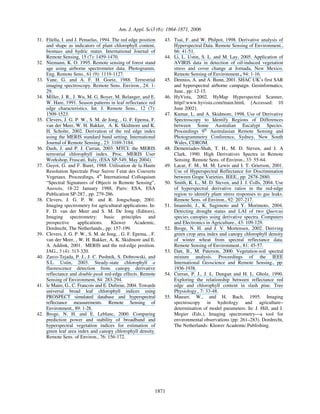
The calculated REP based on the Lagrangian
interpolation technique is shown in Fig. 3, in which the
horizontal and vertical axes represent wavelength (nm)
and first derivative reflectance respectively. The Matlab
software is used to create and plot the interpolation
curve.
RESULTS AND ANALYSIS
Performance of the Linear interpolation method: For
classifying different vegetation covers, 139 test pixels
are extracted from the 7 different vegetation covers of
the original hyperspectral data. The REPs of these
pixels are calculated based on the Linear method as
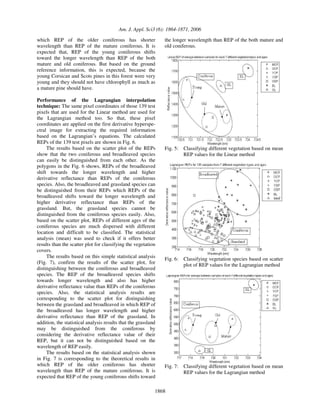
shown in Fig. 4.
The results based on the scatter plot of the REPs
show that the two coniferous and broadleaved species
can easily be distinguished from each other as shown in
Fig. 4. REPs of the broadleaved shift towards the longer
wavelength and higher reflectance than REPs of the
coniferous species. Based on REPs of the GL species in
the scatter plot, this species cannot be distinguished
from the two other species easily. Also, based on the
scatter plot, REPs of different ages of the coniferous
species are much dispersed with different location,
therefore it is difficult to classify them. The statistical
analysis (mean) was used to check if it offers better
results than the scatter plot for classifying the vegetation
covers.
650 700 721.9583 750 800
0
100
200
300
400
485.891
600
Wavelength (nm)
First
derivative
reflectance
value
Lagrangian interpolation technique to determine the red edge position
REP
Fig. 3: The Lagrangian interpolation technique to
estimate REP of the selected pixel
Fig. 4: Classifying vegetation species based on scatter
plot of REP values for the Linear method
The results based on this simple statistical analysis
confirm the results of the scatter plot for distinguishing
between the coniferous and broadleaved species in
which REP of the broadleaved species shifts towards
longer wavelength and also has higher reflectance value
than REPs of the coniferous species. The statistical
analysis in Fig. 5 shows that distinguishing between
grassland and broadleaved can also be done easily as
REP of the broadleaved has longer wavelength and
higher reflectance than REP of the grassland. But this
classification parameters cannot easily be used to
distinguish between grassland and coniferous.
For classifying the coniferous species based on
their age, in this study they are classified into three
groups of ages as young, mature and old. For classifying
ages of plants, the theoretical study shows that, when
plants have higher chlorophyll content and LAI
(young), the REP shifts toward the longer wavelengths;
when plants have low chlorophyll content and LAI
(old), the REP shifts toward the shorter wavelengths[4]
.
The results based on the statistical analysis as shown in
Fig. 5 is corresponding to the theoretical results in
5. Am. J. Appl. Sci3 (6): 1864-1871, 2006
1868
which REP of the older coniferous has shorter
wavelength than REP of the mature coniferous. It is
expected that, REP of the young coniferous shifts
toward the longer wavelength than REP of the both
mature and old coniferous. But based on the ground
reference information, this is expected, because the
young Corsican and Scots pines in this forest were very
young and they should not have chlorophyll as much as
a mature pine should have.
Performance of the Lagrangian interpolation
technique: The same pixel coordinates of those 139 test
pixels that are used for the Linear method are used for
the Lagrangian method too. So that, these pixel
coordinates are applied on the first derivative hyperspe-
ctral image for extracting the required information
based on the Lagrangian’s equations. The calculated
REPs of the 139 test pixels are shown in Fig. 6.
The results based on the scatter plot of the REPs
show that the two coniferous and broadleaved species
can easily be distinguished from each other. As the
polygons in the Fig. 6 shows, REPs of the broadleaved
shift towards the longer wavelength and higher
derivative reflectance than REPs of the coniferous
species. Also, the broadleaved and grassland species can
be distinguished from their REPs which REPs of the
broadleaved shifts toward the longer wavelength and
higher derivative reflectance than REPs of the
grassland. But, the grassland species cannot be
distinguished from the coniferous species easily. Also,
based on the scatter plot, REPs of different ages of the
coniferous species are much dispersed with different
location and difficult to be classified. The statistical
analysis (mean) was used to check if it offers better
results than the scatter plot for classifying the vegetation
covers.
The results based on this simple statistical analysis
(Fig. 7), confirm the results of the scatter plot, for
distinguishing between the coniferous and broadleaved
species. The REP of the broadleaved species shifts
towards longer wavelength and also has higher
derivative reflectance value than REPs of the coniferous
species. Also, the statistical analysis results are
corresponding to the scatter plot for distinguishing
between the grassland and broadleaved in which REP of
the broadleaved has longer wavelength and higher
derivative reflectance than REP of the grassland. In
addition, the statistical analysis results that the grassland
may be distinguished from the coniferous by
considering the derivative reflectance value of their
REP, but it can not be distinguished based on the
wavelength of REP easily.
The results based on the statistical analysis shown
in Fig. 7 is corresponding to the theoretical results in
which REP of the older coniferous has shorter
wavelength than REP of the mature coniferous. It is
expected that REP of the young coniferous shifts toward
the longer wavelength than REP of the both mature and
old coniferous.
Fig. 5: Classifying different vegetation based on mean
REP values for the Linear method
Fig. 6: Classifying vegetation species based on scatter
plot of REP values for the Lagrangian method
Fig. 7: Classifying different vegetation based on mean
REP values for the Lagrangian method
6. Am. J. Appl. Sci3 (6): 1864-1871, 2006
1869
Table 2: A summary of the advantages and attributes of the two interpolation techniques for determining the REP
Methods Implementation
Required spectral
type
Suitability for canopy
spectra
Red edge detection
Minimizing soil background
effects
Linear
Lagrangian
Easy
Moderate
Reflectance
Derivative
Yes
Yes
Good
Good
Low
High
Comparison of the Linear and Lagrangian
interpolation techniques: For having a better
comparison between the two methods to estimate REP,
the mean values of the REPs for the two methods are
represented together in Fig. 8. It shows that, there is
similarity between the both methods for estimating the
REPs of different vegetation covers, which wavelength
of the young, old and mature coniferous and broadleav-
ed species are distributed from the shorter to longer
wavelength in both methods respectively. Based on the
statistical analysis results, both the Lagrangian and
Linear methods generate similar results for estimating
REP of the coniferous and broadleaved species and
different results for estimating REP of the grassland.
As the REP of the grassland in the Lagrangian
method goes towards shorter wavelength and lower
reflectance than the Linear method, it can be concluded
that the Lagrangian approach offers more accurate
results than the Linear method in estimating grassland,
because the derivative approaches (Lagrangian
technique) minimizes the soil background reflectance
effects[27, 50-55]
. In classifying different ages of conifer-
ous species, both methods offer the same results in
extracting REP for different ages of coniferous species.
A summary of the attributes of the two methods is
presented in Table 2. The differences between these two
methods based on the computation are that the Linear
method can be done easily as it only requires four
bands. Implementation of the Lagrangian technique
needs more computation time and if the first derivative
spectra are available, we can simply take three bands
containing the maximum first derivative reflectance
value to determine REP. However, if the first derivative
spectra are not available (for example, multispectral
remote sensing data with very small number of bands),
this method cannot be used.
Fig. 8: Comparison of the mean REP values of the
Linear and Lagrangian methods
CONCLUSION
139 test pixels from the HyMap were selected to
extract REP using the two Linear and Lagrangian
approaches for the goal of classifying vegetation
species. The statistical analysis is applied to calculate
the mean value of the REP for both methods. The
statistical results show that, both the Linear and
Lagrangian approaches generated similar results in
extracting REP for the coniferous and the broadleaved
species. They also offer similar results in estimating
REP of different ages of coniferous species. But there
are some differences between the two approaches in
estimating REP of the grassland in which the
Lagrangian technique generate more accurate results
than the Linear method because of its less sensitivity to
the soil background reflectance effects.
Comparison of the ground reference map and the
REP of the test data suggested some degree of success
in discriminating the broadleaved and coniferous trees.
Based on the statistical results of both the Linear and
Lagrangian methods, the broadleaved trees can be
distinguished from the coniferous tress by considering
their REP, in which REP of the broadleaved trees shift
toward the longer wavelength and of higher reflectance
than REP of the coniferous trees. Another successful
result which had been obtained by comparison with the
ground reference image is that different ages of the
coniferous trees can be distinguished easily by
considering the wavelength of their REP. The REP of
the younger trees shift towards longer wavelength and
REP of the older trees shift towards the shorter
wavelength. The above results demonstrate the potential
application of hyperspectral remote sensing and red
edge position analysis for detecting different vegetation
types and ages in a forested area.
ACKNOWLEDGMENT
We would like to thank Universiti Putra Malaysia
(UPM) for the financial support in completing this
research.
REFERENCES
1. Jensen, J.R, 2000. Remote sensing of the
environment: an earth resource perspective. Prentice
Hall series in geographic information science, USA,
Chap.1 and 10, pp: 1-28 and 333-377.
7. Am. J. Appl. Sci3 (6): 1864-1871, 2006
1870
2. Williams, J. A. 1992. Vegetation Classification Using
Landsat TM and SPOT-HRV Imagery in Mountainous
Terrain, Kananaskis Country, S. W. Alberta. Alberta
Recreation and Parks, Kananaskis Country Operations
Branch, Environmental Management, Canmore,
Alberta.
3. Jones, K. B., K. H. Ritters, J. D. Wickham, R. D.
Tankersley, R. V. O’Neill, D. J. Chaloud, E. R. Smith
and A. C. Neale, 1998. An Ecological assessment of the
United States: Mid-Atlantic Region, Washington: EPA.,
pp: 103.
4. Pu, R., P. Gong, G. Biging, and M. R. Larrieu, 2003.
Extraction of Red Edge Optical Parameters from
Hyperion Data for Estimation of Forest Leaf Area
Index. IEEE Transactions on geoscience and remote
sensing., 41 (4): 916-921.
5. Frohn, R. C. 1998. Remote Sensing for Landscape
Ecology, Boca Raton, FL: Lewis Publishers., pp: 99.
6. Huete, A. and C. Justice, 1999. MODIS Vegetation
Index (MOD 13) Algorithm Theoretical Basis
Document, Greenbelt: NASA Goddard Space Flight
Center.,http://modarch.gsfc.nasa.gav/MODIS/LAND/
#vegetation-indices, pp: 129.
7. Kumar, L., K. S. Schmidt, S. Dury and A. K.
Skidmore, 2001. Imaging Spectrometry and
Vegetation Science. In F. van de Meer. and S.M. de
Jong (Eds). Imaging Spectrometry (Kluwer Academic
Press: Dordrecht)., pp: 111-155.
8. Thenkabail, P. S., E. A. Enclona, M. S. Ashton, and B.
Van Der Meer, 2004. Accuracy Assessments of
Hyperspectral Waveband Performance for Vegetation
Analysis Applications. Remote Sensing of
Environment., 91: 354-376.
9. Carter, G. A. 1994. Ratios of leaf reflectances in
narrow wavebands as indicators of plant stress.
International Journal of Remote Sensing., 15: 697-703.
10. Carter, G. A. 1998. Reflectance Bands and Indices for
Remote Estimation of Photosynthesis and Stomatal
Conductance in Pine Canopies. Remote Sensing of
Environment., 63: 61-72.
11. Blackburn, G. A. and C. M. Steele, 1999. Towards the
Remote Sensing of Matorral Vegetation Physiology:
Relationships between Spectral Reflectance, Pigment,
and Biophysical Characteristics of Semiarid Bushland
Canopies. Remote Sens. of Environ., 70: 278-292.
12. McGwire, K., T .Minor, and L. Fenstermaker, 1999.
Hyperspectral Mixture Modeling for Quantifying
Sparse Vegetation Cover in Arid environments.
Remote Sensing of Environment., 72 (3): 360-374.
13. Curran, P. J. 1994. Imaging spectrometry. Progress in
Physical Geography., 18 (2): 247-266.
14. Janetos, A. C. and C. O. Justice, 2000. Land cover and
global productivity: A measurement strategy for the
NASA programme. International Journal of Remote
Sensing., 21(6): 1491-1512.
15. Penuelas, J., I. Filella, C. Biel, L. Serrano, and R.
Save, 1993. The reflectance at the 950-970 region as an
indicator of plant water status. International Journal of
Remote Sensing., 14 (10): 1887-1905.
16. Penuelas, J., I. Filella, , P. Lloret, , F. Munoz, and M.
Vilajeliu, 1995. Reflectance assessment of mite effects
on apple trees. International Journal of Remote
Sensing., 16: 2727-2733.
17. Thenkabail, P. S. 2003. Biophysical and yield
information for precision farming from near-real-time
and historical Landsat TM images. International Journal
of Remote Sensing., 24 (14): 839-877.
18. Elvidge, C. D., Z. Chen, and D. P. Groeneveld, 1993.
Detection of trace quantities of green vegetation in 1990
AVIRIS data. Remote Sens. of Environ., 44: 271-279.
19. Lyon, J. G., D. Yuan, R. S. Lunetta, and C. D. Elvidge,
1998. A change detection experiment using vegetation
indices. Photogrammetric Engineering and Remote
Sensing., 64 (2): 143-150.
20. Bauer, M. E., C. S. T. Daughtry and V. C. Vanderbilt,
1981. Spectralagronimic relationships of corn,
soybean, and wheat canopies. Report SR-P1-04187.
West Lafayette, IN: Laboratory for Applications of
Remote Sensing, Purdue University., pp: 17.
21. Ustin, S. L., M. O. Smith, S. Jacquemoud, M.
Verstraete, and Y. Govaerts, 1999. Geobotany:
Vegetation Mapping for Earth Sciences. In A. N.
Rencz (Ed.), Remote sensing for the earth sciences:
Manual of remote sensing (pp: 189-247). New York:
John Wiley and Sons.
22. Guyot, G., F. Baret, and S. Jacquemoud, 1992.
Imaging Spectroscopy for Vegetation Studies.
Imaging Spectroscopy: Fundamentals and Prospective
Application., pp: 145-165.
23. Horler, D. N. H., M. Dockray and J. Barber, 1983.
The red edge of plant leaf reflectance. International
Journal of Remote Sensing., 4(2): 273-288.
24. Leprieur, C.E. 1989. Preliminary evaluation of
AVIRIS airborne measurements for vegetation. Proc.
9th EARSeL Symp., Espoo, Finland, June 27–July., 1:
1-6.
25. Curran, P.J., W.R. Windham and H.L. Gholz, 1995.
Exploring the relationship between reflectance red
edge and chlorophyll concentration in slash pine
leaves. Tree Physiol., 15: 203-206.
26. Baret, F., I. Champion, G. Guyot and A. Podaire,
1987. Monitoring wheat canopies with a high spectral
resolution radiometer. Remote Sensing Environment.,
22: 367-378.
27. Dawson, T. P. and P. J. Curran, 1998. A new
Technique for Interpolating the Reflectance Red Edge
Position. International Journal of Remote Sensing.,
19: 2133-2139.
28. Belanger, M. J., J. R. Miller and M. G. Boyer, 1995.
Comparative relationships between some red edge
parameters and seasonal leaf chlorophyll
concentrations. Can. J. Remote Sens., 21 (1): 16-21.
29. Munden, R., P. J. Curran, and J. A. Catt, 1994. The
relationship between red edge and chlorophyll
concentration in Broadbalk winter wheat experiment
at Rothamsted. Int. J. Remote Sens., 15 (3): 705-709.
30. Danson, F. M. and S. E. Plummer, 1995. Red-edge
response to forest leaf area index. International
Journal of Remote Sensing., 16: 183-188.
8. Am. J. Appl. Sci3 (6): 1864-1871, 2006
1871
31. Filella, I. and J. Penuelas, 1994. The red edge position
and shape as indicators of plant chlorophyll content,
biomass and hydric status. International Journal of
Remote Sensing, 15 (7): 1459-1470.
32. Niemann, K. O. 1995. Remote sensing of forest stand
age using airborne spectrometer data. Photogramm.
Eng. Remote Sens., 61 (9): 1119-1127.
33. Vane, G. and A. F. H. Goetz, 1988. Terrestrial
imaging spectroscopy. Remote Sens. Environ., 24: 1-
29.
34. Miller, J. R., J. Wu, M. G. Boyer, M. Belanger, and E.
W. Hare, 1991. Season patterns in leaf reflectance red
edge characteristics. Int. J. Remote Sens., 12 (7):
1509-1523.
35. Clevers, J. G. P. W., S. M. de Jong, , G. F. Epema, F.
van der Meer, W. H. Bakker, A. K. Skidmore and K.
H. Scholte, 2002. Derivation of the red edge index
using the MERIS standard band setting. International
Journal of Remote Sensing., 23: 3169-3184.
36. Dash, J. and P. J. Curran, 2003. MTCI: the MERIS
terrestrial chlorophyll index. Proc. MERIS User
Workshop, Frascati, Italy, (ESA SP-549, May 2004).
37. Guyot, G. and F. Baret, 1988. Utilisation de la Haute
Resolution Spectrale Pour Suivre I’etat des Couverts
Vegetaux. Proceedings, 4th
International Colloquium
“Spectral Signatures of Objects in Remote Sensing”,
Aussois, 18-22 January 1988, Paris: ESA, ESA
Publication SP-287., pp: 279-286.
38. Clevers, J. G. P. W. and R. Jongschaap, 2001.
Imaging spectrometry for agricultural applications. In:
F. D. van der Meer and S. M. De Jong (Editors),
Imaging spectrometry: basic principles and
prospective applications. Kluwer Academic,
Dordrecht, The Netherlands., pp: 157-199.
39. Clevers, J. G. P. W., S. M. de Jong, , G. F. Epema, , F.
van der Meer, , W. H. Bakker, A. K. Skidmore and E.
A. Addink, 2001. MERIS and the red-edge position.
JAG., 3 (4): 313-320.
40. Zarco-Tejada, P. J., J. C. Pushnik, S. Dobrowski, and
S.L. Ustin, 2003. Steady-state chlorophyll a
fluorescence detection from canopy derivative
reflectance and double-peak red-edge effects. Remote
Sensing of Environment, 84: 283-294.
41. le Maire, G., C. Francois and E. Dufrene, 2004. Towards
universal broad leaf chlorophyll indices using
PROSPECT simulated database and hyperspectral
reflectance measurements. Remote Sensing of
Environment., 89: 1-28.
42. Broge, N. H. and E. Leblanc, 2000. Comparing
prediction power and stability of broadband and
hyperspectral vegetation indices for estimation of
green leaf area index and canopy chlorophyll density.
Remote Sens. of Environ., 76: 156-172.
43. Tsai, F. and W. Philpot, 1998. Derivative analysis of
Hyperspectral Data. Remote Sensing of Environment.,
66: 41-51.
44. Li, L. Ustin, S. L. and M. Lay, 2005. Application of
AVIRIS data in detection of oil-induced vegetation
stress and cover change at Jornada, New Mexico.
Remote Sensing of Environment., 94: 1-16.
45. Denniss, A. and A. Bunn, 2001. SHAC UK’s first SAR
and hyperspectral airborne campaign. Geoinformatics,
June., pp: 12-15.
46. HyVista, 2002. HyMap Hyperspectral Scanner,
http//:www.hyvista.com/main.html, {Accessed: 10
June 2002}.
47. Kumar, L. and A. Skidmore, 1998. Use of Derivative
Spectroscopy to Identify Regions of Differences
between Some Australian Eucalypt Species.
Proceedings 9th
Australasian Remote Sensing and
Photogrammetry Conference, Sydney, New South
Wales, CDROM.
48. Demetriades-Shah, T. H., M. D. Steven, and J. A
Clark, 1990. High Derivatives Spectra in Remote
Sensing. Remote Sens. of Environ., 33: 55-64.
49. Lacar, F. M., M. M. Lewis and I. T. Grierson, 2001.
Use of Hyperspectral Reflectance for Discrimination
between Grape Varieties. IEEE., pp: 2878-2880.
50. Smith, K. L., M. D. Steven, and J. J. Colls, 2004. Use
of hyperspectral derivative ratios in the red-edge
region to identify plant stress responses to gas leaks.
Remote Sens. of Environ., 92: 207-217.
51. Imanishi, J., K. Sugimoto and Y. Morimoto, 2004.
Detecting drought status and LAI of two Quercus
species canopies using derivative spectra. Computers
and Electronics in Agriculture., 43: 109-129.
52. Broge, N. H. and J. V. Mortensen, 2002. Deriving
green crop area index and canopy chlorophyll density
of winter wheat from spectral reflectance data.
Remote Sensing of Environment., 81: 45-57.
53. Datt, B., M. Paterson, 2000. Vegetation-soil spectral
mixture analysis. Proceedings of the IEEE
International Geoscience and Remote Sensing., pp:
1936-1938.
54. Curran, P. J., J. L. Dungan and H. L. Gholz, 1990.
Exploring the relationship between reflectance red
edge and chlorophyll content in slash pine. Tree
Physiology., 7: 33-48.
55. Mauser, W., and H. Bach, 1995. Imaging
spectroscopy in hydrology and agriculture–
determination of model parameters. In: J. Hill, and J.
Megier (Eds.), Imaging spectrometry—a tool for
environmental observations (pp: 261–283). Dordrecht,
The Netherlands: Kluwer Academic Publishing.