Download to read offline
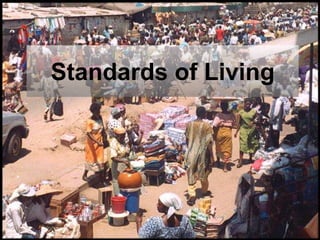
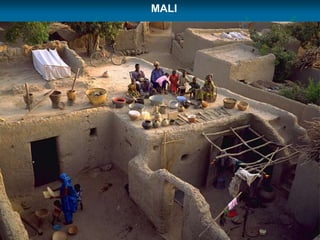
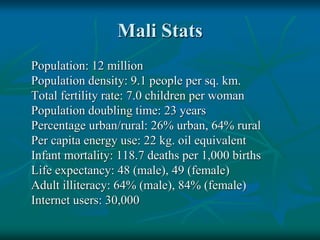
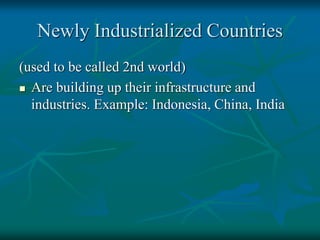
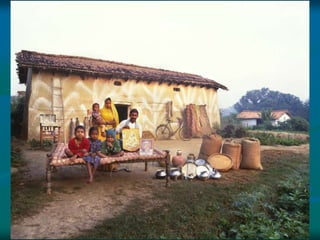
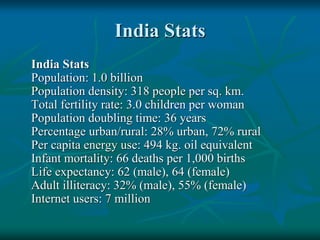

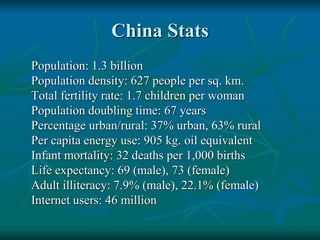
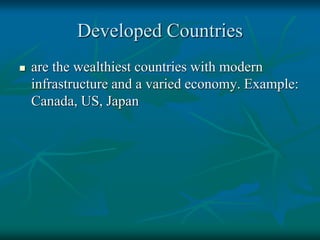

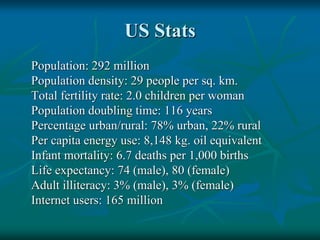
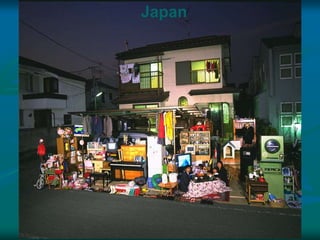
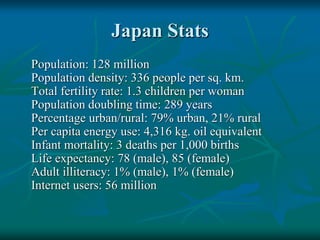
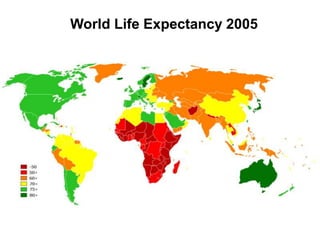
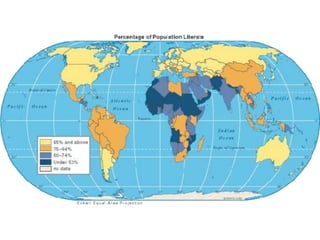
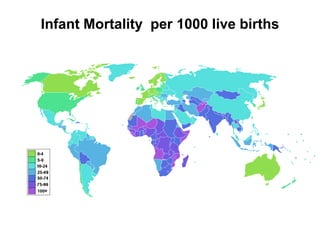
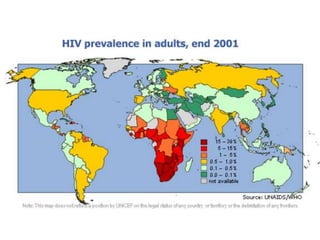
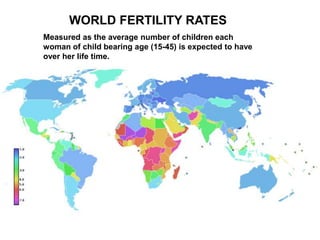
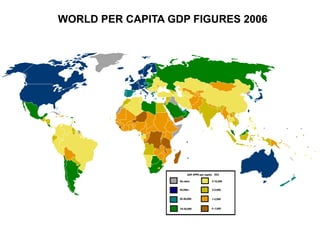


The document discusses standards of living and key indicators used to measure human development such as GDP, life expectancy, and literacy rates. It compares standards of living in developing countries like Mali, newly industrialized countries like India and China, and developed countries like the US and Japan. Developing countries have low infrastructure and rely on cash crops or commodities, while newly industrialized countries are building infrastructure and industries. The document also examines causes of poverty in developing countries such as debt, lack of education, and infectious diseases, as well as responses like debt relief, international aid, and work by organizations like UNICEF and WHO.