SlideShare a Scribd company logo
1 of 18
Download to read offline
HYDROLOGICAL PROCESSES
Hydrol. Process. 16, 1047–1064 (2002)
Published online 10 January 2002 in Wiley InterScience (www.interscience.wiley.com). DOI: 10.1002/hyp.345
Heuristic numerical and analytical models of the
hydrologic controls over vertical solute transport in a
domed peat bog, Jura Mountains, Switzerland
Jeffrey M. McKenzie,1
* Donald I. Siegel,1
William Shotyk,2
Philipp Steinmann3
and
Gabriele Pfunder4
1 Department of Earth Sciences, Syracuse University, Syracuse, NY 13244, USA
2 Geological Institute, University of Bern, CH-3012 Bern, Switzerland
3 Geological Institute, University of Neuchˆatel, CH-2007 Neuchˆatel, Switzerland
4 Department of Vegetation Ecology and Conservation Ecology, Institute of Plant Physiology, University of Vienna, A-1091 Vienna, Austria
Abstract:
We report the results of numerical and analytical simulations to test the hypothesis that downward vertical flow of
porewater from the crests of domed alpine and kettle bogs controls vertical porewater distributions of major solutes
such as Ca and Mg. The domed Etang de la Gru`ere bog (EGr), Switzerland, characterized by a vertical downward
gradient of 0Ð04 and stratified layers of peat, is chosen as a field site for the model calibration and evaluation. The
middle 4-m section of the 6Ð5 m thick bog peat is heavily humified and has a hydraulic conductivity of ¾10 5Ð6
cm s 1
.
Above and below, peat is less humified with a hydraulic conductivity of ¾10 3
cm s 1
. Heuristic finite difference
simulations, using Visual MODFLOW, of the bog hydraulics show that the higher conductivity peat at the bog base
is critical to create the observed deep, local flow cells that substantively recharge porewater.
Model results and Peclet number calculations show that before ¾7000 14
C yr BP diffusion of solutes from underlying
mineral soils controlled the vertical distribution of porewater chemistry. From 7000 to ¾1250 14
C BP the porewater
chemistry was probably controlled by both upward diffusion and downward advection, and after ¾1250 14
C yr BP
porewater chemistry was probably controlled by downward advection. Concentrations of conservative major solutes
in the porewaters of alpine, ombrotrophic bogs are the net effect of both downward vertical porewater movement and
upward vertical diffusion, the magnitudes of which are delicately poised to the configuration of the bog water table
over time and subsurface peat stratigraphy. Copyright  2002 John Wiley & Sons, Ltd.
KEY WORDS hydrology; peat; domed bog; solute transport; diffusion; Jura Mountains; Switzerland; numerical
modelling; peclet number
INTRODUCTION
Chemical diffusion and groundwater advection are the two major processes that move water and solutes
vertically in peatland soils. The extent to which these processes control solute transport in peatlands
depends both on the material properties of the peat and the evolving hydrogeologic setting of the wetland.
In this paper, we heuristically explore the interplay between diffusion and advection on the vertical
transport of solutes in raised bogs, a major wetland ecosystem type found in expansive circumboreal
peatlands, in former glacial kettle lakes, and in other moraine and alpine depressions (Mitsch and Gosslink,
2000).
Raised bogs are wetlands where peat soil accumulates to form a distinct dome-like shape, rising above
surrounding mineral soils or other wetland landforms (Clymo, 1983; Ingram, 1983; Roulet, 1990; Siegel,
1981, 1983). Raised bogs are acidic environments that mostly obtain their water from precipitation. The acid
* Correspondence to: J. M. McKenzie, Department of Earth Sciences, 204 Heroy Geology Laboratory, Syracuse University, Syracuse,
NY 13244, USA. E-mail: jmmckenz@syr.edu
Received 27 June 2000
Copyright  2002 John Wiley & Sons, Ltd. Accepted 21 February 2001
1048 J. M. McKENZIE ET AL.
conditions of raised bog surface waters evolve mostly from the dissociation of organic acids in porewater
and Sphagnum (Shotyk, 1988; Steinmann and Shotyk, 1997a). Raised bogs are important repositories for
long-term atmospheric data on anthropogenic change (Shotyk et al., 1998), and their subsurface hydrology
is an ideal setting to address the question: under what hydrologic conditions does chemical diffusion or
advection control vertical solute transport in peat? Raised bogs are ideal settings to address this question
because their morphology changes with time from relatively flat fens that are later covered by domed bog
peat. Fens are circumneutral ecological communities that receive most of their solutes from groundwater
discharge and first colonize most wetland settings. Fens gradually develop a groundwater mound which leads
to downward advective flow of water in peat near the land surface, deflecting previous upward groundwater
motion (McNamara et al., 1992).
The Dupuit–Forcheimer approach, often used to model porewater flow in domed bogs (Armstrong, 1995;
Hilbert et al., 2000; Ingram, 1982; Winston, 1994), assumes that the groundwater flow is horizontal, the
hydraulic gradient is equal to the slope of the water table, and the vertical hydraulic gradient is zero.
However, this approach has been challenged as inexact because it does not incorporate downward recharge
of porewater that theoretically occurs whenever the water table forms a mound, such as is found under raised
bogs (e.g. Siegel, 1981, 1983). For example, field studies on the hydrogeology and geochemistry of large
(several kilometre in diameter) raised bogs in the vast mire of the Glacial Lake Agassiz Peatlands, northern
Minnesota, USA, have confirmed that porewater moves vertically downward and sometimes upward at bog
crests, potentially flushing the bog peat columns within a decade under appropriate climatic conditions (Glaser
et al., 1997; Siegel et al., 1995).
Knowing how dissolved solids, dissolved gases and trace metals move vertically through peat is important
to understand the complexity of nutrient, carbon and other cycles and the controls over the ecological changes
in wetlands (Glaser et al., 1997; Price and Woo, 1990; Waddington and Roulet, 1997). Although vertical
porewater flow clearly occurs under bogs in the Glacial Lake Agassiz Peatlands, similar studies are scant
for the more common raised bogs found in alpine kettle lake settings in glaciated regions. McNamara et al.
(1992) heuristically modelled the advective reversal from upward to downward flow under the crest of a raised
bog (New York, USA) that evolved in a groundwater discharge zone. There, groundwater seeps continue to
discharge from the steep proximate mineral soil outcrops that surround the bog, while under the bog, advective
flow is downward deep into the peat.
We present the results of a study designed to extend the heuristic modelling approach developed by
McNamara et al. (1992) to groundwater flow and solute transport at raised bogs not underlain by pervasive
groundwater discharge zones. Instead we focus our study on raised bogs that formed in flatter areas under
conditions where diffusive transport of solutes upward from mineral soils will first predominate, as opposed
to advective transport. We specifically test the hypothesis that diffusive upward transport ultimately changes
to net advective downward flux as the water table mounds in bogs grow, and that the time when this transition
occurred in the history of the bog can be heuristically estimated, if not exactly determined. We further explore
the manner by which changes in peat material properties may affect when the transition from diffusive to
advective transport occurs.
Numerical and solute transport models may not accurately predict water and chemical mass movement
in peatlands or any other hydrogeologic setting in detail, because of uncertainties in low flow veloci-
ties, evolving surface morphology and boundary conditions with time, and spatial distributions of mate-
rial properties such as hydraulic conductivity (Schulze-Makuch et al., 1999; Bredehoeft and Konikow,
1993; Konikow et al., 1992; Oreskes et al., 1994; Oreskes, 2000). Flow and transport models, how-
ever, have and are being extensively used to heuristically determine the fundamental controls over
physical and chemical processes operating in hydrogeologic systems. These models, designed as learn-
ing tools rather than predictive devices, have led to new conceptual paradigms for the hydrogeol-
ogy of many settings, notably wetlands (e.g. Winter, 1978; Siegel, 1993; Ingram, 1982; Reeve et al.,
2000).
Copyright  2002 John Wiley & Sons, Ltd. Hydrol. Process. 16, 1047–1064 (2002)
SOLUTE TRANSPORT IN PEAT 1049
STUDY AREA
We chose to heuristically model the hydrogeologic evolution and solute transport mechanisms at the Etang de
la Gru`ere (EGr) bog, located near the crest of a glacially eroded anticline in the Jura Mountains, Switzerland
(Figure 1) and for which there are excellent profiles of porewater chemical composition (Steinmann and
Shotyk, 1997a; Shotyk, 1996). The bog is 1005 m above sea level, receives 1300 mm of precipitation each
year and has an average annual temperature of 5Ð5 °C.
The bog is 22Ð5 ha, and is partially surrounded by a shallow artificial lake. The diameter of the bog is
300 m, and peat thickness increases from 2Ð5 m at the bog edge to 6Ð5 m at the bog centre (Joray, 1942;
Steinmann and Shotyk, 1997a). The aspect ratio (the bog height divided by diameter) is 0Ð01, compared to
0Ð005 to 0Ð01 for large raised bogs with 1000 mm of precipitation per year (Hobbs, 1986).
The EGr bog overlies siliceous clay underlain by a calcareous, karstic plateau, eroded at the anticline crest.
The siliceous clay sediments consist of ¾40% clay, ¾40% quartz, as well as small amounts of plagioclase,
K-feldspar and carbonates (<5% each) (Steinmann and Shotyk, 1997b). The underlying sediments dip slightly
from north to south (Joray, 1942) and the basal peat has been dated at 12 370 š 50 14
C yr BP, corresponding
to ¾14 457 calibrated years BP (Shotyk et al., 1998).
The EGr peat is stratified into multiple layers of varying humification. Based on the Von Post (Landva et al.,
1986; Von Post, 1922) peat classification system (a scale from H1 to H10, with nonhumified peat classified
as H1 and completely humified peat as H10), a H8 peat unit peat lies between 130 and 420 cm depth. Below
and above the H8 unit is less decomposed peat, at H3–H5 humification (Steinmann and Shotyk, 1997a).
EGr Bog, Dom
edGru re Lake
è
0 100 200 m
1
2
Sampling Sites
1 Bog Crest
2 Bog Flank
EGr Bog
Bern
Zurich
Geneva
Switzerland
N
A
A’
Upland
Upland
Blanket Bog
Upland
0 m 100 m 200 m
Figure 1. Map of Etang de la Gru`ere bog, with the locations of the three nested piezometers used for sampling and hydraulic head
measurements. The bog crest is the location of sampling for geochemical profiles and age dating (Shotyk et al., 1998). Line A–A0
is the
location of the numerical model cross-sections
Copyright  2002 John Wiley & Sons, Ltd. Hydrol. Process. 16, 1047–1064 (2002)
1050 J. M. McKENZIE ET AL.
METHODS
Field analysis
We needed representative, although not comprehensive, hydraulic information from the bog crest to constrain
our heuristic models, and chose to use the approach established by others for qualitative calibration of
bog hydrogeologic heuristic models (e.g. McNamara et al., 1992; Siegel et al., 1995). Four 50-cm long
sections of peat were collected from the crest of the EGr bog at 20–70 cm (H4–H5), 200–250 cm (H8),
450–500 cm (H4) and 550–600 cm (H3) depths to obtain values for vertical hydraulic conductivity of the
major stratigraphic zones in the peat. The cores were obtained with a 5-cm radius, semicircular, stainless steel,
Belarus corer (Belokopytov and Beresnevich, 1955), and were wrapped in multiple layers of cellophane and
stored in split PVC tubes at 4 °C. They remained wet in storage, and there was no indication of degassing or
oxidation as would be shown by discoloration on the core edges.
One piezometer nest was installed at the EGr bog crest and another on the bog flank as a lateral control.
The elevations of the piezometer nests were surveyed relative to the elevation of the surrounding lake.
The piezometers were installed using the methods described by Chason and Siegel (1986) and consisted of
1Ð1-cm diameter casing and screen lengths of 5 to 10 cm. The piezometers were used to measure the vertical
and horizontal hydraulic gradients and for field experiments to determine horizontal hydraulic conductivity.
The water table was measured with a piezometer screened from the bog surface to 100-cm depth. Water
levels in all of the piezometers were recorded 20 times between July 1, 1997 and August 31, 1998. Horizontal
hydraulic conductivity was determined using slug and bail tests and the data were analysed using the Hvorslev
method (Hvorslev, 1951). This method leads to qualitative, order-of-magnitude values for horizontal hydraulic
conductivity because the parameter is measured only tens of centimetres from the casing (e.g. Butler and Healy,
1998) but the horizontal flow paths are hundreds of metres long.
Steinmann and Shotyk (1997a) used peepers to obtain detailed porewater profiles. These devices allow in
situ chemical equilibration between deionized water and porewater across 0Ð2-µm filter paper, rather than
extracting water from pore spaces directly.
Laboratory analysis
Vertical hydraulic conductivity was measured from falling-head tests on sealed peat cores in a Darcy
apparatus (Freeze and Cherry,1979). Sections of core, 10–15 cm long, were set in a 12Ð5-cm diameter PVC
tube using paraffin wax as described by Hoag and Price (1997). Water was run through the apparatus from
the bottom upwards to force out trapped air. The peat was kept continually saturated, including during storage
by refrigeration, to avoid shrinkage, a situation that might break the peat–wax seal. In contrast to the value
for horizontal hydraulic conductivity, determined by slug tests, the laboratory tests for vertical hydraulic
conductivity are more certain because the length of the peat sampled is a significant fraction of the total flow
path length in the vertical peat column.
Batch experiments were used to obtain distribution coefficients for sorption of calcium and magnesium to
the EGr peat. The results from batch experiments were fit to the Freundlich distribution that assumes an infinite
sorption capacity of the solid matrix (Zheng and Bennett, 1995). The Freundlich distribution coefficient is
defined as (Fetter, 1999):
CŁ
D KCa
1
where CŁ
is the amount of solute sorbed onto the solid phase, C is the concentration of the solute in solution,
and K, a are empirical constants found by fitting a line to a plot of C as a function of CŁ
. The distribution
coefficient, K, is defined as the mass of solute on the solid phase per unit mass of solid phase divided by the
concentration of solute in solution and has the units of volume per mass (e.g. ml g 1
).
A retardation coefficient, R, used as a sink term for removing solutes in advective–dispersive analytical
models, is calculated as follows (Zheng and Bennett, 1995):
R D 1 C
b
ne
aKCa 1
2
Copyright  2002 John Wiley & Sons, Ltd. Hydrol. Process. 16, 1047–1064 (2002)
SOLUTE TRANSPORT IN PEAT 1051
where b is bulk density of the porous material, ne is the effective porosity (from Hoag and Price, 1997), K
and a are found empirically [Equation (1)], and C is the concentration of the dissolved concentration of the
solute. The retardation coefficient equation is nonlinear because the Freundlich isotherm is a function of the
dissolved concentrations.
The experimental method for the batch experiments was modified from Day et al. (1979). Peat samples
were air dried for 36 to 48 h. The samples were ground to a powder using a mortar and pestle, mixed with
0Ð5 N hydrochloric acid and shaken with a wrist action shaker for 1 h. The solution was then filtered, and
the soil was washed with 400 ml of deionized water and air dried.
Approximately 5 g of powdered sample was placed in a test tube, and topped to 20 ml with a solution
containing varying amounts of magnesium (0–215 ppm) and calcium (0–2770 ppm). The test tubes were
shaken for 48 h using a wrist action shaker. (Preliminary experiments showed that 48 h was ample time for
equilibrium to be reached.) The solutions were then filtered with 0Ð45-µm filter paper and analysed using a
direct current plasma spectrometer for magnesium and calcium. Distribution coefficients were measured for
two different peat decomposition layers: 220–230 and 520–530 cm depth.
Analytical modelling
Solute transport in porewater is caused by chemical diffusion, fluid advection and/or mechanical dispersion
(Freeze and Cherry,1979). The Ogata–Banks equation (Ogata and Banks, 1961) with retardation (Bedient
et al., 1994) in one direction is an analytical, solute transport equation:
Ci
C0
D
1
2
erfc
Rl vt
2
p
RDlt
C
1
2
exp
vl
Dl
erfc
Rl C vt
2
p
RDlt
3
where Ci/C0 is the relative concentration, l is the distance along the flow path, v is the average linear water
velocity, Dl is the coefficient of dispersion, and erfc is the complementary error function. The retardation
coefficient, R [Equation (2)], is set to unity for situations with no retardation.
If the average groundwater velocity is very slow, Equation (3) reduces to Fick’s Second ‘Law’ of pure
diffusion (Freeze and Cherry, 1979). In addition, at very low velocities, diffusion dominates dispersion, and
the coefficient of dispersion is equal to the diffusion coefficient (Dl D DŁ
) (Freeze and Cherry, 1979).
Porewater data for Ca and Mg (Steinmann and Shotyk, 1997a) were compared to theoretical profiles of
diffusion described by the Ogata–Banks equation [Equation (3)] with no advective velocity to test the hypoth-
esis that diffusion controls solute transport in the bog. By holding t and Dl constant and changing the length
term, a theoretical chemical diffusion profile was calculated. Values for t, 11 425 yr, and DŁ
, 10 10
m2
s 1
,
were used to model the expected amount of chemical diffusion upward in the peat column. The DŁ
value
used is the average of the maximum and minimum chemical diffusion coefficients selected as representative
values for a peatland setting (Cussler, 1997; Dominico and Schwartz, 1998; Freeze and Cherry, 1979).
The concentrations of solutes at the base of the analytical model, at 5Ð4 m depth, were assumed constant.
The principle source of cations in the peat porewater is the underlying calcareous sediment. It is reasonable
to assume that the Ca and Mg concentrations within 100 cm of the base of the peat (compared to ¾6 m total
peat thickness) have been nearly constant since the bog formed. The rates at which Ca and Mg dissolve from
granular carbonate minerals are comparable to the rates of solute transport from the base of the bog into the
peat column, and are slow enough to maintain chemical equilibrium near the base of the bog (Langmuir, 1997).
Numerical modelling
Visual MODFLOW was used for the numerical modelling experiments, oriented for cross-sectional flow
system analysis (e.g. Freeze and Witherspoon, 1967; Toth, 1963). Visual MODFLOW is a widely used
Microsoft Windows based version of the US Geological Survey 3-D Finite Difference Groundwater Flow
model, MODFLOW (Harbaugh and McDonald, 1988, 1996). The model of the EGr bog was run at steady state,
two-dimensional with eight grid layers divided into four hydrogeologic units representing four stratigraphic
Copyright  2002 John Wiley & Sons, Ltd. Hydrol. Process. 16, 1047–1064 (2002)
1052 J. M. McKENZIE ET AL.
layers of different humification. The peat units were initially assigned vertical and horizontal hydraulic
conductivity values based on the field and laboratory results to guide the heuristic modelling effort.
The modelled domain was 6Ð5 m thick at the centre and 2Ð5 m thick at the edges. The topography of the
bog water table was adapted from Joray (1942) and from levelling the water table wells. The model had 34
columns evenly spaced over 300 m, except at the edges of the bog where the spacing was halved for better
resolution (Figure 2; Tables I and II).
The top of the model was a constant head boundary, Dirichlet condition (Bear and Verruijt, 1987), reflecting
a steady water table 30 cm below the topographic surface of the bog (Figure 2). The bottom and all sides
of the model were considered no-flow boundaries, Neumann conditions (Bear and Verruijt, 1987) (Figure 2).
Applying these types of boundary conditions is standard practice with respect to modelling steady-state
hydrogeological conditions for wetland settings with pronounced water table mounds (e.g. Winter, 1978;
McNamara et al., 1992; Siegel, 1993) and with the absence of notable strong mass fluxes from the sides.
0 30040 80 120 160 200 240 280
0.06.40.91.82.73.64.55.4
0 40 80 120 160 200 240 280 300
0
0.9
1.8
2.7
3.7
6.5
4.6
5.6
High Hydraulic Conductivity, H2-H5 Peat
Low Hydraulic Conductivity, H8 Peat
High Hydraulic Conductivity, H4 Peat
Constant Head Node
Sensitivity Analysis Sampling Point
Thickness(m)
Width (m)
Figure 2. The grid network and simulated calibration wells used for the Visual MODFLOW simulations of the present day EGr bog. The
bottom and sides of the model are no-flow boundaries, and the constant head layer across the top of the model represents the water table.
The hydraulic conductivity units are described in Table II. The calibration wells are simulated wells placed throughout the model domain
Table I. Model input parameters for Visual MODFLOW. Descriptions of the hydraulic units are in Table II. (Note:
measurements taken below the bog crest)
Model A B C D E
Model age (14
C yr BP) 0 2000 4500 4250 7000
Model thickness (m) 6Ð5 5Ð5 4Ð5 3Ð5 3Ð0
Number of layers 11 9 8 7 7
Elevation of hydraulic unit 1 (m) 0Ð0–2Ð2 0Ð0–2Ð1 0Ð0–2Ð1 0Ð0–1Ð9 0Ð0–2Ð0
Elevation of hydraulic unit 2 (m) 2Ð2–5Ð5 2Ð1–4Ð0 2Ð1–3Ð5 1Ð9–2Ð5 2Ð0–2Ð0
Elevation of hydraulic unit 3 (m) 5Ð5–6Ð5 4Ð0–5Ð5 3Ð5–4Ð5 2Ð5–3Ð5 2Ð0–3Ð0
Depth to water table (m) 0Ð2 0Ð2 0Ð2 0Ð2 0Ð2
Model diameter (m) 300 300 300 300 300
Number of columns 32 32 32 30 30
Number of cells 352 288 256 210 210
Vertical gradient at crest (from 1 m below
bog surface to 1 m above model base)
0Ð04 0Ð025 0Ð02 0Ð009 0Ð001
Copyright  2002 John Wiley & Sons, Ltd. Hydrol. Process. 16, 1047–1064 (2002)
SOLUTE TRANSPORT IN PEAT 1053
Table II. Description of hydraulic units used in numerical modelling with Visual MODFLOW
Hydraulic unit 1 2 3
Location in EGr bog Bottom Middle Top
Calibrated horizontal hydraulic conductivity (cm s 1
) 10 4Ð5
10 5Ð6
1
Calibrated vertical hydraulic conductivity (cm s 1
) 10 2Ð2
10 6
10
Calibrated anisotropy ratio (Kh/Kv) 10 3Ð3
2Ð3 0Ð1
Measured horizontal hydraulic conductivity (cm s 1
) 10 3Ð5
10 5Ð6
Not measured
Measured vertical hydraulic conductivity (cm s 1
) 10 3Ð2
10 4
10 2
Measured anisotropy ratio (Kh/Kv) 0Ð5 0Ð02 Not applicable
Degree of decomposition (Von post scale) H3–H4 H8 H1–H4
The numerical model results were fit to the average observed hydraulic head gradients at the bog crest and
flank by varying horizontal and vertical hydraulic conductivity values. The average vertical hydraulic head
distributions measured at the bog crest and flank remained almost the same, downward, throughout the field
season. Vertical reversals of hydraulic head would be expected more at the bog–lake edge where transient
flow reversals could occur as the lake rises or falls faster than the adjacent water table. However, the purpose
of our research was to determine the hydraulic processes at the bog crest, the point of maximum accumulation
of peat and focus of ombrotrophy. Therefore, while we do recognize potential boundary effects at the edge
of the bog, calibration at this location is not emphasized in light of our objectives, similar to what was done
by McNamara et al. (1992).
The dimensionless Peclet number was used to distinguish between the predominance of diffusive or
advective mass transport (Remenda et al., 1996). The Peclet number, Pn, is (Freeze and Cherry, 1979):
Pn D
vd
DŁ
4
where v is the average linear velocity, d is the average particle diameter, and DŁ
is the diffusion coefficient.
Substituting Darcy’s Law, solved for v, into Equation (4) renders:
Pn D
Kid
neDŁ
5
where ne is effective porosity, i is the vertical hydraulic gradient, and K is hydraulic conductivity.
If Pn is less than approximately 0Ð02, then solute transport is dominated by longitudinal diffusion, whereas
if Pn is greater than 6, then solute transport is dominated by mechanical dispersion and advection (Fetter,
1999). If Pn is between 0Ð02 and 6, transitional conditions may occur (Fetter, 1999).
In Equation (5), the hydraulic conductivity, the average particle diameter, the effective porosity and the
diffusion coefficient can be held constant. A numerical model can be used to heuristically calculate vertical
hydraulic head gradients as the water table mound under the bog grows, and the result can then be applied
to the Peclet number to assess if mass transport at any given time is dominated by diffusion or advection.
As a starting point for the heuristic Peclet calculation for modern conditions a vertical diffusion coefficient
of 10 10
m2
s 1
(Freeze and Cherry, 1979) and an effective porosity of 0Ð25 (Hoag and Price, 1997) were
used and an average pore diameter of 1 mm was used, based on data obtained from similar peat soil types
(Yamaguchi et al., 1985). For the Peclet calculation a vertical hydraulic conductivity of 10 5Ð3
cm s 1
and a
vertical hydraulic gradient calculated from the numerical cross-sectional model, calibrated by changing the
estimated values for vertical and horizontal hydraulic conductivities in each hydrologic unit, were used. Then,
the profile of the bog water table was changed to reflect the growth of the bog. The water table configuration
was based on the age of the peat, determined by radiogenic dating (Shotyk et al., 1998). It was assumed
that the width of the bog was effectively the same over time and that the shape of the water table mound
historically was simply an increasingly subdued replicate of the modern setting.
Copyright  2002 John Wiley & Sons, Ltd. Hydrol. Process. 16, 1047–1064 (2002)
1054 J. M. McKENZIE ET AL.
Sensitivity analysis investigated the effects of varying the hydraulic conductivity on the modelled hydraulic
head of the EGr bog. After the modelled head values at the piezometer locations were matched, the hydraulic
head was noted at nine sampling points in the numerical model domain (Figure 2). The hydraulic head data
for each sampling point was set arbitrarily to the computed head value at that location. Horizontal and vertical
hydraulic conductivity values for each hydraulic unit were then varied individually, and a measurement of
sensitivity of the simulated hydraulic head to hydraulic conductivity was calculated using the following
equation (Anderson and Woessner, 1992; Zheng and Bennett, 1995):
Xi D RMSi,changed RMSoriginal 6
where Xi is the measure of sensitivity as a result of a change in parameter i, RMSi,changed and RMSoriginal
are the root-mean-squared error of the hydraulic head for the perturbed and original model respectively. The
root-mean-squared error for a given model perturbation, i, is (Anderson and Woessner, 1992):
RMS D 1/n
n
i
hm hs
2
i 7
where n is the number of samples, and hm hs is the difference between the perturbed and original hydraulic
heads at the sampling points.
RESULTS
Peat properties
Upon extraction, the 20 to 70 cm depth core roughly consisted of two sections: a light brown, loose
Sphagnum, H4 peat section from 20 to 40 cm depth, and a dark brown to black layer, H5, with wood material
from 40 to 70 cm depth. The second core, from 200 to 250 cm depth, had no noticeable stratigraphic breaks,
was black, and H8 peat. The third core, from 450 to 500 cm depth, was in two sections: Carex dominated,
H4 peat from 450 to 480 cm depth, and slightly broken up Sphagnum and Carex, H4 peat to the end of the
core. The fourth core, from 550 to 600 cm depth, had H3 peat and a gradual transition to light brown moss
in the bottom 20 cm.
Hydraulic gradients
The gradients at the bog crest (Figure 3) and on the bog flank (not shown) were, on average, 0Ð04
downwards. The average vertical head gradient at the crest of the EGr bog is downward (Figure 3a), although
seasonally, vertical head gradients change (Figure 3b). The hydraulic gradient at the bog flank is downward
through most of the measurement period and fluctuated less than at the bog crest.
Hydraulic properties
The geometric mean of the horizontal hydraulic conductivity (n D 7) from the centre well-humified
peat section, 1Ð0 to 4Ð3 m depth, is 10 5Ð6
cm s 1
, the minimum is 10 6Ð5
cm s 1
and the maximum is
10 4Ð5
cm s 1
. The horizontal hydraulic conductivity of the underlying less humified layer, 5Ð5 to 6Ð5 m depth,
is 10 3Ð5
cm s 1
(n D 1). From the falling head tests, the vertical hydraulic conductivity was measured as
10 2
cm s 1
at 0Ð5 m depth, 10 4
cm s 1
at 2Ð5 m depth, and 10 3Ð2
cm s 1
at 4Ð6 m depth. The weighted
average of the vertical hydraulic conductivity is 10 3Ð8
cm s 1
. Figure 4 displays the horizontal, vertical
hydraulic conductivity values, and those predicted from peat bulk density with depth.
Copyright  2002 John Wiley & Sons, Ltd. Hydrol. Process. 16, 1047–1064 (2002)
SOLUTE TRANSPORT IN PEAT 1055
0
10
20
30
40
50
7/1/97
8/10/97
9/19/97
10/29/97
12/8/97
1/17/98
2/26/98
4/7/98
5/17/98
6/26/98
8/5/98
9/14/98
Date
Depth,BelowBogSurface,toWater(cm)
Water Table
150 cm depth
250 cm depth
550 cm depth
?
?
? ?
?
DepthBelowBogSurface(cm)
Measured Pressure Head (cm)
FlowEquilibrium
DownwardGradient
Upward
Gradient
StandardDeviationofMeasurements
Average
−30 −25 −20 −15 −10 −5 0 5 10
0
100
200
300
400
500
600
a)
b)
Figure 3. Hydraulic head measurements at the bog crest (a) with depth and (b) through time. The hydraulic head measurements were made
with piezometers inserted to depths of 150, 250 and 550 cm. The water table was measured with a PVC tube that was fully slotted from a
depth of 0 to 100 cm below the land surface. Part (a) shows the general trend of the vertical hydraulic head is downwards, with an average
hydraulic gradient of 0Ð04
Copyright  2002 John Wiley & Sons, Ltd. Hydrol. Process. 16, 1047–1064 (2002)
1056 J. M. McKENZIE ET AL.
Hydraulic Conductivity (cm/s)
EstimatedBulkHydraulicConductivity
HorizontalHydraulicConductivity
VerticalHydraulicConductivity
Depth(cm)
100
200
300
400
500
600
0
10
−6
10
−10
10
−8
10
−2
10
−4
10
−0
Figure 4. Summary of hydraulic conductivity values with depth. Values for vertical hydraulic conductivity were found from variable head
tests, horizontal hydraulic conductivity from Darcy experiments, and estimated hydraulic conductivity based on bulk density (Steinmann
and Shotyk, 1997a)
Adsorption experiments
The sorption data was fit to the nonlinear Freundlich sorption isotherm using Sigma Plot, a scientific
graphing program. The distribution coefficients at 220 to 230 cm depth were 0Ð0025 and 0Ð016 ml g 1
for
Mg and Ca respectively. The distribution coefficients at 520 to 530 cm depth were 0Ð0003 and 0Ð019 ml g 1
for Mg and Ca respectively. The retardation coefficients for Ca and Mg at both depths ranged from 1Ð0 to
5Ð3 for dissolved solute concentrations of 20 to 0Ð0001 ppm.
Analytical modelling
Figure 5 summarizes the results of the analytical 1-D model for solute transport by chemical diffusion with
and without retardation.
Numerical modelling
The flow net from the calibrated numerical flow model for the modern bog is shown in Figure 6a. The
values of vertical and horizontal hydraulic conductivity observed and used in the calibrated model are in
Table II. The calibrated values of the horizontal hydraulic conductivity of the bottom layer, 10 4Ð5
cm s 1
,
and the vertical hydraulic conductivity of the middle layer, 10 6
cm s 1
, were smaller than the observed,
10 3Ð5
and 10 4
cm s 1
respectively. The calibrated values of the vertical hydraulic conductivity of the
bottom hydraulic unit, 10 2Ð2
cm s 1
, and the top hydraulic unit, 10 cm s 1
, are larger than the observed,
10 3Ð2
and 10 2
cm s 1
respectively. The calibrated and observed vertical hydraulic conductivities of the
horizontal hydraulic conductivity of the middle hydraulic unit are the same, 10 5Ð6
cm s 1
, and the horizontal
hydraulic conductivity of the top layer was not measured. In our sensitivity analysis, we varied the horizontal
and vertical hydraulic conductivity of individual hydraulic units by factors of 5 and 10. The results of the
sensitivity analysis are presented in Figure 7.
The EGr bog was then modelled to evaluate changes in vertical hydraulic gradient with growth of the EGr
dome. In addition to the modern scenario, heuristic models were run for bogs with a thickness of 5Ð5, 4Ð5,
3Ð5 and 3Ð0 m, corresponding to approximate ages of 2000, 4500, 6250 and 7000 14
C yr BP (Figure 6). As
Copyright  2002 John Wiley & Sons, Ltd. Hydrol. Process. 16, 1047–1064 (2002)
SOLUTE TRANSPORT IN PEAT 1057
0 0.2 0.4 0.6 0.8 1
Depth(m)
Relative Concentration (Ci /Co )
1.0
0.0
2.0
3.0
4.0
5.0
6.0
7.0
Peat Soil
Mineral Soil
Ca Observed
Mg Observed
Calculated Diffusion Only (D*=10 m s )−10 2 −1
Calculated Diffusion + Retardation (D*=10 m s ; R=10)−10 2 −1
Calculated Diffusion + Retardation (D*=10 m s ; R=35)
−10 2 −1
Figure 5. Measured porewater concentrations of Ca and Mg versus analytically modelled diffusion profiles (Ogata–Banks equation with and
without retardation). The ordinate value for concentration is equal to the concentration at depth, Ci, divided by the concentration at the base
of the profile, C0. The Ci for Ca and Mg is 798Ð3 and 101Ð6 µM respectively. The results show that a retardation factor of 35 is needed for
the analytical results to match the measured porewater profiles
the thickness of the bog decreased from 6Ð5 to 3Ð0 m, the vertical gradients decreased from 0Ð04 to 0Ð001
(Table I; Figure 6).
INTERPRETATION
The EGr bog has a groundwater mound that rises approximately 4Ð0 m above the surrounding lake. The
measured downward hydraulic gradients in it are consistent with what is expected for lake–groundwater
interaction when such a mound is present (Winter, 1978). Although the head gradient is generally downward
at the bog crest, the gradient does seasonally change. These short-term changes in the vertical hydraulic
gradients at the EGr bog crest are consistent with the hypothesis of episodic methane build-up and ebullition
from the peat causing overpressuring in the centre of the peat column (Romanowicz et al., 1993; Glaser et al.,
Copyright  2002 John Wiley & Sons, Ltd. Hydrol. Process. 16, 1047–1064 (2002)
1058 J. M. McKENZIE ET AL.
Flow Direction Arrow
0 30040 80 120 160 200 240 280
0.06.52.74.5
3.5
3.5
4.0
4.0
4.5
4.5
5.0
5.0
5.5
5.5
6.0
6.0
0 30040 80 120 160 200 240 280
0.04.51.83.0
2.6
2.6
2.8
2.8
3.0
3.0
3.2
3.2
3.4
3.4
3.6
3.6
3.8
3.8
4.0
4.0
4.2
4.2
0 30040 80 120 160 200 240 280
0.03.51.52.5
2.6
2.6
2.7
2.7
2.8
2.8
2.9
2.9
3.0
3.0
3.1
3.1
3.2
3.2
0 30040 80 120 160 200 240 280
0.03.01.22.0
2.6
2.6
2.6
2.6
2.6
2.6
2.7
2.7
2.7
2.7
a) Model A
b) Model B
c) Model C
d) Model D
e) Model E
0 30040 80 120 160 200 240 280
0.05.51.42.84.2
3.0
3.0
3.5
3.5
4.0
4.0
4.5
4.5
5.0
5.0
Water Table
Hydraulic Conductivity Unit Boundary
Line of Equipotential6.3
Horizontal Distance (m)
Elevation(m)Elevation(m)Elevation(m)Elevation(m)Elevation(m)
Figure 6. Flownet output of the Visual MODLFLOW models demonstrating the decrease in vertical hydraulic gradient with a decrease in
the thickness of the EGr model dome. In the models, all of the hydraulic conductivity values were held constant but the thickness of the
hydraulic units was varied. The resultant vertical gradients at the bog crest are 0Ð036, 0Ð025, 0Ð019, 0Ð0091 and 0Ð001 for models (a), (b),
(c), (d) and (e) respectively. The model input parameters are tabulated in Tables I and II
1997). However, during this project, no measurements of methane or other gases were made, so this hypothesis
needs to be further tested. In any case, in general, vertical head gradients are almost always downward and
sufficient to drive advective flow.
Copyright  2002 John Wiley & Sons, Ltd. Hydrol. Process. 16, 1047–1064 (2002)
SOLUTE TRANSPORT IN PEAT 1059
10
−1.0
10
−0.7
-10
−6.7
-10
−6.8 10
−2.0
10
−1.6
10
−1.4
10
−1.3
−10
−4.3
10
−3.5
10
−4.2
10
−4.2
0
0.02
0.04
0.06
0.08
0.1
0.12
0.14
0.16
0.18
0.2
MeasureofSensitity,
Xi
Bottom Layer, Kh
Bottom Layer, Kv
Middle Layer, Kh
Middle Layer, Kv
Top Layer, Kh
Top Layer, Kv
Varied Parameter, i
Hydraulic Conductivity Changed by x 5
Hydraulic Conductivity Changed by x 10
Layer, Kh
Figure 7. Sensitivity analysis of the EGr bog numerical model, shown as a graph of changes in the sensitivity of the calculated heads to
changes in material properties of the peat. The figure indicates that the model is most sensitive to the horizontal hydraulic conductivity of
the bottom layer, followed by both the vertical and horizontal hydraulic conductivity of the middle layer
The field values for horizontal hydraulic conductivity of EGr peat are similar to that found elsewhere,
in the range of 10 4
to 10 3
cm s 1
(Chason and Siegel, 1986). However, the anisotropy ratio (horizontal
hydraulic conductivity divided by vertical hydraulic conductivity) <1 (Figure 4) is unusual. The majority
of porous materials, including those in wetlands, have anisotropy ratios greater than unity (e.g. Chason and
Siegel, 1986; Freeze and Cherry, 1979).
There are two possible explanations for the inverse anisotropy in the EGr bog. First, the vertical hydraulic
conductivity experiments may have failed due to poor seals between the peat and the surrounding paraffin
wax. However, bubbles or other fluids were not seen moving through the wax seal during the experiments;
therefore a failed seal is not plausible. Second, the peat profile from the surface to a depth of 420 cm contains
significant remains of Eriophorum (Joray, 1942), a grass with a decay resistant base and long, fine fibres. These
stalks and fibres are preserved in their original, upright orientation, probably creating secondary pathways
that pipe water in the vertical direction. When the EGr bog cores were split, the vertical orientation of this
plant macrofossil was readily apparent.
The porewater of the EGr bog has decreasing concentrations of major solutes from the base of the peat
profile to the surface (Figure 5). Considering the hydrogeologic isolation of the dome from the surrounding
topography, the only major source of high concentrations of solutes in the porewater is the underlying
sediments. The three possible modes of upward transport for solutes are diffusion, upward advection driven
by an upward porewater flow, and/or transverse dispersion driven by a horizontal flow (Reeve et al., 2000).
Copyright  2002 John Wiley & Sons, Ltd. Hydrol. Process. 16, 1047–1064 (2002)
1060 J. M. McKENZIE ET AL.
The analytical models (Figure 5) show that the solutes, given the age of the lower peat sediments, simply
could not have migrated upward by diffusion. The modelled diffusion profiles in all cases show more diffusion
(i.e. the profile rises higher in the peat profile from the mineral soil base) than shown by the profiles of the
measured solute concentrations. All measured solute profiles plot below plausible theoretical diffusion profiles,
even the analytical one-dimensional model with a maximum plausible retardation factor of 10.
Hoag and Price (1997) found that the maximum retardation factor for base cations in well-humified peat is
7Ð3, indicating that our analytic model results (with a retardation factor of 35) are not a plausible representation
of solute transport in the EGr bog. Finally, the retardation factors for Ca and Mg from the batch experiments
range from approximately 1 to 5Ð3, thereby confirming that a retardation factor of 35 is unrealistic.
Reeve et al. (2000) show that horizontal flow, given sufficient time and distance, can create extensive
transverse dispersion. The result of this process in the EGr bog would be increased upward movement of
solutes into the peat profile from the mineral soil. However, the results of our study show that the upward
movement of solutes is less than predicted, with or without dispersion from horizontal flow. The occurrence
of transverse dispersion is difficult to estimate, but it will lead to an underestimation of the downward
vertical flow.
Porewater solutes did not diffuse high into the peat profile because downward advection of pore water
prevented it. The measured downward gradient at the bog crest is 4% (0Ð04). Assuming an effective porosity
of 0Ð25 and using the weighted average of the measured vertical hydraulic conductivity values (10 3Ð8
cm s 1
),
the average linear velocity is ¾2 cm day 1
downwards.
The Visual MODFLOW simulation shows that flow paths originate at the bog crest, move downward,
and then return to the bog flanks. These results are similar to those by Freeze and Witherspoon (1967) who
prepared numerical models of regional groundwater flow in mineral soils including a buried layer of high
hydraulic conductivity. Reeve et al. (2000) recently found that sand and gravel layers below large peatlands,
such as the Glacial Lake Agassiz Peatlands, similarly influence the groundwater flow cells at a much larger
scale. The model results and sensitivity analysis further show that groundwater flow in the bog peat is most
sensitive to the horizontal hydraulic conductivity of the bottom layer, followed by the horizontal and vertical
hydraulic conductivities of the middle layer (Figure 7). The hydraulic head did not change significantly when
changes in other model parameters, including the depth of the lake or even the absence/presence of the lake,
were made.
Total mass transport in the bog hydrogeologic setting is, of course, still dominated by horizontal flow. Flow
lines that originate at the bog crest travel down to the bottom high hydraulic conductivity layer, laterally to
the edge of the model, and then upwards to the constant head boundary representing the lake. Flow paths that
originate on the bog flanks travel downward slightly, move nearly parallel to the bog surface, and at the bog
edge the water is discharged to the lake edge due to the change in slope of the bog surface near the lake.
The modern Peclet number defining the condition of vertical solute transport at the bog crest is 8Ð0, based
on present day values for the vertical downward gradient. Holding the bog peat material properties constant,
the Peclet number equation reduces to a function of the vertical hydraulic gradient, controlled by the doming
of the bog, and a constant based on the physical properties of the peat [Equation (5)].
Reducing the value for the hydraulic gradient from 0Ð04 to <0Ð001 would theoretically result in pure
diffusive solute transport. At EGr, the modelled vertical hydraulic gradient of 0Ð001 was heuristically calculated
for a bog only 3Ð0 m thick, 7000 14
C yr BP. Therefore, before 7000 14
C yr BP, the porewater chemistry of the
EGr bog was controlled purely by upward diffusion. From 7000 to ¾1250 14
C yr BP the porewater chemistry
was controlled by both upward diffusion and downward advection. For the past ¾1250 14
C yr, solute transport
in the EGr bog has been dominated by downward advection (Figure 8).
Uncertainties
There is obviously uncertainty in the parameters used for the analytical, numerical and Peclet number
modelling. We chose parameters that we felt were most plausible for the hydrogeologic setting of the bog.
Copyright  2002 John Wiley & Sons, Ltd. Hydrol. Process. 16, 1047–1064 (2002)
SOLUTE TRANSPORT IN PEAT 1061
D/D*(log)l
vd/D*
0.2
Diffusion
Transition
Conditions
Advection/
Mechanical
Dispersion
7000CyrBP14
6250CyrBP14
4500Cyrbp14
2000Cyrbp14
6.0
Present
Future
Figure 8. The Peclet number combined with the results of the variable thickness models. The theoretical Peclet number analysis shows the
change from diffusion to advective controlled transport of porewater solutes through time. The basal peat of the EGr bog is 12 000 14C yr
old
For example, our assumed value for DŁ
is consistent with the value commonly used in solute transport
calculations (e.g. Freeze and Cherry, 1979) in like environments, and our assumed value and method of
measurement for hydraulic conductivity is consistent with practice (e.g. Chason and Siegel, 1986).
For the Peclet number analysis, we assumed that the calibrated vertical hydraulic conductivity of the modern
hydrogeologic numerical flow model was the most appropriate one to use. We calibrated to the observed head
distributions by varying hydraulic conductivity; the boundary conditions of the bog margins, water table and
lower no-flow boundary were fixed at steady state, and only the hydraulic conductivity was used to make the
calibration as is typical in doing heuristic (or even transient) models (Anderson and Woesner, 1992). We then
optimized the modern Peclet number to ensure that advective flow occurs in the peat profile today, based on
modern field data, and that diffusion controlled solute transport when the bog initially domed 10 000 years
ago, which is heuristically sensible from first principles, given a nearly flat water table.
It is clear that when the bog first formed, the upward diffusive flow of solutes was the dominant transport
mechanism because there was no to minimal groundwater mounding that would drive recharge downward. It
is also clear that modern downward advection of ground water now inhibits upward diffusion; otherwise, the
measured solute profiles would match diffusion profiles. The fundamental question remains: what combination
of hydraulic properties can lead to downward advection today? We attempt to resolve this issue by testing
the sensitivity of changing the parameters in the Peclet number to obtain values greater than 6Ð0, indicating
advection is the dominant transport process. Of the material properties used to calculate the Peclet number,
the widest potential range in values are for the coefficient of dispersion which can span two orders of
magnitude and for the vertical hydraulic conductivity. For example, assuming the lowest plausible value
for vertical hydraulic conductivity, 10 7
cm s 1
, to obtain a Peclet number greater than 6Ð0 the diffusion
coefficient would have to be 10 11Ð5
m2
s 1
, smaller than the minimum plausible, 10 11
m2
s 1
(Freeze and
Cherry, 1979). Inversely, assuming the diffusion coefficient has a maximum plausible value of 10 9
m2
s 1
,
the vertical hydraulic conductivity must be 10 4Ð5
cm s 1
for advection to be the dominant solute transport
process. Without detailed field experiments, such as mini-aquifer testing and tracer tests in the bog, it is not
possible to constrain the uncertainty and variability of the Peclet number more, although the combination of
values used must have a value greater than 6 to advect recharge downward today in the bog. Our sensitivity
testing, although constrained in part by the difficulty of obtaining important material parameters for peat, does
suggest that we have captured the essence of the evolution of the bog’s solute transport history, if not the
details in specific timing.
Copyright  2002 John Wiley & Sons, Ltd. Hydrol. Process. 16, 1047–1064 (2002)
1062 J. M. McKENZIE ET AL.
There are uncertainties in the Visual MODFLOW simulations. The lateral peat stratigraphy is not well
constrained, but plausibly continuous and horizontal given the heuristic approach used in this study. The age
of the peat at the EGr bog crest is well known (Shotyket al., 1998), but there is, as is usual in wetlands,
limited information (i.e. Joray, 1942) on the palaeomorphology and growth rates at the bog flanks and edges.
We assumed as a first approximation, based on changes in vegetation, that bog growth started out as a flatter
‘fen-type’ peatland and then domed.
CONCLUSIONS
Vertical porewater flow is an important process often overlooked by wetland scientists. Our research shows
that vertical flow can and does influence the porewater chemistry of the EGr bog, and by extension, probably
other isolated domed bogs as well. Using only the Dupuit–Forcheimer assumptions to calculate porewater
movement and mass transport will invariably lead to errors in the chemical mass flux of bog systems at other
than temporally short time scales. For example, prediction of the shape and size of raised bogs based only on
the horizontal flow of water (Ingram, 1982; Winston, 1994) may be problematic where there is a significant
component of vertical flow.
Our measured vertical profiles of porewater chemistry at the EGr bog plot lower than that calculated by
analytical models incorporating pure vertical diffusive transport. Today at the crest of the EGr bog, porewater
clearly moves downward and deep through the peat profile and hydraulic measurements suggest that the rate
of movement is on the order of ¾2 cm day 1
.
Heuristic numerical modelling experiments of porewater flow at the EGr bog show that the high hydraulic
conductivity layer at the bottom of the EGr bog is critical to form recharge flow cells extending to the base
of the bog. Coupling the numerical model with Peclet number analysis shows that current solute transport in
the bog is both advective and diffusive, although prior to 7000 14
C yr before present, solute transport was
controlled only by vertical diffusion (Figure 8). These results compare well to those of Reeves et al. (2000)
for the larger Glacial Lake Agassiz Peatlands, where a higher permeability layer in mineral soils below the
base of the peat column creates deep, vertical, groundwater flow cells. The hydrodynamics of porewater flow
in these two very different peatland settings lead to the conclusion that the presence or absence of a higher
permeability layer in or below a domed peat bog is a crucial factor to create conditions for deep vertical flow
of porewater and advection of solutes in peat.
ACKNOWLEDGEMENTS
This work was funded by the National Science Foundation, the University of Bern and supported by the Swiss
National Science Foundation. Thanks to Ines and Martin Otz for assistance with data collection.
REFERENCES
Anderson MP, Woessner WW. 1992. Applied Groundwater Modeling. Harcourt Brace Jovanovich: San Diego; 381.
Armstrong AC. 1995. Hydrological model of peat-mound form with vertically varying hydraulic conductivity. Earth Surface Processes and
Landforms 20: 473–477.
Bear J, Verruijt A. 1987. Modeling Groundwater Flow and Pollution. D. Reidel: Dordrecht; 414.
Bedient PB, Rifai HS, Newell CJ. 1994. Ground Water Contamination; Transport and Remediation. Prentice Hall: Englewood Cliffs, NJ;
541.
Belokopytov IE, Beresnevich VV. 1955. Giktorf’s peat borers. Torfyanaya Promyshlennost 8: 9–10 (in Russian).
Bredehoeft JD, Konikow LF. 1993. Groundwater models: validate or invalidate. Ground Water 31: 178–179.
Butler JJ, Healey JM. 1998. Relationship between pumping-test and slug-test parameters: scale effect or artifact? Ground Water 36: 305–313.
Chason DB, Siegel DI. 1986. Hydraulic conductivity and related physical properties of peat, Lost River Peatland, Northern Minnesota. Soil
Science 142: 91–99.
Clymo RS. 1983. Peat. In Ecosystems of the World, Vol. 4A, Mires: Swamp, Bog, Fen and Moore, General Studies, Gore AJP (ed.). Elsevier:
New York; 159–224.
Copyright  2002 John Wiley & Sons, Ltd. Hydrol. Process. 16, 1047–1064 (2002)
SOLUTE TRANSPORT IN PEAT 1063
Cussler EL. 1997. Diffusion; Mass Transfer in Fluid Systems. 2nd edn. Cambridge University Press: Cambridge; 580.
Day JH, Rennie PJ, Stanek W, Taymond GP (eds). 1979. Peat Testing Manual. Technical Memo No. 125, National Research Council of
Canada: Ottawa; 194.
Dominco PA, Schwartz FW. 1998. Physical and Chemical Hydrogeology, 2nd edn. Wiley: New York; 506.
Fetter CW. 1999. Contaminant Hydrogeology, 2nd edn. Prentice Hall: Englewood Cliffs, NJ; 500.
Freeze RA, Cherry JA. 1979. Groundwater. Prentice Hall: Englewood Cliffs, NJ; 604.
Freeze RA, Witherspoon PA. 1967. Theoretical analysis of regional groundwater flow: 2. Effect of water-table configuration and subsurface
permeability variation. Water Resources Research 3: 623–634.
Glaser PH, Siegel DI, Romanowicz EA, Shen YP. 1997. Regional linkages between raised bogs and the climate, groundwater, and landscape
of north-western Minnesota. Journal of Ecology 85: 3–16.
Harbaugh AW, McDonald MG. 1988. A modular three-dimensional finite-difference ground-water flow model. US Geological Survey
techniques of water-resources investigations, book 6, chap. A1. Open-File Report 83-875, USGS: Reston; 586 pp.
Harbaugh AW, McDonald MG. 1996. User’s Documentation for MODFLOW-96, an update to the US Geological Survey modular finite-
difference ground-water flow model. Open-File Report 96-485, USGS: Reston; 56 pp.
Hilbert DW, Roulet N, Moore T. 2000. Modelling and analysis of peatlands as dynamical systems. Journal of Ecology 88: 230–242.
Hoag RS, Price JS. 1997. The effects of matrix diffusion on solute transport and retardation in undisturbed peat in laboratory columns.
Journal of Contaminant Hydrology 28: 193–205.
Hobbs NB. 1986. Mire morphology and the properties and behaviour of some British and foreign peats. Quarterly Journal of Engineering
Geology, London 19: 7–80.
Hvorslev MJ. 1951. Time lag and soil permeability in ground-water observations. Bulletin No. 36, Waterways Experiment Station, Corps of
Engineers, US Army: Vicksburg; 50.
Ingram HAP. 1982. Size and shape in raised mire ecosystems: a geophysical model. Nature 297: 300–303.
Ingram HAP. 1983. In Hydrology, in Ecosystems of the World, Vol. 4A, Mires: Swamp, Bog, Fen and Moor, General Studies, Gore AJP (ed.).
Elsevier: New York; 67–158.
Joray M. 1942. L’Etang de la Gruy`ere: Etude pollenanalytique et stratigraphique de la tourbi`ere. Nat. Lev´e G´eobot. de la Suisse 25: 1–117
(in French).
Konikow LF, Bredehoeft JD, Hassanizadeh SM. 1992. Groundwater models cannot be validated. Advances in Water Resources 15: 75–83.
Landva AO, Korpijaakko EO, Pheeney PE. 1986. Notes on the original Von Post peat and peatland classification system. Paper presented
at Advances in Peatlands Engineering, NRC of Canada, Ottawa, Canada, August 25–26, 1986.
Langmuir D. 1997. Aqueous Environmental Geochemisty. Prentice-Hall: Upper Saddle River, NJ; 600.
McNamara JP, Siegel DI, Galser PH, Beck RM. 1992. Hydrogeologic controls on peatland development in the Malloryville Wetland, New
York (USA). Journal of Hydrology 140: 279–296.
Mitsch WJ, Gosselink JG. 2000. Wetlands. 3rd edn. Wiley: New York; 920.
Ogata A, Banks RB. 1961. A solution of the differential equation of longitudinal dispersion in porous media. Professional Paper 411-A,
USGS: Washington, DC; 7.
Oreskes N. 2000. Why predict? Historical perspectives on prediction in earth science. In Prediction; Science, Decision Making, and the
Future of Nature. Sarewitz D, Pielke Jr RA, Byerly Jr R, (eds). Island Press: Washington, DC; 23–40.
Oreskes N, Shrader-Frechette K, Belitz K. 1994. Verification, validation, and confirmation of numerical models in the earth sciences. Science
263: 641–646.
Price JS, Woo M. 1990. Studies of a subarctic coastal marsh. III. Modelling the subsurface water fluxes and chloride distribution. Journal
of Hydrology 120: 1–13.
Reeve AS, Siegel DI, Glaser PH. 2000. Simulating vertical flow in large peatlands. Journal of Hydrology 227: 207–217.
Remenda VH, van der Kamp G, Cherry JA. 1996. Use of vertical profiles of υ18O to constrain estimates of hydraulic conductivity in a
thick, unfractured aquitard. Journal of Water Resources Research 32: 2979–2987.
Romanowicz EA, Siegel DI, Glaser PH. 1993. Hydraulic reversals and episodic methane emissions during drought cycles in mires. Geology
21: 231–234.
Roulet NT. 1990. Hydrology of a headwater basin wetland: groundwater discharge and wetland maintenance. Hydrological Processes 4:
387–400.
Shotyk W. 1988. Review of the inorganic geochemistry of peats and peatland waters. Earth Science Reviews 25: 95–176.
Shotyk W. 1996. Peat bog archives of atmospheric metal deposition: geochemical evaluation of peat profiles, natural variations in metal
concentrations, and metal enrichment factors. Environmental Reviews 4: 149–183.
Shotyk W, Weiss D, Appleby PG, Cheburkin AK, Frei R, Gloor M, Kramers JD, Reese S, Van Der Knaap WO. 1998. History of atmospheric
lead deposition since 12,370 14C yr BP from a peat bog, Jura Mountains, Switzerland. Science 281: 1635–1640.
Shulze-Makuch D, Carlson DA, Cherkauer DS, Malik P. 1999. Scale dependency of hydraulic conductivity in heterogeneous media. Ground
Water 37: 904–919.
Siegel DI. 1981. Hydrogeologic setting of the glacial Lake Aggasiz peatlands, northern Minnesota. Water-Resources Investigations 81-24,
USGS: Reston; 34.
Siegel DI. 1983. Ground water and the evolution of patterned mires, glacial Lake Agassiz peatlands, northern Minnesota. Journal of Ecology
71: 913–921.
Siegel DI 1993. Ground water hydrology. In The Patterned Peatlands of Northern Minnesota, Wright Jr HE (ed.). University of Minnesota
Press: Minneapolis; 163–173.
Siegel DI, Reeve AS, Glaser PH, Romanowicz EA. 1995. Climate driven flushing of pore water in peatlands. Nature 374: 531–533.
Steinmann P, Shotyk W. 1997a. Chemical composition, pH, and redox state of sulfur and iron in complete vertical porewater profiles from
two Sphagnum peat bogs, Jura Mountains, Switzerland. Geochimica et Cosmochimica Acta 61: 1143–1163.
Copyright  2002 John Wiley & Sons, Ltd. Hydrol. Process. 16, 1047–1064 (2002)
1064 J. M. McKENZIE ET AL.
Steinmann P, Shotyk W. 1997b. Geochemistry, mineralogy, and geochemical mass balance on major elements in two peat bog profiles (Jura
Mountains, Switzerland). Chemical Geology. 138: 25–53.
Toth J. 1963. A theoretical analysis of groundwater flow in small drainage basins. Journal of Geophysical Research 68: 4795–4812.
Von Post L. 1922. Sveriges Geologiska Undersøknings torvinventering och n˚agra av dess hittils vunna resultat (Geological survey of Sweden
peat inventory and some preliminary results). Svenska Mosskulturføreningens Tidsskrift 36: 1–27 (in Swedish).
Waddington JM, Roulet NT. 1997. Groundwater flow and dissolved carbon movement in a boreal peatland. Journal of Hydrology 191:
122–138.
Winston RB. 1994. Models of the geomorphology, hydrology, and development of domed peat bodies. GSA Bulletin 106: 1594–1604.
Winter TC. 1978. Numerical simulation of steady state three-dimensional groundwater flow near lakes. Water Resources Research 14:
245–254.
Yamaguchi H, Ohira Y, Kogure K. 1985. Volume change characteristics of undisturbed fibrous peat. Soils and Foundations 25: 119–134.
Zheng C, Bennett GD. 1995. Applied Contaminant Transport Modeling; Theory and Practice. Van Nostrand Reinhold: New York; 440.
Copyright  2002 John Wiley & Sons, Ltd. Hydrol. Process. 16, 1047–1064 (2002)

More Related Content

What's hot

Exploration and Exploitation Groundwater From Journal and Materials
Exploration and Exploitation Groundwater From Journal and MaterialsExploration and Exploitation Groundwater From Journal and Materials
Exploration and Exploitation Groundwater From Journal and MaterialsMartheana Kencanawati
 
USGS: Can Shale Safely Host U.S. Nuclear Waste?
USGS: Can Shale Safely Host U.S. Nuclear Waste?USGS: Can Shale Safely Host U.S. Nuclear Waste?
USGS: Can Shale Safely Host U.S. Nuclear Waste?Marcellus Drilling News
 
Integrated geophysical methods for groundwater exploration in a k
Integrated geophysical methods for groundwater exploration in a kIntegrated geophysical methods for groundwater exploration in a k
Integrated geophysical methods for groundwater exploration in a kBOURHEN EDDINE AFLI
 
The study of sequence stratigraphy and sedimentary system in Muglad Basin
The study of sequence stratigraphy and sedimentary system in Muglad BasinThe study of sequence stratigraphy and sedimentary system in Muglad Basin
The study of sequence stratigraphy and sedimentary system in Muglad Basiniosrjce
 
Analysis of Microstructural Properties of Pliocene Aquifer in the Benin Forma...
Analysis of Microstructural Properties of Pliocene Aquifer in the Benin Forma...Analysis of Microstructural Properties of Pliocene Aquifer in the Benin Forma...
Analysis of Microstructural Properties of Pliocene Aquifer in the Benin Forma...IOSR Journals
 
forms and distribution of potassium along a toposequence on basaltic soils of...
forms and distribution of potassium along a toposequence on basaltic soils of...forms and distribution of potassium along a toposequence on basaltic soils of...
forms and distribution of potassium along a toposequence on basaltic soils of...IJEAB
 
ENGINEERING GEOLOGY
ENGINEERING GEOLOGYENGINEERING GEOLOGY
ENGINEERING GEOLOGYTarun kumar
 
Geomorphological indicators of climate change zewde alemayehu tilahun
Geomorphological indicators of climate change zewde alemayehu tilahunGeomorphological indicators of climate change zewde alemayehu tilahun
Geomorphological indicators of climate change zewde alemayehu tilahunzewde alemayehu
 
Samec - Regression analysis of relations among main Quaternary environmental ...
Samec - Regression analysis of relations among main Quaternary environmental ...Samec - Regression analysis of relations among main Quaternary environmental ...
Samec - Regression analysis of relations among main Quaternary environmental ...swenney
 
Facies study-of-the-halang-formation-turbidites-in-cibalung-areacimanggu-dist...
Facies study-of-the-halang-formation-turbidites-in-cibalung-areacimanggu-dist...Facies study-of-the-halang-formation-turbidites-in-cibalung-areacimanggu-dist...
Facies study-of-the-halang-formation-turbidites-in-cibalung-areacimanggu-dist...science journals
 
Spatial and temporal hydrochemistry variations of karst water in Gunung Sewu,...
Spatial and temporal hydrochemistry variations of karst water in Gunung Sewu,...Spatial and temporal hydrochemistry variations of karst water in Gunung Sewu,...
Spatial and temporal hydrochemistry variations of karst water in Gunung Sewu,...UniversitasGadjahMada
 
Tools for subsurface analysis
Tools for subsurface analysisTools for subsurface analysis
Tools for subsurface analysisShah Naseer
 

What's hot (18)

Engineering geology of dam
Engineering geology of damEngineering geology of dam
Engineering geology of dam
 
Exploration and Exploitation Groundwater From Journal and Materials
Exploration and Exploitation Groundwater From Journal and MaterialsExploration and Exploitation Groundwater From Journal and Materials
Exploration and Exploitation Groundwater From Journal and Materials
 
USGS: Can Shale Safely Host U.S. Nuclear Waste?
USGS: Can Shale Safely Host U.S. Nuclear Waste?USGS: Can Shale Safely Host U.S. Nuclear Waste?
USGS: Can Shale Safely Host U.S. Nuclear Waste?
 
Chemostratigraphy
ChemostratigraphyChemostratigraphy
Chemostratigraphy
 
Integrated geophysical methods for groundwater exploration in a k
Integrated geophysical methods for groundwater exploration in a kIntegrated geophysical methods for groundwater exploration in a k
Integrated geophysical methods for groundwater exploration in a k
 
The study of sequence stratigraphy and sedimentary system in Muglad Basin
The study of sequence stratigraphy and sedimentary system in Muglad BasinThe study of sequence stratigraphy and sedimentary system in Muglad Basin
The study of sequence stratigraphy and sedimentary system in Muglad Basin
 
Analysis of Microstructural Properties of Pliocene Aquifer in the Benin Forma...
Analysis of Microstructural Properties of Pliocene Aquifer in the Benin Forma...Analysis of Microstructural Properties of Pliocene Aquifer in the Benin Forma...
Analysis of Microstructural Properties of Pliocene Aquifer in the Benin Forma...
 
forms and distribution of potassium along a toposequence on basaltic soils of...
forms and distribution of potassium along a toposequence on basaltic soils of...forms and distribution of potassium along a toposequence on basaltic soils of...
forms and distribution of potassium along a toposequence on basaltic soils of...
 
5_Jerker et al_HESS_2012
5_Jerker et al_HESS_20125_Jerker et al_HESS_2012
5_Jerker et al_HESS_2012
 
ENGINEERING GEOLOGY
ENGINEERING GEOLOGYENGINEERING GEOLOGY
ENGINEERING GEOLOGY
 
Geomorphological indicators of climate change zewde alemayehu tilahun
Geomorphological indicators of climate change zewde alemayehu tilahunGeomorphological indicators of climate change zewde alemayehu tilahun
Geomorphological indicators of climate change zewde alemayehu tilahun
 
Samec - Regression analysis of relations among main Quaternary environmental ...
Samec - Regression analysis of relations among main Quaternary environmental ...Samec - Regression analysis of relations among main Quaternary environmental ...
Samec - Regression analysis of relations among main Quaternary environmental ...
 
Facies study-of-the-halang-formation-turbidites-in-cibalung-areacimanggu-dist...
Facies study-of-the-halang-formation-turbidites-in-cibalung-areacimanggu-dist...Facies study-of-the-halang-formation-turbidites-in-cibalung-areacimanggu-dist...
Facies study-of-the-halang-formation-turbidites-in-cibalung-areacimanggu-dist...
 
Subsidence
SubsidenceSubsidence
Subsidence
 
Introduction of engineering geology
Introduction of engineering geologyIntroduction of engineering geology
Introduction of engineering geology
 
Spatial and temporal hydrochemistry variations of karst water in Gunung Sewu,...
Spatial and temporal hydrochemistry variations of karst water in Gunung Sewu,...Spatial and temporal hydrochemistry variations of karst water in Gunung Sewu,...
Spatial and temporal hydrochemistry variations of karst water in Gunung Sewu,...
 
Cycles of climatic changes
Cycles of climatic changesCycles of climatic changes
Cycles of climatic changes
 
Tools for subsurface analysis
Tools for subsurface analysisTools for subsurface analysis
Tools for subsurface analysis
 

Similar to Hp2002

1-s2.0-S0022169415003698-main
1-s2.0-S0022169415003698-main1-s2.0-S0022169415003698-main
1-s2.0-S0022169415003698-mainMaria Blumstock
 
EGU 2014 Research Abstract
EGU 2014 Research AbstractEGU 2014 Research Abstract
EGU 2014 Research AbstractMaria Blumstock
 
0c9605211e66c2f5be000000
0c9605211e66c2f5be0000000c9605211e66c2f5be000000
0c9605211e66c2f5be000000Thomas Saunders
 
Effects of episodic fluid flow on hydrocarbon migration inth.docx
Effects of episodic fluid flow on hydrocarbon migration inth.docxEffects of episodic fluid flow on hydrocarbon migration inth.docx
Effects of episodic fluid flow on hydrocarbon migration inth.docxtoltonkendal
 
A Review Of Case Studies On Climate Change Impact On Hydrologic Cycle An Ind...
A Review Of Case Studies On Climate Change Impact On Hydrologic Cycle  An Ind...A Review Of Case Studies On Climate Change Impact On Hydrologic Cycle  An Ind...
A Review Of Case Studies On Climate Change Impact On Hydrologic Cycle An Ind...Renee Lewis
 
Paleoecology_Paleolimnology _ Encyclopedia.com.pdf
Paleoecology_Paleolimnology _ Encyclopedia.com.pdfPaleoecology_Paleolimnology _ Encyclopedia.com.pdf
Paleoecology_Paleolimnology _ Encyclopedia.com.pdfArvindKumar904250
 
Mauro Passarella - Doctoral Research Proposal_October 2015
Mauro Passarella - Doctoral Research Proposal_October 2015Mauro Passarella - Doctoral Research Proposal_October 2015
Mauro Passarella - Doctoral Research Proposal_October 2015Mauro Passarella
 
Saltwater intrusion model pompano fl
Saltwater intrusion model pompano flSaltwater intrusion model pompano fl
Saltwater intrusion model pompano flDarrel Dunn
 
High-frequency monitoring of water fluxes hess-20-347-2016
High-frequency monitoring of water fluxes hess-20-347-2016High-frequency monitoring of water fluxes hess-20-347-2016
High-frequency monitoring of water fluxes hess-20-347-2016Meidan Winegram
 
LATE QUATERNARY STRATIGRAPHIC EVOLUTION OF THE NORTHERN GULF OF MEXICO MARGIN
LATE QUATERNARY STRATIGRAPHIC EVOLUTION OF THE NORTHERN GULF OF MEXICO MARGINLATE QUATERNARY STRATIGRAPHIC EVOLUTION OF THE NORTHERN GULF OF MEXICO MARGIN
LATE QUATERNARY STRATIGRAPHIC EVOLUTION OF THE NORTHERN GULF OF MEXICO MARGINDaniel Matranga
 
Hidrodinamica Cardoso&motta marques 2009aeco
Hidrodinamica Cardoso&motta marques 2009aecoHidrodinamica Cardoso&motta marques 2009aeco
Hidrodinamica Cardoso&motta marques 2009aecoCaline Gally
 
Somers et al 2016
Somers et al 2016Somers et al 2016
Somers et al 2016Joe Quijano
 
evaluation of water resources in wadi el natrun, western desert, egypt
evaluation of water resources in wadi el natrun, western desert, egyptevaluation of water resources in wadi el natrun, western desert, egypt
evaluation of water resources in wadi el natrun, western desert, egyptIJEAB
 
Erosion and sedimentation
Erosion and sedimentationErosion and sedimentation
Erosion and sedimentationRohan Smarty
 
GEOG 246 Final paper Campbell & Hargrave
GEOG 246 Final paper Campbell & HargraveGEOG 246 Final paper Campbell & Hargrave
GEOG 246 Final paper Campbell & HargraveBenjamin Campbell
 
Thesis Presentation
Thesis PresentationThesis Presentation
Thesis Presentationtashacowie
 
copetti_carniato_2013
copetti_carniato_2013copetti_carniato_2013
copetti_carniato_2013Luca Carniato
 

Similar to Hp2002 (20)

1-s2.0-S0022169415003698-main
1-s2.0-S0022169415003698-main1-s2.0-S0022169415003698-main
1-s2.0-S0022169415003698-main
 
EGU 2014 Research Abstract
EGU 2014 Research AbstractEGU 2014 Research Abstract
EGU 2014 Research Abstract
 
0c9605211e66c2f5be000000
0c9605211e66c2f5be0000000c9605211e66c2f5be000000
0c9605211e66c2f5be000000
 
Effects of episodic fluid flow on hydrocarbon migration inth.docx
Effects of episodic fluid flow on hydrocarbon migration inth.docxEffects of episodic fluid flow on hydrocarbon migration inth.docx
Effects of episodic fluid flow on hydrocarbon migration inth.docx
 
A Review Of Case Studies On Climate Change Impact On Hydrologic Cycle An Ind...
A Review Of Case Studies On Climate Change Impact On Hydrologic Cycle  An Ind...A Review Of Case Studies On Climate Change Impact On Hydrologic Cycle  An Ind...
A Review Of Case Studies On Climate Change Impact On Hydrologic Cycle An Ind...
 
Paleoecology_Paleolimnology _ Encyclopedia.com.pdf
Paleoecology_Paleolimnology _ Encyclopedia.com.pdfPaleoecology_Paleolimnology _ Encyclopedia.com.pdf
Paleoecology_Paleolimnology _ Encyclopedia.com.pdf
 
Mauro Passarella - Doctoral Research Proposal_October 2015
Mauro Passarella - Doctoral Research Proposal_October 2015Mauro Passarella - Doctoral Research Proposal_October 2015
Mauro Passarella - Doctoral Research Proposal_October 2015
 
Saltwater intrusion model pompano fl
Saltwater intrusion model pompano flSaltwater intrusion model pompano fl
Saltwater intrusion model pompano fl
 
High-frequency monitoring of water fluxes hess-20-347-2016
High-frequency monitoring of water fluxes hess-20-347-2016High-frequency monitoring of water fluxes hess-20-347-2016
High-frequency monitoring of water fluxes hess-20-347-2016
 
2015-Ground water- dams Ikard
2015-Ground water- dams Ikard2015-Ground water- dams Ikard
2015-Ground water- dams Ikard
 
LATE QUATERNARY STRATIGRAPHIC EVOLUTION OF THE NORTHERN GULF OF MEXICO MARGIN
LATE QUATERNARY STRATIGRAPHIC EVOLUTION OF THE NORTHERN GULF OF MEXICO MARGINLATE QUATERNARY STRATIGRAPHIC EVOLUTION OF THE NORTHERN GULF OF MEXICO MARGIN
LATE QUATERNARY STRATIGRAPHIC EVOLUTION OF THE NORTHERN GULF OF MEXICO MARGIN
 
Hidrodinamica Cardoso&motta marques 2009aeco
Hidrodinamica Cardoso&motta marques 2009aecoHidrodinamica Cardoso&motta marques 2009aeco
Hidrodinamica Cardoso&motta marques 2009aeco
 
Somers et al 2016
Somers et al 2016Somers et al 2016
Somers et al 2016
 
evaluation of water resources in wadi el natrun, western desert, egypt
evaluation of water resources in wadi el natrun, western desert, egyptevaluation of water resources in wadi el natrun, western desert, egypt
evaluation of water resources in wadi el natrun, western desert, egypt
 
Erosion and sedimentation
Erosion and sedimentationErosion and sedimentation
Erosion and sedimentation
 
M.Sc. Thesis Published
M.Sc. Thesis PublishedM.Sc. Thesis Published
M.Sc. Thesis Published
 
GEOG 246 Final paper Campbell & Hargrave
GEOG 246 Final paper Campbell & HargraveGEOG 246 Final paper Campbell & Hargrave
GEOG 246 Final paper Campbell & Hargrave
 
Thesis Presentation
Thesis PresentationThesis Presentation
Thesis Presentation
 
Lit Review7
Lit Review7Lit Review7
Lit Review7
 
copetti_carniato_2013
copetti_carniato_2013copetti_carniato_2013
copetti_carniato_2013
 

Recently uploaded

Digital Dentistry.Digital Dentistryvv.pptx
Digital Dentistry.Digital Dentistryvv.pptxDigital Dentistry.Digital Dentistryvv.pptx
Digital Dentistry.Digital Dentistryvv.pptxMohamedFarag457087
 
FAIRSpectra - Enabling the FAIRification of Analytical Science
FAIRSpectra - Enabling the FAIRification of Analytical ScienceFAIRSpectra - Enabling the FAIRification of Analytical Science
FAIRSpectra - Enabling the FAIRification of Analytical ScienceAlex Henderson
 
Thyroid Physiology_Dr.E. Muralinath_ Associate Professor
Thyroid Physiology_Dr.E. Muralinath_ Associate ProfessorThyroid Physiology_Dr.E. Muralinath_ Associate Professor
Thyroid Physiology_Dr.E. Muralinath_ Associate Professormuralinath2
 
Role of AI in seed science Predictive modelling and Beyond.pptx
Role of AI in seed science  Predictive modelling and  Beyond.pptxRole of AI in seed science  Predictive modelling and  Beyond.pptx
Role of AI in seed science Predictive modelling and Beyond.pptxArvind Kumar
 
Bhiwandi Bhiwandi ❤CALL GIRL 7870993772 ❤CALL GIRLS ESCORT SERVICE In Bhiwan...
Bhiwandi Bhiwandi ❤CALL GIRL 7870993772 ❤CALL GIRLS  ESCORT SERVICE In Bhiwan...Bhiwandi Bhiwandi ❤CALL GIRL 7870993772 ❤CALL GIRLS  ESCORT SERVICE In Bhiwan...
Bhiwandi Bhiwandi ❤CALL GIRL 7870993772 ❤CALL GIRLS ESCORT SERVICE In Bhiwan...Monika Rani
 
Use of mutants in understanding seedling development.pptx
Use of mutants in understanding seedling development.pptxUse of mutants in understanding seedling development.pptx
Use of mutants in understanding seedling development.pptxRenuJangid3
 
X-rays from a Central “Exhaust Vent” of the Galactic Center Chimney
X-rays from a Central “Exhaust Vent” of the Galactic Center ChimneyX-rays from a Central “Exhaust Vent” of the Galactic Center Chimney
X-rays from a Central “Exhaust Vent” of the Galactic Center ChimneySérgio Sacani
 
GBSN - Microbiology (Unit 3)Defense Mechanism of the body
GBSN - Microbiology (Unit 3)Defense Mechanism of the body GBSN - Microbiology (Unit 3)Defense Mechanism of the body
GBSN - Microbiology (Unit 3)Defense Mechanism of the body Areesha Ahmad
 
TransientOffsetin14CAftertheCarringtonEventRecordedbyPolarTreeRings
TransientOffsetin14CAftertheCarringtonEventRecordedbyPolarTreeRingsTransientOffsetin14CAftertheCarringtonEventRecordedbyPolarTreeRings
TransientOffsetin14CAftertheCarringtonEventRecordedbyPolarTreeRingsSérgio Sacani
 
CURRENT SCENARIO OF POULTRY PRODUCTION IN INDIA
CURRENT SCENARIO OF POULTRY PRODUCTION IN INDIACURRENT SCENARIO OF POULTRY PRODUCTION IN INDIA
CURRENT SCENARIO OF POULTRY PRODUCTION IN INDIADr. TATHAGAT KHOBRAGADE
 
Efficient spin-up of Earth System Models usingsequence acceleration
Efficient spin-up of Earth System Models usingsequence accelerationEfficient spin-up of Earth System Models usingsequence acceleration
Efficient spin-up of Earth System Models usingsequence accelerationSérgio Sacani
 
Human & Veterinary Respiratory Physilogy_DR.E.Muralinath_Associate Professor....
Human & Veterinary Respiratory Physilogy_DR.E.Muralinath_Associate Professor....Human & Veterinary Respiratory Physilogy_DR.E.Muralinath_Associate Professor....
Human & Veterinary Respiratory Physilogy_DR.E.Muralinath_Associate Professor....muralinath2
 
FS P2 COMBO MSTA LAST PUSH past exam papers.
FS P2 COMBO MSTA LAST PUSH past exam papers.FS P2 COMBO MSTA LAST PUSH past exam papers.
FS P2 COMBO MSTA LAST PUSH past exam papers.takadzanijustinmaime
 
CYTOGENETIC MAP................ ppt.pptx
CYTOGENETIC MAP................ ppt.pptxCYTOGENETIC MAP................ ppt.pptx
CYTOGENETIC MAP................ ppt.pptxCherry
 
FAIRSpectra - Enabling the FAIRification of Spectroscopy and Spectrometry
FAIRSpectra - Enabling the FAIRification of Spectroscopy and SpectrometryFAIRSpectra - Enabling the FAIRification of Spectroscopy and Spectrometry
FAIRSpectra - Enabling the FAIRification of Spectroscopy and SpectrometryAlex Henderson
 
development of diagnostic enzyme assay to detect leuser virus
development of diagnostic enzyme assay to detect leuser virusdevelopment of diagnostic enzyme assay to detect leuser virus
development of diagnostic enzyme assay to detect leuser virusNazaninKarimi6
 
Module for Grade 9 for Asynchronous/Distance learning
Module for Grade 9 for Asynchronous/Distance learningModule for Grade 9 for Asynchronous/Distance learning
Module for Grade 9 for Asynchronous/Distance learninglevieagacer
 
Dr. E. Muralinath_ Blood indices_clinical aspects
Dr. E. Muralinath_ Blood indices_clinical  aspectsDr. E. Muralinath_ Blood indices_clinical  aspects
Dr. E. Muralinath_ Blood indices_clinical aspectsmuralinath2
 
module for grade 9 for distance learning
module for grade 9 for distance learningmodule for grade 9 for distance learning
module for grade 9 for distance learninglevieagacer
 
Terpineol and it's characterization pptx
Terpineol and it's characterization pptxTerpineol and it's characterization pptx
Terpineol and it's characterization pptxMuhammadRazzaq31
 

Recently uploaded (20)

Digital Dentistry.Digital Dentistryvv.pptx
Digital Dentistry.Digital Dentistryvv.pptxDigital Dentistry.Digital Dentistryvv.pptx
Digital Dentistry.Digital Dentistryvv.pptx
 
FAIRSpectra - Enabling the FAIRification of Analytical Science
FAIRSpectra - Enabling the FAIRification of Analytical ScienceFAIRSpectra - Enabling the FAIRification of Analytical Science
FAIRSpectra - Enabling the FAIRification of Analytical Science
 
Thyroid Physiology_Dr.E. Muralinath_ Associate Professor
Thyroid Physiology_Dr.E. Muralinath_ Associate ProfessorThyroid Physiology_Dr.E. Muralinath_ Associate Professor
Thyroid Physiology_Dr.E. Muralinath_ Associate Professor
 
Role of AI in seed science Predictive modelling and Beyond.pptx
Role of AI in seed science  Predictive modelling and  Beyond.pptxRole of AI in seed science  Predictive modelling and  Beyond.pptx
Role of AI in seed science Predictive modelling and Beyond.pptx
 
Bhiwandi Bhiwandi ❤CALL GIRL 7870993772 ❤CALL GIRLS ESCORT SERVICE In Bhiwan...
Bhiwandi Bhiwandi ❤CALL GIRL 7870993772 ❤CALL GIRLS  ESCORT SERVICE In Bhiwan...Bhiwandi Bhiwandi ❤CALL GIRL 7870993772 ❤CALL GIRLS  ESCORT SERVICE In Bhiwan...
Bhiwandi Bhiwandi ❤CALL GIRL 7870993772 ❤CALL GIRLS ESCORT SERVICE In Bhiwan...
 
Use of mutants in understanding seedling development.pptx
Use of mutants in understanding seedling development.pptxUse of mutants in understanding seedling development.pptx
Use of mutants in understanding seedling development.pptx
 
X-rays from a Central “Exhaust Vent” of the Galactic Center Chimney
X-rays from a Central “Exhaust Vent” of the Galactic Center ChimneyX-rays from a Central “Exhaust Vent” of the Galactic Center Chimney
X-rays from a Central “Exhaust Vent” of the Galactic Center Chimney
 
GBSN - Microbiology (Unit 3)Defense Mechanism of the body
GBSN - Microbiology (Unit 3)Defense Mechanism of the body GBSN - Microbiology (Unit 3)Defense Mechanism of the body
GBSN - Microbiology (Unit 3)Defense Mechanism of the body
 
TransientOffsetin14CAftertheCarringtonEventRecordedbyPolarTreeRings
TransientOffsetin14CAftertheCarringtonEventRecordedbyPolarTreeRingsTransientOffsetin14CAftertheCarringtonEventRecordedbyPolarTreeRings
TransientOffsetin14CAftertheCarringtonEventRecordedbyPolarTreeRings
 
CURRENT SCENARIO OF POULTRY PRODUCTION IN INDIA
CURRENT SCENARIO OF POULTRY PRODUCTION IN INDIACURRENT SCENARIO OF POULTRY PRODUCTION IN INDIA
CURRENT SCENARIO OF POULTRY PRODUCTION IN INDIA
 
Efficient spin-up of Earth System Models usingsequence acceleration
Efficient spin-up of Earth System Models usingsequence accelerationEfficient spin-up of Earth System Models usingsequence acceleration
Efficient spin-up of Earth System Models usingsequence acceleration
 
Human & Veterinary Respiratory Physilogy_DR.E.Muralinath_Associate Professor....
Human & Veterinary Respiratory Physilogy_DR.E.Muralinath_Associate Professor....Human & Veterinary Respiratory Physilogy_DR.E.Muralinath_Associate Professor....
Human & Veterinary Respiratory Physilogy_DR.E.Muralinath_Associate Professor....
 
FS P2 COMBO MSTA LAST PUSH past exam papers.
FS P2 COMBO MSTA LAST PUSH past exam papers.FS P2 COMBO MSTA LAST PUSH past exam papers.
FS P2 COMBO MSTA LAST PUSH past exam papers.
 
CYTOGENETIC MAP................ ppt.pptx
CYTOGENETIC MAP................ ppt.pptxCYTOGENETIC MAP................ ppt.pptx
CYTOGENETIC MAP................ ppt.pptx
 
FAIRSpectra - Enabling the FAIRification of Spectroscopy and Spectrometry
FAIRSpectra - Enabling the FAIRification of Spectroscopy and SpectrometryFAIRSpectra - Enabling the FAIRification of Spectroscopy and Spectrometry
FAIRSpectra - Enabling the FAIRification of Spectroscopy and Spectrometry
 
development of diagnostic enzyme assay to detect leuser virus
development of diagnostic enzyme assay to detect leuser virusdevelopment of diagnostic enzyme assay to detect leuser virus
development of diagnostic enzyme assay to detect leuser virus
 
Module for Grade 9 for Asynchronous/Distance learning
Module for Grade 9 for Asynchronous/Distance learningModule for Grade 9 for Asynchronous/Distance learning
Module for Grade 9 for Asynchronous/Distance learning
 
Dr. E. Muralinath_ Blood indices_clinical aspects
Dr. E. Muralinath_ Blood indices_clinical  aspectsDr. E. Muralinath_ Blood indices_clinical  aspects
Dr. E. Muralinath_ Blood indices_clinical aspects
 
module for grade 9 for distance learning
module for grade 9 for distance learningmodule for grade 9 for distance learning
module for grade 9 for distance learning
 
Terpineol and it's characterization pptx
Terpineol and it's characterization pptxTerpineol and it's characterization pptx
Terpineol and it's characterization pptx
 

Hp2002

  • 1. HYDROLOGICAL PROCESSES Hydrol. Process. 16, 1047–1064 (2002) Published online 10 January 2002 in Wiley InterScience (www.interscience.wiley.com). DOI: 10.1002/hyp.345 Heuristic numerical and analytical models of the hydrologic controls over vertical solute transport in a domed peat bog, Jura Mountains, Switzerland Jeffrey M. McKenzie,1 * Donald I. Siegel,1 William Shotyk,2 Philipp Steinmann3 and Gabriele Pfunder4 1 Department of Earth Sciences, Syracuse University, Syracuse, NY 13244, USA 2 Geological Institute, University of Bern, CH-3012 Bern, Switzerland 3 Geological Institute, University of Neuchˆatel, CH-2007 Neuchˆatel, Switzerland 4 Department of Vegetation Ecology and Conservation Ecology, Institute of Plant Physiology, University of Vienna, A-1091 Vienna, Austria Abstract: We report the results of numerical and analytical simulations to test the hypothesis that downward vertical flow of porewater from the crests of domed alpine and kettle bogs controls vertical porewater distributions of major solutes such as Ca and Mg. The domed Etang de la Gru`ere bog (EGr), Switzerland, characterized by a vertical downward gradient of 0Ð04 and stratified layers of peat, is chosen as a field site for the model calibration and evaluation. The middle 4-m section of the 6Ð5 m thick bog peat is heavily humified and has a hydraulic conductivity of ¾10 5Ð6 cm s 1 . Above and below, peat is less humified with a hydraulic conductivity of ¾10 3 cm s 1 . Heuristic finite difference simulations, using Visual MODFLOW, of the bog hydraulics show that the higher conductivity peat at the bog base is critical to create the observed deep, local flow cells that substantively recharge porewater. Model results and Peclet number calculations show that before ¾7000 14 C yr BP diffusion of solutes from underlying mineral soils controlled the vertical distribution of porewater chemistry. From 7000 to ¾1250 14 C BP the porewater chemistry was probably controlled by both upward diffusion and downward advection, and after ¾1250 14 C yr BP porewater chemistry was probably controlled by downward advection. Concentrations of conservative major solutes in the porewaters of alpine, ombrotrophic bogs are the net effect of both downward vertical porewater movement and upward vertical diffusion, the magnitudes of which are delicately poised to the configuration of the bog water table over time and subsurface peat stratigraphy. Copyright  2002 John Wiley & Sons, Ltd. KEY WORDS hydrology; peat; domed bog; solute transport; diffusion; Jura Mountains; Switzerland; numerical modelling; peclet number INTRODUCTION Chemical diffusion and groundwater advection are the two major processes that move water and solutes vertically in peatland soils. The extent to which these processes control solute transport in peatlands depends both on the material properties of the peat and the evolving hydrogeologic setting of the wetland. In this paper, we heuristically explore the interplay between diffusion and advection on the vertical transport of solutes in raised bogs, a major wetland ecosystem type found in expansive circumboreal peatlands, in former glacial kettle lakes, and in other moraine and alpine depressions (Mitsch and Gosslink, 2000). Raised bogs are wetlands where peat soil accumulates to form a distinct dome-like shape, rising above surrounding mineral soils or other wetland landforms (Clymo, 1983; Ingram, 1983; Roulet, 1990; Siegel, 1981, 1983). Raised bogs are acidic environments that mostly obtain their water from precipitation. The acid * Correspondence to: J. M. McKenzie, Department of Earth Sciences, 204 Heroy Geology Laboratory, Syracuse University, Syracuse, NY 13244, USA. E-mail: jmmckenz@syr.edu Received 27 June 2000 Copyright  2002 John Wiley & Sons, Ltd. Accepted 21 February 2001
  • 2. 1048 J. M. McKENZIE ET AL. conditions of raised bog surface waters evolve mostly from the dissociation of organic acids in porewater and Sphagnum (Shotyk, 1988; Steinmann and Shotyk, 1997a). Raised bogs are important repositories for long-term atmospheric data on anthropogenic change (Shotyk et al., 1998), and their subsurface hydrology is an ideal setting to address the question: under what hydrologic conditions does chemical diffusion or advection control vertical solute transport in peat? Raised bogs are ideal settings to address this question because their morphology changes with time from relatively flat fens that are later covered by domed bog peat. Fens are circumneutral ecological communities that receive most of their solutes from groundwater discharge and first colonize most wetland settings. Fens gradually develop a groundwater mound which leads to downward advective flow of water in peat near the land surface, deflecting previous upward groundwater motion (McNamara et al., 1992). The Dupuit–Forcheimer approach, often used to model porewater flow in domed bogs (Armstrong, 1995; Hilbert et al., 2000; Ingram, 1982; Winston, 1994), assumes that the groundwater flow is horizontal, the hydraulic gradient is equal to the slope of the water table, and the vertical hydraulic gradient is zero. However, this approach has been challenged as inexact because it does not incorporate downward recharge of porewater that theoretically occurs whenever the water table forms a mound, such as is found under raised bogs (e.g. Siegel, 1981, 1983). For example, field studies on the hydrogeology and geochemistry of large (several kilometre in diameter) raised bogs in the vast mire of the Glacial Lake Agassiz Peatlands, northern Minnesota, USA, have confirmed that porewater moves vertically downward and sometimes upward at bog crests, potentially flushing the bog peat columns within a decade under appropriate climatic conditions (Glaser et al., 1997; Siegel et al., 1995). Knowing how dissolved solids, dissolved gases and trace metals move vertically through peat is important to understand the complexity of nutrient, carbon and other cycles and the controls over the ecological changes in wetlands (Glaser et al., 1997; Price and Woo, 1990; Waddington and Roulet, 1997). Although vertical porewater flow clearly occurs under bogs in the Glacial Lake Agassiz Peatlands, similar studies are scant for the more common raised bogs found in alpine kettle lake settings in glaciated regions. McNamara et al. (1992) heuristically modelled the advective reversal from upward to downward flow under the crest of a raised bog (New York, USA) that evolved in a groundwater discharge zone. There, groundwater seeps continue to discharge from the steep proximate mineral soil outcrops that surround the bog, while under the bog, advective flow is downward deep into the peat. We present the results of a study designed to extend the heuristic modelling approach developed by McNamara et al. (1992) to groundwater flow and solute transport at raised bogs not underlain by pervasive groundwater discharge zones. Instead we focus our study on raised bogs that formed in flatter areas under conditions where diffusive transport of solutes upward from mineral soils will first predominate, as opposed to advective transport. We specifically test the hypothesis that diffusive upward transport ultimately changes to net advective downward flux as the water table mounds in bogs grow, and that the time when this transition occurred in the history of the bog can be heuristically estimated, if not exactly determined. We further explore the manner by which changes in peat material properties may affect when the transition from diffusive to advective transport occurs. Numerical and solute transport models may not accurately predict water and chemical mass movement in peatlands or any other hydrogeologic setting in detail, because of uncertainties in low flow veloci- ties, evolving surface morphology and boundary conditions with time, and spatial distributions of mate- rial properties such as hydraulic conductivity (Schulze-Makuch et al., 1999; Bredehoeft and Konikow, 1993; Konikow et al., 1992; Oreskes et al., 1994; Oreskes, 2000). Flow and transport models, how- ever, have and are being extensively used to heuristically determine the fundamental controls over physical and chemical processes operating in hydrogeologic systems. These models, designed as learn- ing tools rather than predictive devices, have led to new conceptual paradigms for the hydrogeol- ogy of many settings, notably wetlands (e.g. Winter, 1978; Siegel, 1993; Ingram, 1982; Reeve et al., 2000). Copyright  2002 John Wiley & Sons, Ltd. Hydrol. Process. 16, 1047–1064 (2002)
  • 3. SOLUTE TRANSPORT IN PEAT 1049 STUDY AREA We chose to heuristically model the hydrogeologic evolution and solute transport mechanisms at the Etang de la Gru`ere (EGr) bog, located near the crest of a glacially eroded anticline in the Jura Mountains, Switzerland (Figure 1) and for which there are excellent profiles of porewater chemical composition (Steinmann and Shotyk, 1997a; Shotyk, 1996). The bog is 1005 m above sea level, receives 1300 mm of precipitation each year and has an average annual temperature of 5Ð5 °C. The bog is 22Ð5 ha, and is partially surrounded by a shallow artificial lake. The diameter of the bog is 300 m, and peat thickness increases from 2Ð5 m at the bog edge to 6Ð5 m at the bog centre (Joray, 1942; Steinmann and Shotyk, 1997a). The aspect ratio (the bog height divided by diameter) is 0Ð01, compared to 0Ð005 to 0Ð01 for large raised bogs with 1000 mm of precipitation per year (Hobbs, 1986). The EGr bog overlies siliceous clay underlain by a calcareous, karstic plateau, eroded at the anticline crest. The siliceous clay sediments consist of ¾40% clay, ¾40% quartz, as well as small amounts of plagioclase, K-feldspar and carbonates (<5% each) (Steinmann and Shotyk, 1997b). The underlying sediments dip slightly from north to south (Joray, 1942) and the basal peat has been dated at 12 370 š 50 14 C yr BP, corresponding to ¾14 457 calibrated years BP (Shotyk et al., 1998). The EGr peat is stratified into multiple layers of varying humification. Based on the Von Post (Landva et al., 1986; Von Post, 1922) peat classification system (a scale from H1 to H10, with nonhumified peat classified as H1 and completely humified peat as H10), a H8 peat unit peat lies between 130 and 420 cm depth. Below and above the H8 unit is less decomposed peat, at H3–H5 humification (Steinmann and Shotyk, 1997a). EGr Bog, Dom edGru re Lake è 0 100 200 m 1 2 Sampling Sites 1 Bog Crest 2 Bog Flank EGr Bog Bern Zurich Geneva Switzerland N A A’ Upland Upland Blanket Bog Upland 0 m 100 m 200 m Figure 1. Map of Etang de la Gru`ere bog, with the locations of the three nested piezometers used for sampling and hydraulic head measurements. The bog crest is the location of sampling for geochemical profiles and age dating (Shotyk et al., 1998). Line A–A0 is the location of the numerical model cross-sections Copyright  2002 John Wiley & Sons, Ltd. Hydrol. Process. 16, 1047–1064 (2002)
  • 4. 1050 J. M. McKENZIE ET AL. METHODS Field analysis We needed representative, although not comprehensive, hydraulic information from the bog crest to constrain our heuristic models, and chose to use the approach established by others for qualitative calibration of bog hydrogeologic heuristic models (e.g. McNamara et al., 1992; Siegel et al., 1995). Four 50-cm long sections of peat were collected from the crest of the EGr bog at 20–70 cm (H4–H5), 200–250 cm (H8), 450–500 cm (H4) and 550–600 cm (H3) depths to obtain values for vertical hydraulic conductivity of the major stratigraphic zones in the peat. The cores were obtained with a 5-cm radius, semicircular, stainless steel, Belarus corer (Belokopytov and Beresnevich, 1955), and were wrapped in multiple layers of cellophane and stored in split PVC tubes at 4 °C. They remained wet in storage, and there was no indication of degassing or oxidation as would be shown by discoloration on the core edges. One piezometer nest was installed at the EGr bog crest and another on the bog flank as a lateral control. The elevations of the piezometer nests were surveyed relative to the elevation of the surrounding lake. The piezometers were installed using the methods described by Chason and Siegel (1986) and consisted of 1Ð1-cm diameter casing and screen lengths of 5 to 10 cm. The piezometers were used to measure the vertical and horizontal hydraulic gradients and for field experiments to determine horizontal hydraulic conductivity. The water table was measured with a piezometer screened from the bog surface to 100-cm depth. Water levels in all of the piezometers were recorded 20 times between July 1, 1997 and August 31, 1998. Horizontal hydraulic conductivity was determined using slug and bail tests and the data were analysed using the Hvorslev method (Hvorslev, 1951). This method leads to qualitative, order-of-magnitude values for horizontal hydraulic conductivity because the parameter is measured only tens of centimetres from the casing (e.g. Butler and Healy, 1998) but the horizontal flow paths are hundreds of metres long. Steinmann and Shotyk (1997a) used peepers to obtain detailed porewater profiles. These devices allow in situ chemical equilibration between deionized water and porewater across 0Ð2-µm filter paper, rather than extracting water from pore spaces directly. Laboratory analysis Vertical hydraulic conductivity was measured from falling-head tests on sealed peat cores in a Darcy apparatus (Freeze and Cherry,1979). Sections of core, 10–15 cm long, were set in a 12Ð5-cm diameter PVC tube using paraffin wax as described by Hoag and Price (1997). Water was run through the apparatus from the bottom upwards to force out trapped air. The peat was kept continually saturated, including during storage by refrigeration, to avoid shrinkage, a situation that might break the peat–wax seal. In contrast to the value for horizontal hydraulic conductivity, determined by slug tests, the laboratory tests for vertical hydraulic conductivity are more certain because the length of the peat sampled is a significant fraction of the total flow path length in the vertical peat column. Batch experiments were used to obtain distribution coefficients for sorption of calcium and magnesium to the EGr peat. The results from batch experiments were fit to the Freundlich distribution that assumes an infinite sorption capacity of the solid matrix (Zheng and Bennett, 1995). The Freundlich distribution coefficient is defined as (Fetter, 1999): CŁ D KCa 1 where CŁ is the amount of solute sorbed onto the solid phase, C is the concentration of the solute in solution, and K, a are empirical constants found by fitting a line to a plot of C as a function of CŁ . The distribution coefficient, K, is defined as the mass of solute on the solid phase per unit mass of solid phase divided by the concentration of solute in solution and has the units of volume per mass (e.g. ml g 1 ). A retardation coefficient, R, used as a sink term for removing solutes in advective–dispersive analytical models, is calculated as follows (Zheng and Bennett, 1995): R D 1 C b ne aKCa 1 2 Copyright  2002 John Wiley & Sons, Ltd. Hydrol. Process. 16, 1047–1064 (2002)
  • 5. SOLUTE TRANSPORT IN PEAT 1051 where b is bulk density of the porous material, ne is the effective porosity (from Hoag and Price, 1997), K and a are found empirically [Equation (1)], and C is the concentration of the dissolved concentration of the solute. The retardation coefficient equation is nonlinear because the Freundlich isotherm is a function of the dissolved concentrations. The experimental method for the batch experiments was modified from Day et al. (1979). Peat samples were air dried for 36 to 48 h. The samples were ground to a powder using a mortar and pestle, mixed with 0Ð5 N hydrochloric acid and shaken with a wrist action shaker for 1 h. The solution was then filtered, and the soil was washed with 400 ml of deionized water and air dried. Approximately 5 g of powdered sample was placed in a test tube, and topped to 20 ml with a solution containing varying amounts of magnesium (0–215 ppm) and calcium (0–2770 ppm). The test tubes were shaken for 48 h using a wrist action shaker. (Preliminary experiments showed that 48 h was ample time for equilibrium to be reached.) The solutions were then filtered with 0Ð45-µm filter paper and analysed using a direct current plasma spectrometer for magnesium and calcium. Distribution coefficients were measured for two different peat decomposition layers: 220–230 and 520–530 cm depth. Analytical modelling Solute transport in porewater is caused by chemical diffusion, fluid advection and/or mechanical dispersion (Freeze and Cherry,1979). The Ogata–Banks equation (Ogata and Banks, 1961) with retardation (Bedient et al., 1994) in one direction is an analytical, solute transport equation: Ci C0 D 1 2 erfc Rl vt 2 p RDlt C 1 2 exp vl Dl erfc Rl C vt 2 p RDlt 3 where Ci/C0 is the relative concentration, l is the distance along the flow path, v is the average linear water velocity, Dl is the coefficient of dispersion, and erfc is the complementary error function. The retardation coefficient, R [Equation (2)], is set to unity for situations with no retardation. If the average groundwater velocity is very slow, Equation (3) reduces to Fick’s Second ‘Law’ of pure diffusion (Freeze and Cherry, 1979). In addition, at very low velocities, diffusion dominates dispersion, and the coefficient of dispersion is equal to the diffusion coefficient (Dl D DŁ ) (Freeze and Cherry, 1979). Porewater data for Ca and Mg (Steinmann and Shotyk, 1997a) were compared to theoretical profiles of diffusion described by the Ogata–Banks equation [Equation (3)] with no advective velocity to test the hypoth- esis that diffusion controls solute transport in the bog. By holding t and Dl constant and changing the length term, a theoretical chemical diffusion profile was calculated. Values for t, 11 425 yr, and DŁ , 10 10 m2 s 1 , were used to model the expected amount of chemical diffusion upward in the peat column. The DŁ value used is the average of the maximum and minimum chemical diffusion coefficients selected as representative values for a peatland setting (Cussler, 1997; Dominico and Schwartz, 1998; Freeze and Cherry, 1979). The concentrations of solutes at the base of the analytical model, at 5Ð4 m depth, were assumed constant. The principle source of cations in the peat porewater is the underlying calcareous sediment. It is reasonable to assume that the Ca and Mg concentrations within 100 cm of the base of the peat (compared to ¾6 m total peat thickness) have been nearly constant since the bog formed. The rates at which Ca and Mg dissolve from granular carbonate minerals are comparable to the rates of solute transport from the base of the bog into the peat column, and are slow enough to maintain chemical equilibrium near the base of the bog (Langmuir, 1997). Numerical modelling Visual MODFLOW was used for the numerical modelling experiments, oriented for cross-sectional flow system analysis (e.g. Freeze and Witherspoon, 1967; Toth, 1963). Visual MODFLOW is a widely used Microsoft Windows based version of the US Geological Survey 3-D Finite Difference Groundwater Flow model, MODFLOW (Harbaugh and McDonald, 1988, 1996). The model of the EGr bog was run at steady state, two-dimensional with eight grid layers divided into four hydrogeologic units representing four stratigraphic Copyright  2002 John Wiley & Sons, Ltd. Hydrol. Process. 16, 1047–1064 (2002)
  • 6. 1052 J. M. McKENZIE ET AL. layers of different humification. The peat units were initially assigned vertical and horizontal hydraulic conductivity values based on the field and laboratory results to guide the heuristic modelling effort. The modelled domain was 6Ð5 m thick at the centre and 2Ð5 m thick at the edges. The topography of the bog water table was adapted from Joray (1942) and from levelling the water table wells. The model had 34 columns evenly spaced over 300 m, except at the edges of the bog where the spacing was halved for better resolution (Figure 2; Tables I and II). The top of the model was a constant head boundary, Dirichlet condition (Bear and Verruijt, 1987), reflecting a steady water table 30 cm below the topographic surface of the bog (Figure 2). The bottom and all sides of the model were considered no-flow boundaries, Neumann conditions (Bear and Verruijt, 1987) (Figure 2). Applying these types of boundary conditions is standard practice with respect to modelling steady-state hydrogeological conditions for wetland settings with pronounced water table mounds (e.g. Winter, 1978; McNamara et al., 1992; Siegel, 1993) and with the absence of notable strong mass fluxes from the sides. 0 30040 80 120 160 200 240 280 0.06.40.91.82.73.64.55.4 0 40 80 120 160 200 240 280 300 0 0.9 1.8 2.7 3.7 6.5 4.6 5.6 High Hydraulic Conductivity, H2-H5 Peat Low Hydraulic Conductivity, H8 Peat High Hydraulic Conductivity, H4 Peat Constant Head Node Sensitivity Analysis Sampling Point Thickness(m) Width (m) Figure 2. The grid network and simulated calibration wells used for the Visual MODFLOW simulations of the present day EGr bog. The bottom and sides of the model are no-flow boundaries, and the constant head layer across the top of the model represents the water table. The hydraulic conductivity units are described in Table II. The calibration wells are simulated wells placed throughout the model domain Table I. Model input parameters for Visual MODFLOW. Descriptions of the hydraulic units are in Table II. (Note: measurements taken below the bog crest) Model A B C D E Model age (14 C yr BP) 0 2000 4500 4250 7000 Model thickness (m) 6Ð5 5Ð5 4Ð5 3Ð5 3Ð0 Number of layers 11 9 8 7 7 Elevation of hydraulic unit 1 (m) 0Ð0–2Ð2 0Ð0–2Ð1 0Ð0–2Ð1 0Ð0–1Ð9 0Ð0–2Ð0 Elevation of hydraulic unit 2 (m) 2Ð2–5Ð5 2Ð1–4Ð0 2Ð1–3Ð5 1Ð9–2Ð5 2Ð0–2Ð0 Elevation of hydraulic unit 3 (m) 5Ð5–6Ð5 4Ð0–5Ð5 3Ð5–4Ð5 2Ð5–3Ð5 2Ð0–3Ð0 Depth to water table (m) 0Ð2 0Ð2 0Ð2 0Ð2 0Ð2 Model diameter (m) 300 300 300 300 300 Number of columns 32 32 32 30 30 Number of cells 352 288 256 210 210 Vertical gradient at crest (from 1 m below bog surface to 1 m above model base) 0Ð04 0Ð025 0Ð02 0Ð009 0Ð001 Copyright  2002 John Wiley & Sons, Ltd. Hydrol. Process. 16, 1047–1064 (2002)
  • 7. SOLUTE TRANSPORT IN PEAT 1053 Table II. Description of hydraulic units used in numerical modelling with Visual MODFLOW Hydraulic unit 1 2 3 Location in EGr bog Bottom Middle Top Calibrated horizontal hydraulic conductivity (cm s 1 ) 10 4Ð5 10 5Ð6 1 Calibrated vertical hydraulic conductivity (cm s 1 ) 10 2Ð2 10 6 10 Calibrated anisotropy ratio (Kh/Kv) 10 3Ð3 2Ð3 0Ð1 Measured horizontal hydraulic conductivity (cm s 1 ) 10 3Ð5 10 5Ð6 Not measured Measured vertical hydraulic conductivity (cm s 1 ) 10 3Ð2 10 4 10 2 Measured anisotropy ratio (Kh/Kv) 0Ð5 0Ð02 Not applicable Degree of decomposition (Von post scale) H3–H4 H8 H1–H4 The numerical model results were fit to the average observed hydraulic head gradients at the bog crest and flank by varying horizontal and vertical hydraulic conductivity values. The average vertical hydraulic head distributions measured at the bog crest and flank remained almost the same, downward, throughout the field season. Vertical reversals of hydraulic head would be expected more at the bog–lake edge where transient flow reversals could occur as the lake rises or falls faster than the adjacent water table. However, the purpose of our research was to determine the hydraulic processes at the bog crest, the point of maximum accumulation of peat and focus of ombrotrophy. Therefore, while we do recognize potential boundary effects at the edge of the bog, calibration at this location is not emphasized in light of our objectives, similar to what was done by McNamara et al. (1992). The dimensionless Peclet number was used to distinguish between the predominance of diffusive or advective mass transport (Remenda et al., 1996). The Peclet number, Pn, is (Freeze and Cherry, 1979): Pn D vd DŁ 4 where v is the average linear velocity, d is the average particle diameter, and DŁ is the diffusion coefficient. Substituting Darcy’s Law, solved for v, into Equation (4) renders: Pn D Kid neDŁ 5 where ne is effective porosity, i is the vertical hydraulic gradient, and K is hydraulic conductivity. If Pn is less than approximately 0Ð02, then solute transport is dominated by longitudinal diffusion, whereas if Pn is greater than 6, then solute transport is dominated by mechanical dispersion and advection (Fetter, 1999). If Pn is between 0Ð02 and 6, transitional conditions may occur (Fetter, 1999). In Equation (5), the hydraulic conductivity, the average particle diameter, the effective porosity and the diffusion coefficient can be held constant. A numerical model can be used to heuristically calculate vertical hydraulic head gradients as the water table mound under the bog grows, and the result can then be applied to the Peclet number to assess if mass transport at any given time is dominated by diffusion or advection. As a starting point for the heuristic Peclet calculation for modern conditions a vertical diffusion coefficient of 10 10 m2 s 1 (Freeze and Cherry, 1979) and an effective porosity of 0Ð25 (Hoag and Price, 1997) were used and an average pore diameter of 1 mm was used, based on data obtained from similar peat soil types (Yamaguchi et al., 1985). For the Peclet calculation a vertical hydraulic conductivity of 10 5Ð3 cm s 1 and a vertical hydraulic gradient calculated from the numerical cross-sectional model, calibrated by changing the estimated values for vertical and horizontal hydraulic conductivities in each hydrologic unit, were used. Then, the profile of the bog water table was changed to reflect the growth of the bog. The water table configuration was based on the age of the peat, determined by radiogenic dating (Shotyk et al., 1998). It was assumed that the width of the bog was effectively the same over time and that the shape of the water table mound historically was simply an increasingly subdued replicate of the modern setting. Copyright  2002 John Wiley & Sons, Ltd. Hydrol. Process. 16, 1047–1064 (2002)
  • 8. 1054 J. M. McKENZIE ET AL. Sensitivity analysis investigated the effects of varying the hydraulic conductivity on the modelled hydraulic head of the EGr bog. After the modelled head values at the piezometer locations were matched, the hydraulic head was noted at nine sampling points in the numerical model domain (Figure 2). The hydraulic head data for each sampling point was set arbitrarily to the computed head value at that location. Horizontal and vertical hydraulic conductivity values for each hydraulic unit were then varied individually, and a measurement of sensitivity of the simulated hydraulic head to hydraulic conductivity was calculated using the following equation (Anderson and Woessner, 1992; Zheng and Bennett, 1995): Xi D RMSi,changed RMSoriginal 6 where Xi is the measure of sensitivity as a result of a change in parameter i, RMSi,changed and RMSoriginal are the root-mean-squared error of the hydraulic head for the perturbed and original model respectively. The root-mean-squared error for a given model perturbation, i, is (Anderson and Woessner, 1992): RMS D 1/n n i hm hs 2 i 7 where n is the number of samples, and hm hs is the difference between the perturbed and original hydraulic heads at the sampling points. RESULTS Peat properties Upon extraction, the 20 to 70 cm depth core roughly consisted of two sections: a light brown, loose Sphagnum, H4 peat section from 20 to 40 cm depth, and a dark brown to black layer, H5, with wood material from 40 to 70 cm depth. The second core, from 200 to 250 cm depth, had no noticeable stratigraphic breaks, was black, and H8 peat. The third core, from 450 to 500 cm depth, was in two sections: Carex dominated, H4 peat from 450 to 480 cm depth, and slightly broken up Sphagnum and Carex, H4 peat to the end of the core. The fourth core, from 550 to 600 cm depth, had H3 peat and a gradual transition to light brown moss in the bottom 20 cm. Hydraulic gradients The gradients at the bog crest (Figure 3) and on the bog flank (not shown) were, on average, 0Ð04 downwards. The average vertical head gradient at the crest of the EGr bog is downward (Figure 3a), although seasonally, vertical head gradients change (Figure 3b). The hydraulic gradient at the bog flank is downward through most of the measurement period and fluctuated less than at the bog crest. Hydraulic properties The geometric mean of the horizontal hydraulic conductivity (n D 7) from the centre well-humified peat section, 1Ð0 to 4Ð3 m depth, is 10 5Ð6 cm s 1 , the minimum is 10 6Ð5 cm s 1 and the maximum is 10 4Ð5 cm s 1 . The horizontal hydraulic conductivity of the underlying less humified layer, 5Ð5 to 6Ð5 m depth, is 10 3Ð5 cm s 1 (n D 1). From the falling head tests, the vertical hydraulic conductivity was measured as 10 2 cm s 1 at 0Ð5 m depth, 10 4 cm s 1 at 2Ð5 m depth, and 10 3Ð2 cm s 1 at 4Ð6 m depth. The weighted average of the vertical hydraulic conductivity is 10 3Ð8 cm s 1 . Figure 4 displays the horizontal, vertical hydraulic conductivity values, and those predicted from peat bulk density with depth. Copyright  2002 John Wiley & Sons, Ltd. Hydrol. Process. 16, 1047–1064 (2002)
  • 9. SOLUTE TRANSPORT IN PEAT 1055 0 10 20 30 40 50 7/1/97 8/10/97 9/19/97 10/29/97 12/8/97 1/17/98 2/26/98 4/7/98 5/17/98 6/26/98 8/5/98 9/14/98 Date Depth,BelowBogSurface,toWater(cm) Water Table 150 cm depth 250 cm depth 550 cm depth ? ? ? ? ? DepthBelowBogSurface(cm) Measured Pressure Head (cm) FlowEquilibrium DownwardGradient Upward Gradient StandardDeviationofMeasurements Average −30 −25 −20 −15 −10 −5 0 5 10 0 100 200 300 400 500 600 a) b) Figure 3. Hydraulic head measurements at the bog crest (a) with depth and (b) through time. The hydraulic head measurements were made with piezometers inserted to depths of 150, 250 and 550 cm. The water table was measured with a PVC tube that was fully slotted from a depth of 0 to 100 cm below the land surface. Part (a) shows the general trend of the vertical hydraulic head is downwards, with an average hydraulic gradient of 0Ð04 Copyright  2002 John Wiley & Sons, Ltd. Hydrol. Process. 16, 1047–1064 (2002)
  • 10. 1056 J. M. McKENZIE ET AL. Hydraulic Conductivity (cm/s) EstimatedBulkHydraulicConductivity HorizontalHydraulicConductivity VerticalHydraulicConductivity Depth(cm) 100 200 300 400 500 600 0 10 −6 10 −10 10 −8 10 −2 10 −4 10 −0 Figure 4. Summary of hydraulic conductivity values with depth. Values for vertical hydraulic conductivity were found from variable head tests, horizontal hydraulic conductivity from Darcy experiments, and estimated hydraulic conductivity based on bulk density (Steinmann and Shotyk, 1997a) Adsorption experiments The sorption data was fit to the nonlinear Freundlich sorption isotherm using Sigma Plot, a scientific graphing program. The distribution coefficients at 220 to 230 cm depth were 0Ð0025 and 0Ð016 ml g 1 for Mg and Ca respectively. The distribution coefficients at 520 to 530 cm depth were 0Ð0003 and 0Ð019 ml g 1 for Mg and Ca respectively. The retardation coefficients for Ca and Mg at both depths ranged from 1Ð0 to 5Ð3 for dissolved solute concentrations of 20 to 0Ð0001 ppm. Analytical modelling Figure 5 summarizes the results of the analytical 1-D model for solute transport by chemical diffusion with and without retardation. Numerical modelling The flow net from the calibrated numerical flow model for the modern bog is shown in Figure 6a. The values of vertical and horizontal hydraulic conductivity observed and used in the calibrated model are in Table II. The calibrated values of the horizontal hydraulic conductivity of the bottom layer, 10 4Ð5 cm s 1 , and the vertical hydraulic conductivity of the middle layer, 10 6 cm s 1 , were smaller than the observed, 10 3Ð5 and 10 4 cm s 1 respectively. The calibrated values of the vertical hydraulic conductivity of the bottom hydraulic unit, 10 2Ð2 cm s 1 , and the top hydraulic unit, 10 cm s 1 , are larger than the observed, 10 3Ð2 and 10 2 cm s 1 respectively. The calibrated and observed vertical hydraulic conductivities of the horizontal hydraulic conductivity of the middle hydraulic unit are the same, 10 5Ð6 cm s 1 , and the horizontal hydraulic conductivity of the top layer was not measured. In our sensitivity analysis, we varied the horizontal and vertical hydraulic conductivity of individual hydraulic units by factors of 5 and 10. The results of the sensitivity analysis are presented in Figure 7. The EGr bog was then modelled to evaluate changes in vertical hydraulic gradient with growth of the EGr dome. In addition to the modern scenario, heuristic models were run for bogs with a thickness of 5Ð5, 4Ð5, 3Ð5 and 3Ð0 m, corresponding to approximate ages of 2000, 4500, 6250 and 7000 14 C yr BP (Figure 6). As Copyright  2002 John Wiley & Sons, Ltd. Hydrol. Process. 16, 1047–1064 (2002)
  • 11. SOLUTE TRANSPORT IN PEAT 1057 0 0.2 0.4 0.6 0.8 1 Depth(m) Relative Concentration (Ci /Co ) 1.0 0.0 2.0 3.0 4.0 5.0 6.0 7.0 Peat Soil Mineral Soil Ca Observed Mg Observed Calculated Diffusion Only (D*=10 m s )−10 2 −1 Calculated Diffusion + Retardation (D*=10 m s ; R=10)−10 2 −1 Calculated Diffusion + Retardation (D*=10 m s ; R=35) −10 2 −1 Figure 5. Measured porewater concentrations of Ca and Mg versus analytically modelled diffusion profiles (Ogata–Banks equation with and without retardation). The ordinate value for concentration is equal to the concentration at depth, Ci, divided by the concentration at the base of the profile, C0. The Ci for Ca and Mg is 798Ð3 and 101Ð6 µM respectively. The results show that a retardation factor of 35 is needed for the analytical results to match the measured porewater profiles the thickness of the bog decreased from 6Ð5 to 3Ð0 m, the vertical gradients decreased from 0Ð04 to 0Ð001 (Table I; Figure 6). INTERPRETATION The EGr bog has a groundwater mound that rises approximately 4Ð0 m above the surrounding lake. The measured downward hydraulic gradients in it are consistent with what is expected for lake–groundwater interaction when such a mound is present (Winter, 1978). Although the head gradient is generally downward at the bog crest, the gradient does seasonally change. These short-term changes in the vertical hydraulic gradients at the EGr bog crest are consistent with the hypothesis of episodic methane build-up and ebullition from the peat causing overpressuring in the centre of the peat column (Romanowicz et al., 1993; Glaser et al., Copyright  2002 John Wiley & Sons, Ltd. Hydrol. Process. 16, 1047–1064 (2002)
  • 12. 1058 J. M. McKENZIE ET AL. Flow Direction Arrow 0 30040 80 120 160 200 240 280 0.06.52.74.5 3.5 3.5 4.0 4.0 4.5 4.5 5.0 5.0 5.5 5.5 6.0 6.0 0 30040 80 120 160 200 240 280 0.04.51.83.0 2.6 2.6 2.8 2.8 3.0 3.0 3.2 3.2 3.4 3.4 3.6 3.6 3.8 3.8 4.0 4.0 4.2 4.2 0 30040 80 120 160 200 240 280 0.03.51.52.5 2.6 2.6 2.7 2.7 2.8 2.8 2.9 2.9 3.0 3.0 3.1 3.1 3.2 3.2 0 30040 80 120 160 200 240 280 0.03.01.22.0 2.6 2.6 2.6 2.6 2.6 2.6 2.7 2.7 2.7 2.7 a) Model A b) Model B c) Model C d) Model D e) Model E 0 30040 80 120 160 200 240 280 0.05.51.42.84.2 3.0 3.0 3.5 3.5 4.0 4.0 4.5 4.5 5.0 5.0 Water Table Hydraulic Conductivity Unit Boundary Line of Equipotential6.3 Horizontal Distance (m) Horizontal Distance (m) Horizontal Distance (m) Horizontal Distance (m) Horizontal Distance (m) Elevation(m)Elevation(m)Elevation(m)Elevation(m)Elevation(m) Figure 6. Flownet output of the Visual MODLFLOW models demonstrating the decrease in vertical hydraulic gradient with a decrease in the thickness of the EGr model dome. In the models, all of the hydraulic conductivity values were held constant but the thickness of the hydraulic units was varied. The resultant vertical gradients at the bog crest are 0Ð036, 0Ð025, 0Ð019, 0Ð0091 and 0Ð001 for models (a), (b), (c), (d) and (e) respectively. The model input parameters are tabulated in Tables I and II 1997). However, during this project, no measurements of methane or other gases were made, so this hypothesis needs to be further tested. In any case, in general, vertical head gradients are almost always downward and sufficient to drive advective flow. Copyright  2002 John Wiley & Sons, Ltd. Hydrol. Process. 16, 1047–1064 (2002)
  • 13. SOLUTE TRANSPORT IN PEAT 1059 10 −1.0 10 −0.7 -10 −6.7 -10 −6.8 10 −2.0 10 −1.6 10 −1.4 10 −1.3 −10 −4.3 10 −3.5 10 −4.2 10 −4.2 0 0.02 0.04 0.06 0.08 0.1 0.12 0.14 0.16 0.18 0.2 MeasureofSensitity, Xi Bottom Layer, Kh Bottom Layer, Kv Middle Layer, Kh Middle Layer, Kv Top Layer, Kh Top Layer, Kv Varied Parameter, i Hydraulic Conductivity Changed by x 5 Hydraulic Conductivity Changed by x 10 Layer, Kh Figure 7. Sensitivity analysis of the EGr bog numerical model, shown as a graph of changes in the sensitivity of the calculated heads to changes in material properties of the peat. The figure indicates that the model is most sensitive to the horizontal hydraulic conductivity of the bottom layer, followed by both the vertical and horizontal hydraulic conductivity of the middle layer The field values for horizontal hydraulic conductivity of EGr peat are similar to that found elsewhere, in the range of 10 4 to 10 3 cm s 1 (Chason and Siegel, 1986). However, the anisotropy ratio (horizontal hydraulic conductivity divided by vertical hydraulic conductivity) <1 (Figure 4) is unusual. The majority of porous materials, including those in wetlands, have anisotropy ratios greater than unity (e.g. Chason and Siegel, 1986; Freeze and Cherry, 1979). There are two possible explanations for the inverse anisotropy in the EGr bog. First, the vertical hydraulic conductivity experiments may have failed due to poor seals between the peat and the surrounding paraffin wax. However, bubbles or other fluids were not seen moving through the wax seal during the experiments; therefore a failed seal is not plausible. Second, the peat profile from the surface to a depth of 420 cm contains significant remains of Eriophorum (Joray, 1942), a grass with a decay resistant base and long, fine fibres. These stalks and fibres are preserved in their original, upright orientation, probably creating secondary pathways that pipe water in the vertical direction. When the EGr bog cores were split, the vertical orientation of this plant macrofossil was readily apparent. The porewater of the EGr bog has decreasing concentrations of major solutes from the base of the peat profile to the surface (Figure 5). Considering the hydrogeologic isolation of the dome from the surrounding topography, the only major source of high concentrations of solutes in the porewater is the underlying sediments. The three possible modes of upward transport for solutes are diffusion, upward advection driven by an upward porewater flow, and/or transverse dispersion driven by a horizontal flow (Reeve et al., 2000). Copyright  2002 John Wiley & Sons, Ltd. Hydrol. Process. 16, 1047–1064 (2002)
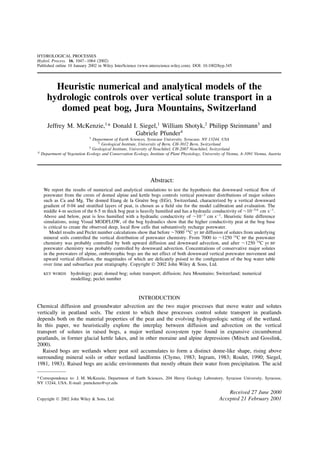
  • 14. 1060 J. M. McKENZIE ET AL. The analytical models (Figure 5) show that the solutes, given the age of the lower peat sediments, simply could not have migrated upward by diffusion. The modelled diffusion profiles in all cases show more diffusion (i.e. the profile rises higher in the peat profile from the mineral soil base) than shown by the profiles of the measured solute concentrations. All measured solute profiles plot below plausible theoretical diffusion profiles, even the analytical one-dimensional model with a maximum plausible retardation factor of 10. Hoag and Price (1997) found that the maximum retardation factor for base cations in well-humified peat is 7Ð3, indicating that our analytic model results (with a retardation factor of 35) are not a plausible representation of solute transport in the EGr bog. Finally, the retardation factors for Ca and Mg from the batch experiments range from approximately 1 to 5Ð3, thereby confirming that a retardation factor of 35 is unrealistic. Reeve et al. (2000) show that horizontal flow, given sufficient time and distance, can create extensive transverse dispersion. The result of this process in the EGr bog would be increased upward movement of solutes into the peat profile from the mineral soil. However, the results of our study show that the upward movement of solutes is less than predicted, with or without dispersion from horizontal flow. The occurrence of transverse dispersion is difficult to estimate, but it will lead to an underestimation of the downward vertical flow. Porewater solutes did not diffuse high into the peat profile because downward advection of pore water prevented it. The measured downward gradient at the bog crest is 4% (0Ð04). Assuming an effective porosity of 0Ð25 and using the weighted average of the measured vertical hydraulic conductivity values (10 3Ð8 cm s 1 ), the average linear velocity is ¾2 cm day 1 downwards. The Visual MODFLOW simulation shows that flow paths originate at the bog crest, move downward, and then return to the bog flanks. These results are similar to those by Freeze and Witherspoon (1967) who prepared numerical models of regional groundwater flow in mineral soils including a buried layer of high hydraulic conductivity. Reeve et al. (2000) recently found that sand and gravel layers below large peatlands, such as the Glacial Lake Agassiz Peatlands, similarly influence the groundwater flow cells at a much larger scale. The model results and sensitivity analysis further show that groundwater flow in the bog peat is most sensitive to the horizontal hydraulic conductivity of the bottom layer, followed by the horizontal and vertical hydraulic conductivities of the middle layer (Figure 7). The hydraulic head did not change significantly when changes in other model parameters, including the depth of the lake or even the absence/presence of the lake, were made. Total mass transport in the bog hydrogeologic setting is, of course, still dominated by horizontal flow. Flow lines that originate at the bog crest travel down to the bottom high hydraulic conductivity layer, laterally to the edge of the model, and then upwards to the constant head boundary representing the lake. Flow paths that originate on the bog flanks travel downward slightly, move nearly parallel to the bog surface, and at the bog edge the water is discharged to the lake edge due to the change in slope of the bog surface near the lake. The modern Peclet number defining the condition of vertical solute transport at the bog crest is 8Ð0, based on present day values for the vertical downward gradient. Holding the bog peat material properties constant, the Peclet number equation reduces to a function of the vertical hydraulic gradient, controlled by the doming of the bog, and a constant based on the physical properties of the peat [Equation (5)]. Reducing the value for the hydraulic gradient from 0Ð04 to <0Ð001 would theoretically result in pure diffusive solute transport. At EGr, the modelled vertical hydraulic gradient of 0Ð001 was heuristically calculated for a bog only 3Ð0 m thick, 7000 14 C yr BP. Therefore, before 7000 14 C yr BP, the porewater chemistry of the EGr bog was controlled purely by upward diffusion. From 7000 to ¾1250 14 C yr BP the porewater chemistry was controlled by both upward diffusion and downward advection. For the past ¾1250 14 C yr, solute transport in the EGr bog has been dominated by downward advection (Figure 8). Uncertainties There is obviously uncertainty in the parameters used for the analytical, numerical and Peclet number modelling. We chose parameters that we felt were most plausible for the hydrogeologic setting of the bog. Copyright  2002 John Wiley & Sons, Ltd. Hydrol. Process. 16, 1047–1064 (2002)
  • 15. SOLUTE TRANSPORT IN PEAT 1061 D/D*(log)l vd/D* 0.2 Diffusion Transition Conditions Advection/ Mechanical Dispersion 7000CyrBP14 6250CyrBP14 4500Cyrbp14 2000Cyrbp14 6.0 Present Future Figure 8. The Peclet number combined with the results of the variable thickness models. The theoretical Peclet number analysis shows the change from diffusion to advective controlled transport of porewater solutes through time. The basal peat of the EGr bog is 12 000 14C yr old For example, our assumed value for DŁ is consistent with the value commonly used in solute transport calculations (e.g. Freeze and Cherry, 1979) in like environments, and our assumed value and method of measurement for hydraulic conductivity is consistent with practice (e.g. Chason and Siegel, 1986). For the Peclet number analysis, we assumed that the calibrated vertical hydraulic conductivity of the modern hydrogeologic numerical flow model was the most appropriate one to use. We calibrated to the observed head distributions by varying hydraulic conductivity; the boundary conditions of the bog margins, water table and lower no-flow boundary were fixed at steady state, and only the hydraulic conductivity was used to make the calibration as is typical in doing heuristic (or even transient) models (Anderson and Woesner, 1992). We then optimized the modern Peclet number to ensure that advective flow occurs in the peat profile today, based on modern field data, and that diffusion controlled solute transport when the bog initially domed 10 000 years ago, which is heuristically sensible from first principles, given a nearly flat water table. It is clear that when the bog first formed, the upward diffusive flow of solutes was the dominant transport mechanism because there was no to minimal groundwater mounding that would drive recharge downward. It is also clear that modern downward advection of ground water now inhibits upward diffusion; otherwise, the measured solute profiles would match diffusion profiles. The fundamental question remains: what combination of hydraulic properties can lead to downward advection today? We attempt to resolve this issue by testing the sensitivity of changing the parameters in the Peclet number to obtain values greater than 6Ð0, indicating advection is the dominant transport process. Of the material properties used to calculate the Peclet number, the widest potential range in values are for the coefficient of dispersion which can span two orders of magnitude and for the vertical hydraulic conductivity. For example, assuming the lowest plausible value for vertical hydraulic conductivity, 10 7 cm s 1 , to obtain a Peclet number greater than 6Ð0 the diffusion coefficient would have to be 10 11Ð5 m2 s 1 , smaller than the minimum plausible, 10 11 m2 s 1 (Freeze and Cherry, 1979). Inversely, assuming the diffusion coefficient has a maximum plausible value of 10 9 m2 s 1 , the vertical hydraulic conductivity must be 10 4Ð5 cm s 1 for advection to be the dominant solute transport process. Without detailed field experiments, such as mini-aquifer testing and tracer tests in the bog, it is not possible to constrain the uncertainty and variability of the Peclet number more, although the combination of values used must have a value greater than 6 to advect recharge downward today in the bog. Our sensitivity testing, although constrained in part by the difficulty of obtaining important material parameters for peat, does suggest that we have captured the essence of the evolution of the bog’s solute transport history, if not the details in specific timing. Copyright  2002 John Wiley & Sons, Ltd. Hydrol. Process. 16, 1047–1064 (2002)
  • 16. 1062 J. M. McKENZIE ET AL. There are uncertainties in the Visual MODFLOW simulations. The lateral peat stratigraphy is not well constrained, but plausibly continuous and horizontal given the heuristic approach used in this study. The age of the peat at the EGr bog crest is well known (Shotyket al., 1998), but there is, as is usual in wetlands, limited information (i.e. Joray, 1942) on the palaeomorphology and growth rates at the bog flanks and edges. We assumed as a first approximation, based on changes in vegetation, that bog growth started out as a flatter ‘fen-type’ peatland and then domed. CONCLUSIONS Vertical porewater flow is an important process often overlooked by wetland scientists. Our research shows that vertical flow can and does influence the porewater chemistry of the EGr bog, and by extension, probably other isolated domed bogs as well. Using only the Dupuit–Forcheimer assumptions to calculate porewater movement and mass transport will invariably lead to errors in the chemical mass flux of bog systems at other than temporally short time scales. For example, prediction of the shape and size of raised bogs based only on the horizontal flow of water (Ingram, 1982; Winston, 1994) may be problematic where there is a significant component of vertical flow. Our measured vertical profiles of porewater chemistry at the EGr bog plot lower than that calculated by analytical models incorporating pure vertical diffusive transport. Today at the crest of the EGr bog, porewater clearly moves downward and deep through the peat profile and hydraulic measurements suggest that the rate of movement is on the order of ¾2 cm day 1 . Heuristic numerical modelling experiments of porewater flow at the EGr bog show that the high hydraulic conductivity layer at the bottom of the EGr bog is critical to form recharge flow cells extending to the base of the bog. Coupling the numerical model with Peclet number analysis shows that current solute transport in the bog is both advective and diffusive, although prior to 7000 14 C yr before present, solute transport was controlled only by vertical diffusion (Figure 8). These results compare well to those of Reeves et al. (2000) for the larger Glacial Lake Agassiz Peatlands, where a higher permeability layer in mineral soils below the base of the peat column creates deep, vertical, groundwater flow cells. The hydrodynamics of porewater flow in these two very different peatland settings lead to the conclusion that the presence or absence of a higher permeability layer in or below a domed peat bog is a crucial factor to create conditions for deep vertical flow of porewater and advection of solutes in peat. ACKNOWLEDGEMENTS This work was funded by the National Science Foundation, the University of Bern and supported by the Swiss National Science Foundation. Thanks to Ines and Martin Otz for assistance with data collection. REFERENCES Anderson MP, Woessner WW. 1992. Applied Groundwater Modeling. Harcourt Brace Jovanovich: San Diego; 381. Armstrong AC. 1995. Hydrological model of peat-mound form with vertically varying hydraulic conductivity. Earth Surface Processes and Landforms 20: 473–477. Bear J, Verruijt A. 1987. Modeling Groundwater Flow and Pollution. D. Reidel: Dordrecht; 414. Bedient PB, Rifai HS, Newell CJ. 1994. Ground Water Contamination; Transport and Remediation. Prentice Hall: Englewood Cliffs, NJ; 541. Belokopytov IE, Beresnevich VV. 1955. Giktorf’s peat borers. Torfyanaya Promyshlennost 8: 9–10 (in Russian). Bredehoeft JD, Konikow LF. 1993. Groundwater models: validate or invalidate. Ground Water 31: 178–179. Butler JJ, Healey JM. 1998. Relationship between pumping-test and slug-test parameters: scale effect or artifact? Ground Water 36: 305–313. Chason DB, Siegel DI. 1986. Hydraulic conductivity and related physical properties of peat, Lost River Peatland, Northern Minnesota. Soil Science 142: 91–99. Clymo RS. 1983. Peat. In Ecosystems of the World, Vol. 4A, Mires: Swamp, Bog, Fen and Moore, General Studies, Gore AJP (ed.). Elsevier: New York; 159–224. Copyright  2002 John Wiley & Sons, Ltd. Hydrol. Process. 16, 1047–1064 (2002)
  • 17. SOLUTE TRANSPORT IN PEAT 1063 Cussler EL. 1997. Diffusion; Mass Transfer in Fluid Systems. 2nd edn. Cambridge University Press: Cambridge; 580. Day JH, Rennie PJ, Stanek W, Taymond GP (eds). 1979. Peat Testing Manual. Technical Memo No. 125, National Research Council of Canada: Ottawa; 194. Dominco PA, Schwartz FW. 1998. Physical and Chemical Hydrogeology, 2nd edn. Wiley: New York; 506. Fetter CW. 1999. Contaminant Hydrogeology, 2nd edn. Prentice Hall: Englewood Cliffs, NJ; 500. Freeze RA, Cherry JA. 1979. Groundwater. Prentice Hall: Englewood Cliffs, NJ; 604. Freeze RA, Witherspoon PA. 1967. Theoretical analysis of regional groundwater flow: 2. Effect of water-table configuration and subsurface permeability variation. Water Resources Research 3: 623–634. Glaser PH, Siegel DI, Romanowicz EA, Shen YP. 1997. Regional linkages between raised bogs and the climate, groundwater, and landscape of north-western Minnesota. Journal of Ecology 85: 3–16. Harbaugh AW, McDonald MG. 1988. A modular three-dimensional finite-difference ground-water flow model. US Geological Survey techniques of water-resources investigations, book 6, chap. A1. Open-File Report 83-875, USGS: Reston; 586 pp. Harbaugh AW, McDonald MG. 1996. User’s Documentation for MODFLOW-96, an update to the US Geological Survey modular finite- difference ground-water flow model. Open-File Report 96-485, USGS: Reston; 56 pp. Hilbert DW, Roulet N, Moore T. 2000. Modelling and analysis of peatlands as dynamical systems. Journal of Ecology 88: 230–242. Hoag RS, Price JS. 1997. The effects of matrix diffusion on solute transport and retardation in undisturbed peat in laboratory columns. Journal of Contaminant Hydrology 28: 193–205. Hobbs NB. 1986. Mire morphology and the properties and behaviour of some British and foreign peats. Quarterly Journal of Engineering Geology, London 19: 7–80. Hvorslev MJ. 1951. Time lag and soil permeability in ground-water observations. Bulletin No. 36, Waterways Experiment Station, Corps of Engineers, US Army: Vicksburg; 50. Ingram HAP. 1982. Size and shape in raised mire ecosystems: a geophysical model. Nature 297: 300–303. Ingram HAP. 1983. In Hydrology, in Ecosystems of the World, Vol. 4A, Mires: Swamp, Bog, Fen and Moor, General Studies, Gore AJP (ed.). Elsevier: New York; 67–158. Joray M. 1942. L’Etang de la Gruy`ere: Etude pollenanalytique et stratigraphique de la tourbi`ere. Nat. Lev´e G´eobot. de la Suisse 25: 1–117 (in French). Konikow LF, Bredehoeft JD, Hassanizadeh SM. 1992. Groundwater models cannot be validated. Advances in Water Resources 15: 75–83. Landva AO, Korpijaakko EO, Pheeney PE. 1986. Notes on the original Von Post peat and peatland classification system. Paper presented at Advances in Peatlands Engineering, NRC of Canada, Ottawa, Canada, August 25–26, 1986. Langmuir D. 1997. Aqueous Environmental Geochemisty. Prentice-Hall: Upper Saddle River, NJ; 600. McNamara JP, Siegel DI, Galser PH, Beck RM. 1992. Hydrogeologic controls on peatland development in the Malloryville Wetland, New York (USA). Journal of Hydrology 140: 279–296. Mitsch WJ, Gosselink JG. 2000. Wetlands. 3rd edn. Wiley: New York; 920. Ogata A, Banks RB. 1961. A solution of the differential equation of longitudinal dispersion in porous media. Professional Paper 411-A, USGS: Washington, DC; 7. Oreskes N. 2000. Why predict? Historical perspectives on prediction in earth science. In Prediction; Science, Decision Making, and the Future of Nature. Sarewitz D, Pielke Jr RA, Byerly Jr R, (eds). Island Press: Washington, DC; 23–40. Oreskes N, Shrader-Frechette K, Belitz K. 1994. Verification, validation, and confirmation of numerical models in the earth sciences. Science 263: 641–646. Price JS, Woo M. 1990. Studies of a subarctic coastal marsh. III. Modelling the subsurface water fluxes and chloride distribution. Journal of Hydrology 120: 1–13. Reeve AS, Siegel DI, Glaser PH. 2000. Simulating vertical flow in large peatlands. Journal of Hydrology 227: 207–217. Remenda VH, van der Kamp G, Cherry JA. 1996. Use of vertical profiles of υ18O to constrain estimates of hydraulic conductivity in a thick, unfractured aquitard. Journal of Water Resources Research 32: 2979–2987. Romanowicz EA, Siegel DI, Glaser PH. 1993. Hydraulic reversals and episodic methane emissions during drought cycles in mires. Geology 21: 231–234. Roulet NT. 1990. Hydrology of a headwater basin wetland: groundwater discharge and wetland maintenance. Hydrological Processes 4: 387–400. Shotyk W. 1988. Review of the inorganic geochemistry of peats and peatland waters. Earth Science Reviews 25: 95–176. Shotyk W. 1996. Peat bog archives of atmospheric metal deposition: geochemical evaluation of peat profiles, natural variations in metal concentrations, and metal enrichment factors. Environmental Reviews 4: 149–183. Shotyk W, Weiss D, Appleby PG, Cheburkin AK, Frei R, Gloor M, Kramers JD, Reese S, Van Der Knaap WO. 1998. History of atmospheric lead deposition since 12,370 14C yr BP from a peat bog, Jura Mountains, Switzerland. Science 281: 1635–1640. Shulze-Makuch D, Carlson DA, Cherkauer DS, Malik P. 1999. Scale dependency of hydraulic conductivity in heterogeneous media. Ground Water 37: 904–919. Siegel DI. 1981. Hydrogeologic setting of the glacial Lake Aggasiz peatlands, northern Minnesota. Water-Resources Investigations 81-24, USGS: Reston; 34. Siegel DI. 1983. Ground water and the evolution of patterned mires, glacial Lake Agassiz peatlands, northern Minnesota. Journal of Ecology 71: 913–921. Siegel DI 1993. Ground water hydrology. In The Patterned Peatlands of Northern Minnesota, Wright Jr HE (ed.). University of Minnesota Press: Minneapolis; 163–173. Siegel DI, Reeve AS, Glaser PH, Romanowicz EA. 1995. Climate driven flushing of pore water in peatlands. Nature 374: 531–533. Steinmann P, Shotyk W. 1997a. Chemical composition, pH, and redox state of sulfur and iron in complete vertical porewater profiles from two Sphagnum peat bogs, Jura Mountains, Switzerland. Geochimica et Cosmochimica Acta 61: 1143–1163. Copyright  2002 John Wiley & Sons, Ltd. Hydrol. Process. 16, 1047–1064 (2002)
  • 18. 1064 J. M. McKENZIE ET AL. Steinmann P, Shotyk W. 1997b. Geochemistry, mineralogy, and geochemical mass balance on major elements in two peat bog profiles (Jura Mountains, Switzerland). Chemical Geology. 138: 25–53. Toth J. 1963. A theoretical analysis of groundwater flow in small drainage basins. Journal of Geophysical Research 68: 4795–4812. Von Post L. 1922. Sveriges Geologiska Undersøknings torvinventering och n˚agra av dess hittils vunna resultat (Geological survey of Sweden peat inventory and some preliminary results). Svenska Mosskulturføreningens Tidsskrift 36: 1–27 (in Swedish). Waddington JM, Roulet NT. 1997. Groundwater flow and dissolved carbon movement in a boreal peatland. Journal of Hydrology 191: 122–138. Winston RB. 1994. Models of the geomorphology, hydrology, and development of domed peat bodies. GSA Bulletin 106: 1594–1604. Winter TC. 1978. Numerical simulation of steady state three-dimensional groundwater flow near lakes. Water Resources Research 14: 245–254. Yamaguchi H, Ohira Y, Kogure K. 1985. Volume change characteristics of undisturbed fibrous peat. Soils and Foundations 25: 119–134. Zheng C, Bennett GD. 1995. Applied Contaminant Transport Modeling; Theory and Practice. Van Nostrand Reinhold: New York; 440. Copyright  2002 John Wiley & Sons, Ltd. Hydrol. Process. 16, 1047–1064 (2002)