1. Effects of Porous Confined Groundwater Depth of Yancheng Coastal Alluvial
Plain on Water Quality
Ma Junting*†, Chen Suozhong**, He Zhichao* and Zhu Xiaoting*
*Key Laboratory of Virtual Geographical Environment, Ministry of Education (National Education Administration),
College of Geographical Sciences, Nanjing Normal University, Nanjing, 210023, China
**Jiangsu Center for Collaborative Innovation in Geographical Information Resource Development and Application,
Nanjing, 210023, China
†Corresponding Author: Ma Junting
ABSTRACT
The space structure of aquifer (group) does not only determine the spatial distribution pattern of
groundwater, but also impose some effects on the groundwater quality. Based on the internal
hydrogeological borehole data in hydrogeological division of Yancheng Coastal Plain and water quality
factor monitoring data during 2005~2014, geographic information science (GIS) and analysis of variance
(ANOVA) method etc., are applied to the research response characteristics of aquifer roof depth
changes in time-space dimension for the quality of porous groundwater of confined aquifer III in
experiment sample area. This paper analyses the dynamic evolution laws of groundwater quality and
proposes suggestions on groundwater management and protection in the research area. The research
result shows that the depth of confined aquifer III in this area mostly goes between -118.9 ~-85.45 m.
Due to hydrogeological conditions of groundwater with different depths and exploitation and utilization
differences, there is some correlation between a typical water quality factor of groundwater and
aquifer depth. Mineralization, total alkalinity and total bacterial count have the strongest correlation
strength with the depth (relevancy: 69.67 %, 75.76 % and 58.09 %). The strength of total hardness is
at an intermediate level (49.18 %). KMnO4
index is less affected by the depth (35.27 %). It is also found
that the correlation strengths between factors and depth in various depth classification areas are
significantly different, indicating different dynamic evolution characteristics.
Nat. Env. & Poll. Tech.
Website: www.neptjournal.com
Received: 15-01-2016
Accepted: 18-03-2016
Key Words:
Confined aquifer
Water quality factor
Aquifer depth
Correlation
Dynamic evolution
INTRODUCTION
Porous confined groundwater is widely distributed in the
central sections of a plain or basin. Normally, it has a deep
burial depth and closed geological structure. It is little af-
fected by climate, featuring stable flow, good water quality
and no pollution. It is an important water supply source for
human being (Xueyu & Xiaoxing 2005). With rapid devel-
opment of society andeconomy, the demand forgroundwater
is increasingly urgent. As the groundwater exploitation is
intensified, the groundwater environment will change sig-
nificantly, which results in a series of groundwater environ-
ment problems and bring serious harm to ecology and hu-
man activities (Hao et al. 2010). Yancheng Coastal Plain is
located in the middle of the east coast of China. As the
population increases and industry and agriculture develops
rapidly, the porous confined groundwater buried in deep
ground surface is becoming a main water supply source for
many towns (Yuxi et al. 2015, Suozhong et al. 2005). The
area contains sedimentary strata in tertiary quaternary sys-
tems and forms a very thick and loose gap aquifer system. In
particular, unconfined groundwater and confined aquifer I
contains relatively high groundwater salinity. Confined aq-
uifers II and III have good water quality and serve as applied
water. With the rapid development of industry and agricul-
ture since 1990s, the groundwater exploitation has increased,
and the concentrated exploitation in some local areas has
caused the decline of water level, saltwater intrusion, ground
subsidence and other geological environmental problems
(Yanling 2005). At present stage, the research on porous
confined groundwater distribution and evolution laws in
the coastal plain area is of some practical significance to the
protection of groundwater resources and production guid-
ance in this type of area.
The current research on the groundwater in this area is
mainly conducted from the perspective of survey and analy-
sis on groundwater. For example, Cheng Hongwei took test-
ing data for 21 representative wells in Yancheng to analyse
the distribution trend of mineralization, ammonia nitrogen
amount and other water quality factors in space and time
(Hongwei 1998). Based on the water quality monitoring
data, Bian Jinyu et al. adopted main control factor analysis
method to analyse the control factors of groundwater qual-
2017pp. 115-124Vol. 16
p-ISSN: 0972-6268
No. 1
Nature Environment and Pollution Technology
An International Quarterly Scientific Journal
Original Research Paper
e-ISSN: 2395-3454
Open Access
2. 116 Ma Junting et al.
Vol. 16, No. 1, 2017 Nature Environment and Pollution Technology
ity in Yancheng (Jinyu & Rui 2003). This research has de-
scribed and analysed time-space dynamic change charac-
teristic quantification for groundwater, but the researches
on the effects of this area on groundwater quality changes
are few. As a matter of fact, there are lot of researches on the
quality changes and effects at home and abroad. For exam-
ple, Liao Zisheng et al. analysed the effect factors for water
quality change trend in groundwater system of Songnen
Basin (Zishen & Xueyu 2004). Han Yinli et al. took deep
groundwater exploration of Yinchuan Plain as guidance and
established a mathematic model for groundwater minerali-
zation and aquifer resistance of fluvial and pluvial deposi-
tion of Yinchuan Plain and lake-river deposition to obtain
the correlation between groundwater quality in this area
and resistance (Yinli et al. 2008). Tang Changyuan et al.
researched the effects of the wetland in upstream of Chiba,
Japan on groundwater quality and pointed out that the
wetland had certain inhibitive effects on the nitrate content
in groundwater (Changyuan et al. 2005). Serhal Hani re-
searched the effects of fertilizer and pollutant on ground-
water quality in Cambrai, France (Hani & Daniel 2009). The
above researches adopt various means to obtain the effect
mechanism of time-space distribution characteristics for
groundwater quality from different factors. The research on
dynamic changes of hydrogeological division in Yancheng
Coast provides a useful reference. However, the current re-
searches on effect factors for groundwater quality of
hydrogeological division in Yancheng Coastal Plain are
very few. How to analyze the correlation between different
effect factors and groundwater quality by combing
hydrogeological characteristics of Yancheng Coastal Plain
is of important significance to revealing groundwater evo-
lution laws and mechanism in this area. In view of the fact
that the depth of aquifer is a typical characteristic of aquifer
spatial distribution and it has a certain effect on time-space
evolution characteristics of some groundwater quality fac-
tors, this paper carries out a research on the correlation be-
tween the content of groundwater quality factor and aquifer
depth from the perspective of the spatial distribution pat-
tern aquifer. Based on the hydrogeological borehole data in
the research area and aqueous dynamic monitoring data,
hierarchical information of objective confined aquifer in
boreholes are extracted, aquifer roof depth digital elevation
model (DEM) is constructed. GIS and ANOVA statistical
analysis methods are applied to reveal the effects of the
depth of confined aquifer III in the hydrogeological area of
the Yancheng Coastal Plain on pore groundwater quality
and provide a reference for scientific management and pro-
tection of pore groundwater resource in Yancheng Coastal
Plain.
STUDYAREA
Study area is located in the north of hydrogeological divi-
sion of Yancheng Coastal Plain, bordering Northern Jiangsu
Main Irrigation Canal in the north and Doulong Port in the
south and lying between 33°15'~34°12’ N and 119°
34'~120°41’ E. It totals an area of about 6,177.11 km2
, as
shown in Fig. 1. The plain is formed by continual allevia-
tion of seawater and rivers for nearly 2,000-3,000 years. The
water networks in the area are densely distributed, forming
a plain geomorphic type of coastal water network and ex-
tending to the sea nowadays (Zujiang et al. 2005). The ter-
rain in the area is low, flat, slanting from southeast to north-
west. The terrain in Dafeng is relatively high, with an alti-
tude of about 3~5 m. It goes lower northwards and extends
to the Sheyang River by about 1~1.5 m.
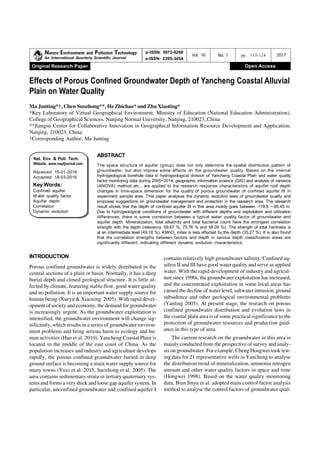
The confined groundwater in the research area is in the
pore of loose sediment strata, and its depth goes between
50~350 m (Fig. 2). Aquifer is mainly a loose sediment strata
sandstone, gravel or limestone, containing abundant and
stable water content (Zujiang 2005, Suozhong 2004). An
aquiclude is formed by clay or silt clay layer among differ-
ent aquifers. According to sediment age, formation cause,
strata structure and hydrogeological characteristics, the area
has five aquifer groups: aquifer I, aquifer II, aquifer III, aqui-
fer IV and aquifer V. In particular, porous unconfined
groundwater and micro-confined water mainly receive at-
mospheric precipitation, surface water and agricultural irri-
gation water infiltration recharge. Discharge mode is evapo-
ration and exploitation. The confined groundwater I and II
are saline water, brackish water and salt water. The underly-
ing Neogene System strata contains aquifer groups IV and
V which receives upside leaking recharge and lateral re-
charge of western and central mountains. Main discharge
mode is artificial exploitation. Aquifer III is composed of
fine sand and medium-coarse sand in lower pleistocene se-
ries, and its thickness mostly goes between 20.00~35.00 m.
With rich water yield property, it is the main exploitation
bed for groundwater in the research area, sharing a close
relation with human beings. Therefore, confined aquifer III
in the research area is selected in this paper as a research
object (Feng 2003).
DATASETS UTILIZED
Research data acquisition: Research data includes explo-
ration data of 60 hydrogeological boreholes in Yancheng
City. The aquifer distribution diagram is prepared by ex-
tracting information of roof depth of the confined aquifer III
in hydrogeological boreholes. According to groundwater
dynamic change laws and thematic map for aquifer depth
3. 117EFFECTSOFPOROUS CONFINEDGROUNDWATERDEPTHON WATERQUALITY
Nature Environment and Pollution Technology Vol. 16, No. 1, 2017
classification, 18 dynamic monitoring wells are selected
within the research scope, and their water quality monitor-
ing data during 2005~2014 are extracted. The position in-
formation of each borehole and monitoring well is extracted
by GPS. Xi‘an 80 ellipsoid with 3° belt dispersion and Gauss
Kruger projected coordinate system is adopted. The spatial
distribution for the selected groundwater monitoring wells
and hydrogeological boreholes is shown in Fig. 3.
Classificationof water quality factor:There are manykinds
of groundwater quality monitoring factors in Yancheng
Coastal Plain. According to area groundwater distribution
characteristics, refer to water quality factor classification
standard of Groundwater Environment Quality Standard
(GB/T14848-93). According to actual water quality moni-
toring in this area and the effects of different indexes on
industrial and agricultural production and human life, 5
factors (mineralization, total hardness, total alkalinity,
KMnO4
index and total bacterial count) are selected as wa-
ter quality indexes for analysis of effect factors for
groundwater quality.
Aquifer depth DEM generation and treatment: Original
data of hydrogeological borehole exploration in the research
area is interpreted to generate standardized cards for
hydrogeological boreholes. After that, database for
hydrogeological boreholes is established. The database
structure is shown in Fig. 4.
Fig. 2: Confined groundwater burial conditions schematic.
Fig.1: Location and extent of study area.
4. 118 Ma Junting et al.
Vol. 16, No. 1, 2017 Nature Environment and Pollution Technology
Based on the above data structure, strata depth data ex-
traction algorithm is designed. Position coordinate of each
borehole and strata depth information are read from the
borehole database to form original strata interface sampling
points. The sampling points are imported to ArcGIS, spatial
interpolation tool is used to establish a triangular irregular
network (TIN) of strata interface, cap is conducted with cov-
erage in the research area after the model is rasterized. Then,
aquifer roof elevation DEM in the research area can be ob-
tained. According to modelling area and differentiation of
depthvalues, DEM cell size isset as500 × 500m. Toresearch
the correlation between the depth and water quality, the con-
tinual depth values are classified. The maximum and mini-
mum roof elevations of confined aquifer III are -55.19 m and
-160.87m respectively. Classification test is conducted based
on the spatial distribution diagram for water quality monitor-
ing wells. Spatial distribution characteristics for aquifer can
be completely displayed by dividing 10 equal spaced sec-
tions to make water qualityfactor distribution lawshave good
discrimination. Aquifer depth DEM in this research area and
classification result are shown in Fig. 5.
Analysis and treatment of water quality factor monitor-
ing data: The confined groundwater III in the research area
has a deep burial depth and closed geological structure.
Groundwater environment and water quality changes are
stable. Since 2005, the local water conservancy administra-
tion department has sampled water quality for 1~ 2 time(s)
every year, but only sampled water quality once in most
years. Considering stability and seasonality and to facili-
tate the analysis, the sampling is conducted once a year in
default. If sampling is conducted for 2 times in a certain
year, it is agreed that the average value of the two sampling
values will be used as the sampling value in the current
year. Table 1 gives the monitoring data for water quality
factors in 1# monitoring well after treatment.
Fig. 3: Spatial distribution map of hydro-geological bore and groundwater monitoring well.
Fig. 4: Hydro-geological bore database structure.
5. 119EFFECTSOFPOROUS CONFINEDGROUNDWATERDEPTHON WATERQUALITY
Nature Environment and Pollution Technology Vol. 16, No. 1, 2017
Various depth classification areas and distribution are
significantly different, and the number of monitoring wells
is different. Therefore, all of historical monitoring data for
these monitoring wells are used as a sample. To ensure the
continuality of elevation value of depth classification, a
few depth classification sections, excluding monitoring
wells are included in the adjacent sections. After treatment,
9 valid classification sections (Table 2) are obtained. GIS
overlay analysis tool is used to obtain the monitoring wells
in every classification section. The monitoring data struc-
Table 1: Monitoring well 1# data structure.
Monitoring factor 2005 2006 2007 2008 2009 2010 2011 2012 2013 2014
Salinity (g/L) 0.78 0.67 0.53 0.55 0.86 0.61 0.54 0.91 0.87 0.82
Total hardness (mg/L) 244 185 169 141 147 159 208 210 207 96.9
Total alkalinity (mg/L) 436 448 433 554 392 421 485 491 446 474
KMnO4
Index (mg/L) 1.20 0.30 1.60 0.80 0.80 0.40 0.90 0.70 0.80 1.20
Total bacterial count 20 10 13 20 10 30 15 20 15 10
Table 2: Valid burial depth classification interval and equivalent water quality sample data structure.
-160.8~ -150.30~ -139.74~ -129.17~ -118.60~ -108.03~ -86.89~ 76.32~ 65.76~
-150.30 -139.74 -129.17 -118.60 -108.03 -86.89 -76.32 -65.76 -55.19
2005 Q11
Q12
Q13
Q14
Q15
Q16
Q17
Q18
Q19
2006 Q21
Q22
Q23
Q24
Q25
Q26
Q27
Q28
Q29
2007 Q31
Q32
Q33
Q34
Q35
Q36
Q37
Q38
Q39
2008 Q41
Q42
Q43
Q44
Q45
Q46
Q47
Q48
Q49
2009 Q51
Q52
Q53
Q54
Q55
Q56
Q57
Q58
Q59
2010 Q61
Q62
Q63
Q64
Q65
Q66
Q67
Q68
Q69
2011 Q71
Q72
Q73
Q74
Q75
Q76
Q77
Q78
Q79
2012 Q81
Q82
Q83
Q84
Q85
Q86
Q87
Q88
Q89
2013 Q91
Q92
Q93
Q94
Q95
Q96
Q97
Q98
Q99
2014 Q101
Q102
Q103
Q104
Q105
Q106
Q107
Q108
Q109
Sampling 20 30 20 10 20 10 10 10 10
count
Note: Qi
is a variable to describe a water quality factor detected in the buried depth of j during the year of i.
Table 3: Aquifer III burial depth height classification and percentage.
Number Elevation interval/m Area/km2
Percentage/ Number Elevation interval/m Area/km2
Percentage
% %
1 -160.8~-129.31 267.47 4.33 6 -99.12~-92.91 1324.76 21.45
2 -127.31~-118.19 398.72 6.45 7 -92.91~-85.45 872.8 14.13
3 -118.9~-111.14 650.46 10.53 8 -85.45~-75.09 453.5 7.34
4 -111.14~-104.92 975.63 15.79 9 -75.09~-55.19 173.62 2.81
5 -104.92~-99.12 1060.15 17.16
Table 4: ANOVA result table of water quality monitoring data.
Monitoring factors Sum of squares (SS) Mean square (MS) F value P value Critical
value
Burial others Burial depth others F-Script
depth (SSA) (SSE) (MSA) (MSE)
Salinity 8.71 9.24 1.09 0.07 15.44 0.0000071 2.01
Total hardness 204499.1 627479.3 25562.4 4789.92 5.34 0.0000083 2.01
Total alkalinity 465455.3 345592.0 58181.9 2638.11 22.054 0.0000054 2.01
KMnO4
Index 7.03 49.40 0.88 0.38 2.33 0.023 2.01
Bacterial count 26551.98 52141.82 3319.00 398.03 8.34 0.0000042 2.01
6. 120 Ma Junting et al.
Vol. 16, No. 1, 2017 Nature Environment and Pollution Technology
ture for water quality factors is formed, as shown in Table 2.
METHODOLOGYAND RESULTS
Basic characteristics of depth distribution for confined
aquifer III: The data of hydro-geological boreholes in the
research area and the characteristic analysis of aquifer roof
depth DEM show that the depth of confined aquifer III
within the whole research area has a significant difference
in space. The deepest roof elevation in the area is about
-160.88 m, and the shallowest roof elevation is about
-55.19 m. The depth changes are significant. In the wide
coastal area in the east and west of the research area, the
aquifer has a mild trend and a shallow depth due to the
aquifer deposition. The narrow zone in the west of the re-
search area has Xitang River and Jialiang River to form a
plain water network. The river cutting is obvious, which
causes significant changes of aquifer depth. In general, the
aquifer elevates from the southwest to the northeast, show-
ing a distribution characteristic of being basically opposite
to the ground elevation. The groundwater depth changes of
Mangshe River and East Guohe River are significant with
deep burial depth. It tends to be mild at the influx of North-
ern Jiangsu Main Irrigation Canal, and its aquifer depth is
relatively shallow. As shown in Table 3, the roof elevation
is located at an area of -99.12 ~ -92.91 m, which occupies
the largest area and 21.45 % of the total research area. The
roof elevation in an area of below -129.31 m and above
-75.05 m only occupies 7.14 % of the total research area.
Most of them are distributed in the mountainous areas in
the middle and west of research area.
Significance analysis on effects of aquifer depth on water
quality factor: To test whether the aquifer depth has a sig-
nificant effect on the water quality factor, a hypothesis that
“there is no significant correlation between depth and con-
tent of water quality factor” is proposed. As for whether
(total) average value of equivalent monitoring values for
10 years from the tested nine sections, the following hy-
pothesis is proposed:
equalallnotiH
H
i
i
)9,...2,1(:
......:
1
9210
...(1)
In Formula (1), µi
is the total average value for water
quality monitoring sample in number ith
classification sec-
tion. H0
is defined in the original hypothesis as: The total
average values for water quality factor monitoring in vari-
ous depth classification areas are equal, and the depth has
no significant effect on water quality. H1
means that a corre-
lation exists between aquifer depth and water quality. If
original hypothesis is refused, it will indicate that the depth
has a significant effect on water quality and a significant
correlation exists between them. If the original hypothesis
is not refused, it cannot fully prove that a significant corre-
lation exists between them.
ANOVA (analysis of variance) is a statistical method
which uses sampling data to test whether multiple total av-
erage values are equal. Testing statistics are built by calcu-
lating Sum of Squares for Total (SST), Sum of Squares for
Factor A (SSA) and Sum of Squares for Error (SSE) for sam-
pling data. The research on the effects of specified-type in-
dependent variable on numeric-type dependent variable is
realized (Manga & Morelli 1997). After its time and space
are treated, the water quality sampling data is imported to
SPSS, ANOVA analysis module is used, and relevant sig-
nificance testing is conducted for H0
hypothesis. Suppos-
ing the significance level is 0.05, the analysis result is
shown in Table 4.
The above table provides the sum of squares for factor A
(SSA) caused by the depth (independent variable) and meas-
ures the effects of depth on water quality factor. SSE reflects
the error sum of squares caused by other factors. These fac-
tors include sampling error, groundwater flow velocity, aq-
uifer lithology, saltwater intrusion and aquifer thickness.
As SSA is larger compared with SSE, the effects of depth on
water quality factor will be more significant. Otherwise, the
effects of other factors on water quality factor will be more
significant. The following formula (Yue 2014) can be
Table 5: Multiple comparative analysis result.
Salinity Total hardness Total alkalinity KMnO4 Index Bacterial count
|‘xi
-‘xj
| LSD |‘xi
-‘xj
| LSD |‘xi
-‘xj
| LSD |‘xi
-‘xj
| LSD |‘xi
-‘xj
| LSD
Test 1 0.149 0.152 73.665 39.584 41.23 29.358 0.045 0.351 20.433 11.40
Test 2 0.224 0.152 57.790 39.584 68.86 29.358 0.025 0.351 13.083 11.40
Test 3 1.001 0.204 106.88 53.073 144.20 39.387 0.185 0.471 17.85. 15.29
Test 4 0.780 0.204 71.045 53.073 138.91 39.387 0.045 0.471 8.500 15.29
Test 5 0.139 0.204 69.185 53.073 2.090 39.387 0.095 0.471 2.900 15.29
Test 6 0.191 0.235 38.770 61.284 33.200 45.481 0.690 0.544 14.400 17.66
Test 7 0.245 0.235 25.140 61.284 75.200 45.481 0.250 0.544 1.100 17.66
Test 8 0.128 0.235 29.430 61.284 189.80 45.481 0.630 0.544 11.200 17.66
7. 121EFFECTSOFPOROUS CONFINEDGROUNDWATERDEPTHON WATERQUALITY
Nature Environment and Pollution Technology Vol. 16, No. 1, 2017
adopted to measure the relationship strength between depth
and content of water quality.
SSASSE
SSA
SST
SSA
R
2
...(2)
In formula (2), R2
refers to the error sum of squares of
depth and its proportion in total error sum of squares. Its
square root R measures the relationship strength between
the two variables.
According to the variance analysis principle and analy-
sis result, when the significant level = 0.05, the molecular
degrees of freedom in F distribution table is 8, and the criti-
cal value for denominator degrees of freedom 131 is F
=
2.01. Formula (3) is applied to calculate the test statistics F
for sampling distribution, which is compared with the criti-
cal value F
.
)/(
)1/(
knSSE
kSSA
MSE
MSA
F
...(3)
If F>F
, the original hypothesis H0
will be refused. It can
be concluded that the aquifer depth has a significant effect
on the content of water quality factor. If F<F
, the original
hypothesis H0
will not be refused. At this moment, it cannot
be considered that the aquifer depth has an effect on the
water quality. It can be known from the calculation result in
Table 4 that the statistical values for sampling data of three
water quality factors (mineralization, total alkalinity and
total bacterial count) are 15.44, 22.054 and 8.34 respec-
tively, which are relatively high and far more than the test
critical value F
. This indicates that these water quality fac-
tors are significantly affected by the depth. The statistical
values for KMnO4
index and total hardness are 2.33 and
5.34 respectively, which is slightly higher than F
. This
indicates that these two factors are less affected by the aqui-
fer depth, but there is still a certain effect. The relationship
strength between water quality factor and depth can be cal-
culated by substituting the calculation result in Table 5
into formula (2). In particular, R2
values of mineralization,
total alkalinity and total bacterial count are 48.53 %, 57.39
% and 33.74 % respectively. That is, the proportions of
aquifer depth on the content of these three factors in total
effect are 48.53 %, 57.39 % and 33.74 % respectively. R2
value of total hardness is 24.58 %. This indicates that the
proportion of variation explanation of aquifer depth for to-
tal hardness is only 24.58 %. Compared with mineraliza-
tion and total alkalinity, this proportion is not high, but R
value for the relationship strength between total hardness
and depth is 49.18 %. This indicates that there is a nearly
intermediate correlation between them. R values for miner-
alization, total alkalinity and total bacterial count are 69.67
%, 75.76 % and 58.09 % respectively. This indicates that
there is an above intermediate correlation among them. Cor-
respondingly, R2
values for KMnO4
index is 12.44 %, and
its square root R value is 35.27 %. This indicates that the
aquifer depth has an insignificant effect on KMnO4
index,
and their correlation is relatively weak.
It can be known from the above analysis that the rela-
tionship between the selected five water quality factors and
the depth is up to the significant degree in statistics. How-
ever, it is still unclear about the most significant differences
of water quality factors among elevation classification sec-
tions. Therefore, multiple comparisons method (Benjamini
& Liu 2003, Hochberg & Tamhane 1987) is introduced to
further analyze the monitoring data of the above five water
quality factors: total average values are conducted with pair
comparison and the difference significance among the av-
erage values of various contents of water quality factors are
tested. What is mostly applied in multiple comparisons
method is the least significant difference (LSD). t is used to
test pair comparison among all grouped data. With high
sensitivity, it can test the slight differences among various
total levels (Zhou et al. 2008). Based on LSD, the monitor-
Fig. 5: Aquifer III roof burial depth DEM and its classification.
8. 122 Ma Junting et al.
Vol. 16, No. 1, 2017 Nature Environment and Pollution Technology
ing data for water quality factor is analysed in this paper as
follows:
Step 1: Suppose the test significance level = 0.05. Con-
sidering that the research is divided into 9 different eleva-
tion classifications and the elevations among different clas-
sification are continually distributed from low to high, 8
groups of test hypotheses are proposed. The test hypothesis
for group i can be described as:
)1(;:,: 10 ijHH jiji ...(4)
Step 2: Calculate test statistics of water quality factors (|xi
-
‘xj
|) and least significant difference (LSD). The computa-
tional formula for LSD value is as follows (Junping 2006):
)
11
(2/
ji nn
MSEtLSD ...(5)
In the above formula, ni
is the monitoring sample capac-
ity in number ith
classification section, t/2
is the critical
value for t distribution of degree of freedom (n-k), n is the
total number of monitoring samples, and k is the number of
depth classifications. It can be known from the calculation
result in Table 5 that MSE and sample capacities for 5 kinds
of water quality factors are different, so they need to be
calculated respectively. The degree of freedom for t distri-
bution is 131. It can be known by checking t distribution
table that the critical value is t/2
= t0.025
= 1.980. According
to Formula (6) and test statistics, the multiple analysis re-
sult for water quality factors is shown in Table 5.
Step 3: Decision and analysis: Compare test statistics and
LSD values. If the statistical value is higher than LSD value,
the original hypothesis will be refused. In this test, there is a
significant different in the contents of water quality factors
between the two depth classifications. Otherwise, the origi-
nal hypothesis will not be refused. It is considered that the
difference in water quality between the two depth classifi-
cations is insignificant. It can be known from the result in
Table 5 that the following groups have significant test dif-
ferences: groups 2, 3, 4 and 7 for mineralization test, the
first 5 groups for total hardness test, groups 1~4, 7 and 8 for
total alkalinity test, groups 6 and 8 for KMnO4
index test
and groups 1~3 for total bacterial count test. It can be known
by contrasting the elevation classifications in Table 3 that
the effect of the depth on 3 kinds of factors (mineralization,
total hardness and total alkalinity) in deep aquifer area -
160.8 m ~ -99.12 m is significant. Its spatial distribution
area occupies 54.26 % of the whole research area. Total
alkalinity is in the deep or shallow aquifer (about 47.26 %
of total area), showing the characteristics of depth changes.
KMnO4
index only shows a significant difference for the
specific depth between -99.12 m ~ -92.91 m and -85.45 m ~
-75.09 m. However, its distribution area in space occupies
31.6 % of the total area, being nearly 1/3 of the research
area. There is some correlation between the content of
KMnO4
index and the aquifer depth in this position.
Distribution and evolution characteristics of water qual-
ity factors with depth changes: To reflect the characteris-
tics of water quality factors with depth changes in space and
time, firstly make statistics on the monitoring wells con-
tained in each depth classification section, and calculate
the average value of all monitoring data during specified
years in the same depth classification section. Use the above
value to represent the water quality this year in the above
depth section to draw a statistical curve chart for 5 water
quality factors (mineralization, KMnO4
index, total hard-
ness, total alkalinity and total bacterial count) with depth
classification changes during 2005~2014, as shown in
Fig. 6.
It can be seen by analysing Fig. 6 that in terms of water
quality factors of confined groundwater III in the research
area, KMnO4
index, total bacterial count and mineralization
have big changes during 2005~2014, while total alkalinity
and total hardness have small changes. In shallow aquifer
area, KMnO4
indexandtotal bacterial count reached the peak
during 2005~2014, which indicates that water pollution is
becoming serious. It can be known by contrasting Table 4
that (-92.91, -85.45) is an advantage distribution depth sec-
tion for KMnO4
index. The shallow area
(-85.45, -75.09) is an advantage distribution depth section
for total bacterial count. During 2005~2014, KMnO4
index
showed an upward tendency in most sections, while total
bacterial count in the aquifer depth area less than 104.92 m
showed a significant increase. As the shallow groundwater is
further affected by domestic waste discharge in human life,
the content of organic pollutantsin groundwater will increase.
-118.9, -99.12 is an advantage distribution depth sec-
tion for mineralization, total hardness and total alkalinity.
Compared with KMnO4
index and total bacterial count, the
changes of the above three factors are not very significant
during 2005~2014. As for the groundwater in the aquifer
located above -104.92 m ~ -99.12 m, the groundwater ex-
ploitation strength in coastal area with shallow aquifer in
the east in recent years is intensified, and saltwater intru-
sion is intensified. Due to alleviation of sea facies and high
salt content of groundwater and especially shallow
groundwater in reclamation and intertidal areas in the east,
mineralization content has showed a significant increase in
recent 10 years (increased by 1.5 mg/L within 10 years),
which makes the water salty.
Similar to the mineralization, total hardness shows a
slight increase in shallow aquifer area, which indicates that
9. 123EFFECTSOFPOROUS CONFINEDGROUNDWATERDEPTHON WATERQUALITY
Nature Environment and Pollution Technology Vol. 16, No. 1, 2017
the underground industrial process water is threatened. To-
tal alkalinity in shallow aquifer and the section (-111.14,
-104.92) is high. The water buffer capacity in the area is
strong with good metal dissolution and detoxication. It is
suitable for farm irrigation. Due to decline of water level
caused by groundwater exploitation and decrease of water
yield, its content shows a slight decline in the whole stable
trend. Attention should be paid to this.
CONCLUSIONS
Based on the actual water quality monitoring and
groundwater utilization in the research sample area, this
paper analyzes the response characteristics of spatial distri-
bution and dynamic changes of typical water quality fac-
tors in confined porous groundwater against the aquifer
depth. Several conclusions are obtained as follows:
1. Confined aquifer III in the research area is the main ex-
ploitation bed for groundwater in the area. Its depth is
distributed unevenly in space, elevating from the west to
the east. The depth changes in the southwest area are
significant, and the depth changes in the central and
northeastern areas are relatively mild. The aquifer depth
in most areas goes between -118.9 m ~ -85.45 m, which
occupies above 60 % of the research area.
2. There is a significant correlationbetween the groundwater
quality and aquifer depth in confined aquifer III. Miner-
alization, total alkalinity and total bacterial count have
the strongest correlation strength to the depth, and their
R values are 69.67 %, 75.76 % and 58.09 % respectively.
The correlation strength of the total hardness reaches a
nearly intermediate level (R = 49.18 %). The effects of
the depth on KMnO4
index are limited, and R values for
correlation strength between KMnO4
index and depth is
35.27 %.
3. The effects of the depth on total hardness, mineralization
and total bacterial count in deep aquifer area are rela-
tively significant. Their depth elevations are distributed
between -160.8 m ~ -99.12 m (about 54.26 % of the total
area). The effects of the depth on total alkalinity in shal-
low aquifer area are significant (about 47.26 % of total
area). KMnO4
index in the specific depth section (-99.12
m ~ -92.91 m and -85.45 m ~ -75.09 m) has a significant
difference, and its aquifer distribution scope occupies 1/
3 of the total research area.
4. The groundwater content in the depth between -85.45 m
~ -75.09 m for KMnO4
index and total bacterial count is
relatively high. They are mainly distributed between
Sheyang County and Huangsha Port. In recent years, it
has shown an increase trend under the effects of human
exploitation and waste discharge. The mineralization
content reaches the peak in the aquifer in the middle and
west of the research area. The development of coastal salt
fields and the saltwater intrusion have intensified in re-
cent years, which bring adverse effects on residents’ do-
mestic drinking water. In general, total alkalinity and
total hardness have small changes. Their distribution
advantage depth section is -111.14 m ~ -104.92 m. In
shallow depth area, total alkalinity declines slightly,
while total hardens shows a certain increase trend. This
indicates the applicability or effects of groundwater in
industrial and agricultural production. Some preventive
and control measures should be taken.
5. The factors affecting groundwater quality include
groundwater flow velocity, upside leakage, saltwater in-
trusion, lithology and hydrolytic weakening properties
(Hudak 2010). Aquifer depth has been taken out in this
paper, and the time-space characteristics of water quality
factors under single effect are researched without consid-
ering multi-factors. To extract and quantize other factors
in the research area and conduct conjoint analysis under
the effects of multi-factors is an important direction for
follow-up research in this paper.
ACKNOWLEDGEMENTS
This research was supported by the National Natural Sci-
ence Foundation of China (No.41571386).
REFERENCES
Benjamini, Y. and Liu, W. 2003. A step-down multiple hypotheses
testing procedure that controls the false discovery rate under in-
dependence. Journal of Statistical Planning and Inference, 82:
163-170.
Changyuan, T. and Yasuo, S. 2005. The characteristics of
geochemistry in a headwater wetland, Chiba, Japan. IAHS-AISH
Publication, 294: 167-175.
Feng, G. 2003. Water resources situation and problems in Yancheng
City. Hydrology, 23(2): 53-55.
GB/T1 1994. Quality standard for ground water. Beijing, China:
National Technical Supervision Bureau Version 4848-93, China.
Hani, S. and Daniel, B. 2009. Impact of fertilizer application and
urban wastes on the quality of groundwater in the Cambrai
Chalk aquifer, Northern France. Environmental Geology, 51(7):
1579-1592.
Hao, W., Chuiyu, L. and Dayong, Q. 2010. Advances in method
and application of groundwater numerical simulation. Earth
Science Frontiers, 17(6): 1-12.
Hochberg, Y. and Tamhane, A.C. 1987. Multiple Comparison
Procedures. Addison-Wiley: NewYork.
Hongwei, C. 1998. Analysis of groundwater resource in Yancheng.
Journal of China Hydrology, 28: 65-69.
Hudak, P. F. 2010. Principles of Hydrogeology. Higher Education
Press: Beijing.
Jiarong, L., Qinglong, Q. and Zhixiag, F. 2000. Investigation and
evaluation of groundwater resources in Yancheng City. Advances
in Science and Technology of Water, 20(3): 48-50.
10. 124 Ma Junting et al.
Vol. 16, No. 1, 2017 Nature Environment and Pollution Technology
Jinyu, B. and Rui, F. 2003. Analysis of controlling factors of
groundwater quality in Yancheng area. Hydrogeology and
Engineering Geology, 20(5): 57-60.
Junping, J. 2006. Statistics. Tsinghua University Press: Beijing.
Manga, U. and Morelli, M. 1997. Data-aided frequency estimation
for burst digital transmission. IEEE Transactions on
Communication, 45(1): 23-25.
Suozhong, C. and Jiahu, H. 2004. 3D spatial dispersing method for
interstitial geohydrology succession based on GIS. Advances in
Water Science, 15(5): 64-69.
Suozhong, C., Benchun, C. and Jiazhu, H. 2005. Water Resource
Management Information System. Science Press, Beijing.
Xueyu, Z. and Xiaoxing, Q. 2005. Groundwater Hydrology. China
Environmental Science Press: Beiijing.
Yanling, F. 2005. Evaluation of groundwater resource forecast in
Yancheng. Resource Survey and Environment, 26(1): 54-59.
Yinli, H., Bingxi, Y. and Qiusheng, Y. 2008. The application of
electric characteristics to studying spat distribution of groundwater
quality in Yinchuang plain. Geophysical and Geochemical
Exploration, 32(3): 288-291.
Yue, X. 2014. High-Dimensional Variance Analysis. Northeast Normal
University.
Yuxi, Z., Jingtao, L. and Yuanjing, Z. 2015. Hydro-chemical evolution
of shallow and deep groundwater in Tongchuan city, China. Journal
of Coastal Research, 73(5): 436-442.
Zhou, S., Qianshi, X. and Chengyi, P. 2008. Probability Theory and
Mathematical Statistics. Higher Education Press: Beijing.
Zishen, L. and Xueyu, L. 2004. Chemical characteristics and variations
of groundwater quality in Songnenbasin. Earth Science Journal
of China University of Geosciences, 15(1): 96-102.
Zujiang, L. and Yongxia, W. 2005. Three-dimensional numerical
model for groundwater resource evaluation and plan in Yancheng.
Water Resource Protection, 21(5): 37-41.