
Recommended
Recommended
More Related Content
What's hot
What's hot (20)
Similar to evaluation of water resources in wadi el natrun, western desert, egypt
Similar to evaluation of water resources in wadi el natrun, western desert, egypt (20)
Recently uploaded
Recently uploaded (20)
evaluation of water resources in wadi el natrun, western desert, egypt
- 1. International Journal of Environment, Agriculture and Biotechnology (IJEAB) Vol-2, Issue-1, Jan-Feb- 2017 http://dx.doi.org/10.22161/ijeab/2.1.42 ISSN: 2456-1878 www.ijeab.com Page | 329 Evaluation of Water Resources in Wadi El Natrun, Western Desert, Egypt Mohamed kamel Fattah Department of Evaluation of Natural Resources, Environmental studies and research Inst., University of Sadat City, Egypt. mohamed.fattah@esri.usc.edu.eg Abstract— Groundwater of the Pliocene aquifer in Wadi El Natrun area represents the primary source of reliable water for drinking and agriculture uses. This research focuses on the study of the different sources of water in the study area and determines the origin and quality of this waterand also is interested in studying hydrogeochemical processes that affect them and the movement of water through the analysis and determine the activity of different elements, and also to changes in hypothetical salts with the direction of water flow in three sectors of the region and the statement of the most important geochemical processes that occur. Finally it is evaluated the suitability of the water for different purposes. The results show that, there is a zonation of chemical composition; this zonation is characterized by a change of cation species from dominantly Ca and Mg near the east to Na-dominated waters in the west. Mirroring this, anions change from HCO3 type to Cl and SO4 type.The ions displays two grades of metasomatism along flow path, first the stage of mineralization(HCO3>Cl>So4) at the east then the advanced stage of mineralization (Cl>SO4 >HCO3) at the west. According to the(W.H.O.2005), 45 % of tested groundwater samples are permissible for drinking. Most groundwater samples of the Pliocene according to SAR andRSC are suitable for irrigation purposes under normal condition, but all surface water samples (lakes) are saline water,so it is not valid for drinking or irrigation purposes. Keywords—Water Resources, Pliocene Aquifer, Wadi El Natrun, Egypt. 1- INTRODUCTION This research discusses the hydrogeo chemistry of groundwater in order to estimate the water quality variation, and to shed the light on the important indications about the history of various concentrations of major elements as well as groundwater recharge, discharge, and movement of groundwater in the study area. Water quality, hydro chemical coefficients and groundwater origin will be estimated. The hydro –geochemical characteristics are investigated through the discussion of both geochemical composition and distribution andthe geo- chemical classification of groundwater, also, it can provide a useful insight into the probable processes governing groundwater chemistry (Lyon and Bird, 1995), and (Soulsby et al., 1998.).To achieve this goal, six surface water samples representing the main lakes and thirty five groundwater samples representing productive water wells ( Pliocene aquifer ) were collected in November, 2015, (Figure 1). 1.1-Geomorphological andgeologicalsetting Wadi El Natrun occupies a portion of the Western Nile Delta region (Figure 1). It lies between longitude 30º 04´ and 30º 30´ E and latitudes, 30º 16´ and 30º 30´ N.The study area covers an area of about67608Feddans or 281 km2. (El- Abd, E. A, 2005).(Said, 1962), (Sanad, 1973),(El- Ghazawi, 1982), and (Abdel-Baki, 1983) studied the geomorphology and geology of the study area. They concluded that the study area comprises three geomorphological units. The Alluvial plains (young and old alluvial plains) which are characterized by an average gradient of 0.l m/km. The elevation varies from +12 m to +14 m for the young alluvial plains, and between 60 m and 20 m for the old alluvial plains. The lowest point in Wadi El-Natrun and Wadi El-Farigh depressions are -23m and - 4m respectively. The Structural plains (depressions, folded ridges and structural plateaux) which have an elevation ranges between 110 m at Gebal Hamza and 200 m at Abu Roash (the ridges bounding Wadi El-Farigh). The tablelands which are differentiated into Maryut tableland marginal tableland. The sedimentary succession in the study area ranges in age from Late Tertiary which is differentiated into Oligocene at 400 m, Miocene at 200 m and Pliocene at 150 m to Quaternary at 300m. The study area also is affected by a number of faults having NW-SE and NE-SW trends. In subsurface, the measured thickness of the Lower Pliocene at Wadi El-Natrun reaches about 100m and composed essentially of dark pyretic clays. This clay is also encountered in the area between Wadi El-Natrun and Nile Delta, underlying the Pleistocene deposits and overlying with unconformable surface the Middle and Lower Miocene succession.The Middle and Upper Pliocene
- 2. International Journal of Environment, Agriculture and Biotechnology (IJEAB) Vol-2, Issue-1, Jan-Feb- 2017 http://dx.doi.org/10.22161/ijeab/2.1.42 ISSN: 2456-1878 www.ijeab.com Page | 330 strata, (Wadi El-Natrun formation) are largely restricted to the depression area; these are developed into gypseous clays and sands of typical brackish water origin. This portion of the Pliocene succession is differentiated into two series; Beni Salama Member at base and El-Muluk Member at top. The thickness of the Pliocene sediments in Wadi El Natrun varies from 240 m in the middle, 130 m in the northwest and 100 m in the southeast .The thickness of the Pliocene increases in the areas dominated by the graben- like structure and decreases in the area-dominated by horst one (El Fayumy, 1964). 1.2—Groundwaterhydrologysetting There are three main aquifers in the study area, namely; The Nilotic sand and gravel (Pleistoceneaquifer), Wadi El- Natrun sand and clay (Pliocene aquifer) and El- Moghraquartizitic sand (El-Sheikh, 2000) .The Pliocene sediments are mostly built up of clays underlying the Quaternary aquifer, and hence they represent the main aquiclude horizon in this area. Pliocene sediments in Wadi El Natrun are mainly affected by several faults which facilitate the connection between them and those of the Quaternary. These faults are trending NW-SE direction and bounding Wadi El Natrun from the east with downthrown side to the northeast. So the Quaternary aquifer is located in the front of the Pliocene one in the east. Also Wadi El Natrun is bounded from the south and west by clysmic NW-SE faults with downthrown side to the northeast. So the Miocene aquifer is located in the front of the Pliocene facilitating the hydraulic connection between them. The depth to water of the Pliocene aquifer varies from about20 m to 30 m outside wadi El Natrun and less than 10 m to flowing in the surface inside Wadi El Natrun Figures (2 &3) . The Groundwater flows from northeast and southeast to southwest and northwest i.e. to Wadi El Natrun. Also local cones of depressions spread in the west and groundwater movements are mainly attributed to the over exploitation of ground water to irrigate the newly reclaimed lands. The Pliocene aquifer in wadi El Natrun is mainly recharged from the Quaternary and Miocene aquifers through the hydraulic connection. The water of the latter aquifers is laterally flowing towards Wadi El Natrun depression, which acts as natural discharging area. The recharge to the Pliocene aquifer, which equals the permissible extraction rate under any condition of future reclamation, was estimated by TRIWACO model to be 128040 m3 /day (Diab et al, 2002).Pliocene aquiferat wadi El Natrun receives other recharge from the southern portion of the Nile Delta through Wadi El Farigh and southwest of Wadi El Natrun depression (Abdel Baki, 1983). (A)
- 3. International Journal of Environment, Agriculture and Biotechnology (IJEAB) Vol-2, Issue-1, Jan-Feb- 2017 http://dx.doi.org/10.22161/ijeab/2.1.42 ISSN: 2456-1878 www.ijeab.com Page | 331 (B) Fig.1:Location map of groundwater samples (A) and lakes (B) Fig.2:Depth to water contour map of Pliocene aquifer
- 4. International Journal of Environment, Agriculture and Biotechnology (IJEAB) Vol-2, Issue-1, Jan-Feb- 2017 http://dx.doi.org/10.22161/ijeab/2.1.42 ISSN: 2456-1878 www.ijeab.com Page | 332 Fig.3: Water level contour map of Pliocene aquifer 2- MATERIAL AND METHODS Complete chemical analysis of thirty five groundwater samples and Six surface water samples collected from the study area, The analyses conducted both in the field include total dissolved solids (TDS), measurement of Ph, electrical conductivity (EC), and in the laboratory concentrations of Ca+2 , Mg+2 , Na+ and K+ as cations, CO3 -2 , HCO3 - , SO4 -2 and Cl- as anions. Detailed Chemical analyses were carried out for the collected samples (Figure 1). Different methods were used for these analyses, ASTM, American Society for Testing and Material (2002), (Ca++ , Mg++ , CO3, HCO3, Cl) were measured volumetrically by titrimetric method. Sodium (Na+ ) and potassium (K+ ) were determined calorimetrically by means of Flame photometer. Sulphate (SO4) is determined calorimetrically by means of Ultraviolet spectrophotometer screening method at wave length (690, nm). Also, a Global Positioning System (GPS) Garment 12 was used for location and elevation readings. Tables (1 to 3 in appendix) include the concentration of major ions, salinity, total hardness, ions distribution, hydrochemical coefficients and hypothetical salt combinations for groundwater samples collected from the wells tapping the Pliocene aquifer in the study area. 3- RESULTS AND DISCUSSION 3.1 Hydrochemical characteristics Thirty five groundwater samplesfrom the Pliocene aquifer and six surface water samples (Lakes) figure (1.A&B) were collected for chemical analyses (tables1&2, App. 1) will be utilized to determine water quality ,the geochemical evolution along the groundwater flow path and finally the suitabilityof these water for different purposes 3.1.1 pH values: The pH value of water is related to its quality and affects, to a great extent, its suitability for different uses. The water pH is controlled by the amount of dissolved carbon dioxide (CO2), carbonates (CO3 2- ) and bicarbonates (HCO3 - ) (Domenico, P.A., and Schwartz, F.W., 1990). The hydrogen ion concentrations (pH) in ground water for groundwater ofthe Pliocene aquifer, variesbetween 7.32 in well no. 4,and 9.96 in well no. 23. While surface water samples , the pH varies between 8.8 in sample (no. 42)( El Gaar lake ) at the north west and 9.1 in sample (no. 26) ( Rozitta lake) at south east.The values of pH for all studied water samples of Pliocene aquifer and lakes, reflect alkaline water conditions, The variations of pH value are mostly due to the chemical composition of the aquifer rocks. 3.1.2 Electric Coductivity (EC): For the groundwater of the Pliocene aquifer, electric conductivityvaries between 0.472 m mohs/cm in well no.( 30) at the south east , and 10.660 m mohs/cm in well no. 39 (Clay Quarries) at the middle part of wadi El Natrun.For
- 5. International Journal of Environment, Agriculture and Biotechnology (IJEAB) Vol-2, Issue-1, Jan-Feb- 2017 http://dx.doi.org/10.22161/ijeab/2.1.42 ISSN: 2456-1878 www.ijeab.com Page | 333 surface water samples(lakes)in the study area , the electricconductivity varies between 18.9 m mohs/cm in sample no. 29(Malahet Bani Salama) , and 192 m mohs/cm in sample no. 22(El Hammra lake) 3.1.3 Total Dissolved Solids (TDS): The salinity contents ranging from 300 mg/l in well no. 30 at the south east of Wadi El Natrun to 6822 mg/l in well no.39 (Clay Quarries) at the middle part of wadi el Natrun, the salinity increase from east to west in the direction of water flow. The groundwater of the Pliocene aquifer is mainly belongs to brackish saline water. The surface water samples of the lakes is mainly belongs to saline water with salinity contents ranging from 12096 mg/l in sample no.29 ( Malahet Bani Salama ) at south east to 122880mg/l in sample no.22 (El Hamra lake) .(Figure4) (A) (B) Fig.4: Salinity distribution contour map of productive wells of the Pliocene aquifer (A) and lakes (B )atWadi-El Natrun
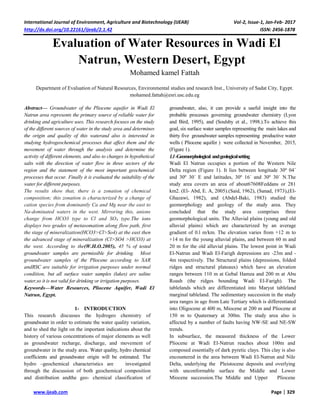
- 6. International Journal of Environment, Agriculture and Biotechnology (IJEAB) Vol-2, Issue-1, Jan-Feb- 2017 http://dx.doi.org/10.22161/ijeab/2.1.42 ISSN: 2456-1878 www.ijeab.com Page | 334 About 8% of tested samples have salinity content less than 500 mg/l. 21 % of tested samples have salinity content ranging from 500-750 mg/l. 17 % of tested samples have contents ranging from 750-1000 mg/l. 54 % of tested samples have contents more than 1000 mg/l.According to theWorld Health Organization (W.H.O.2005) the maximum permissible limits of TDS in drinking water is 1000 mg/l. It’s concluded that 45 % of tested samples are permissible, where 54% not permissible. 3.1.4 Distribution of hydrochemical elements in ground and surface water: 3.1.4.a- Major ions distribution in groundwater Regarding major cations, sodium is mostly predominant cation followed by calcium and magnesium. Sodium concentration ranges from 50 mg/l (well No. 31) to 2360 mg/l (well No. 39). High sodium concentration is possibly due to leaching processes of clay and shale present in aquifer materials. Calcium concentration ranges from 12.8 mg/l (well No. 1) to 114 mg/l (well No. 39). Magnesium concentration ranges from 2.43 mg/l (well No. 4) to 21.39 mg// (well No. 33). Concerning major anions, chloride and sulphate are mostly predominantly over bicarbonate. Chloride concentration ranges between 40 mg/l (well No. 31) and 3000 mg/l (well No. 39). High values of Cl- content is mainly attributed to dissolution of chloride–bearing deposits evaporates and clay minerals within the aquifer materials. . Sulphate concentration ranges from 49 mg/l (well No. 31) to 1600 mg/l (well No. 6). High sulphate concentration reflects dissolution of terrestrial deposits of gypsiferous shale and gypsum in the aquifer materials. Bicarbonate concentration ranges between 86 mg/l (well No. 32) and 320 mg/l (well No. 7). 3.1.4.b-Major ions distribution in surface water (Lakes) Major cations in surface water samples (lakes), sodium is mostly predominant cation followed by calcium and magnesium,Sodium concentration ranges between 4350ppm in sample no.29(MalahetBenisalama) to 44200 ppm in sample no. 22 (El Hammra lake) .High contents of sodium ion over the study area are due to active cation exchange and leaching processes of clays and salts present in aquifer material.calcium contents ranging from 70 ppm in sample no.29 (Malahet Beni Salama) at south east to 300 ppm in sample ( no. 22)(El Hammra lake) at east. The high values of calcium concentration is mainly comes from dissolution of sediments rich in calcium. This may be due to leaching and dissolution processes of gypsum bearing of aquifer material. Magnesium contents ranging from 70 ppm in sample no. 29(Malahet Beni Salama ) at south east to 200 ppm in sample no. 22 (El Hammra lake ) at east. Potassium concentration ranges between 200 ppm in sample no. 29 (Malahet Beni Salama) to 540 ppm insample no. (26 Rozitta lake. Concerning major anions, chloride and sulphate are mostly predominantly over bicarbonate,chloride concentration ranging from 5500 ppm in sample no.29 (Malahet Beni Salama ) to 54000ppm in sample( no. 22 El Hammra lake).The presences of chloride ion with high concentration in groundwater reflect the presence of evaporite salts rich in chloride. Chloride concentration generally increases from east to west with the direction of water flow.Sulfate contents ranging from 1450 ppm (in sample no. 41 El Gaar lake) at north to 20900ppm (in sample no. 22 El Hamralake ) in east ,the high increase in sulfate contents was recorded at the north west part of the study area. This reflects effect of downward seepage of sanitary and agricultural waste water rich with sulfates, and to local terrestrial source of sulfate as gypsum.Bicarbonate has concentration ranging from170 ppm in sample no. Rozitta to 500 ppm in sample no22.( El Hammra lake). The highest value was recorded in east portion of the study area. The highest concentrations of bicarbonate reflect dissolution of carbonate rich sediments as well as the effect of Quaternary aquifer recharge at the east of the study area. The relation between salinity (TDS) and major ions were statistically illustrated (Figure 5). This diagram shows correlation between salinity contents and concentration of ions of groundwater of the Pliocene aquifer. Sodium, sulphate and chloride show high correlation coefficients (R2) with salinity contents, the values of correlation coefficients (R2) of these ions are 0.8966, 0.8939 and 0.9464 respectively, this indicates that, the factors, which govern the distribution of salinity in the different localities, are the same factors controlling the distribution of sodium, sulphate and chloride. The factors controlling the distribution of such elements include upward leakage of of Miocene saline water and leaching processes of clay and lagonaal deposits present in aquifer materials. On the other hand, calcium and magnesium show low correlation coefficient (R2 ) with salinity compared with that of sodium, sulphate and chloride, it is 0.2864 and 0.2564 respectively. Bicarbonate shows no correlation with salinity, it displays correlation coefficient (R2 ) 0.0501.
- 7. International Journal of Environment, Agriculture and Biotechnology (IJEAB) Vol-2, Issue-1, Jan-Feb- 2017 http://dx.doi.org/10.22161/ijeab/2.1.42 ISSN: 2456-1878 www.ijeab.com Page | 335 3.2.-Ions dominance and water type of ground and surface water in the study area: The cations and anions for the Pliocene aquifer are determined. 0 2000 4000 6000 8000 0 50 100 150 200 250 300 350 400 450 500 550 600 650 TDS Vs Ca Ca( mg/l) TDS(mg/l) R =0.28642 0 2000 4000 6000 8000 150 200 250 300 350 400 450 500 H C O3( mg/l) TDS(mg/l) TDSVs HCO3 R =0.05012 0 2000 4000 6000 8000 0 10 20 30 40 50 60 70 80 90 100 Mg( mg/l) TDS (mg/l) TDS Vs Mg R = 0.25642 0 2000 4000 6000 8000 0 250 500 750 1000 1250 1500 SO4( mg/l) TDS(mg /l) TDS Vs SO4 R =0.89392 0 2000 4000 6000 8000 0 250 500 750 1000 1250 1500 1750 2000 Na( mg/l) TDS (mg/l) TDS Vs Na R = 0.89662 0 2000 4000 6000 8000 0 500 1000 1500 2000 2500 3000 Cl( mg/l) TDS(mg/l) TDS Vs Cl R =0.94642 Fig.5: Salinity– major ions relationship in the groundwater of the Pliocene aquifer -
- 8. International Journal of Environment, Agriculture and Biotechnology (IJEAB) Vol-2, Issue-1, Jan-Feb- 2017 http://dx.doi.org/10.22161/ijeab/2.1.42 ISSN: 2456-1878 www.ijeab.com Page | 336 The sequences of the ions represent the variation of chemical composition of water, which is mainly controlled by lithology from recharging to discharge area also affected by presence of the fault, cracks and different structures,(Hem, J. D., 1989). In this thesis water type defined by the following 1- Schoellerʼs. 2- Piper 3.2.1 According to Schoellerʼs diagram ( 1962): Firstly for ground water: The majority of groundwater samples have Ion sequences ordering (Na+ >Ca++ >Mg++ ) , Cl- > SO4 -- > HCO3 --) - (HCO3 - > Cl- > SO4 -- ) .Dominance of sodium, calcium and magnesium (Na+ , Ca++ , Mg++ ) as cation, chloride and sulphate (Cl- , So4-- ) as anion in the majority of samples reflect the predominance of sodium and calcium (Na+ , Ca++ ). The dominant salts are Sodium Colrid and Sodium Sulphate water types.From figures(6&7). The prevailing hypothetical salts combinations are NaCl and Na2SO4 water type followed by NaHCO3 . Fig.6: Sodium Chloride facies of groundwater Pliocene aquifer in Wadi El-Natrun Fig.7: Sodium Bicarbonates facies of groundwater Pliocene aquifer in Wadi El-Natrun Secondary for surface water: Ion sequences ordering of surface water samples have cations and anion sequence ordering (Na+ >Ca++ >Mg++ ) ,(Na+ > Mg++ >Ca++ ) and - (Cl- > SO4-- > HCO3 -- ). Dominance of sodium, calcium and magnesium (Na+ ) as cation and chloride and sulphate (Cl- , So4-- ) as anion in the majority of samples reflect the predominance of sodium (Na+ ). Dominant hypothetical salts are Sodium Chlorid and Sodium Sulphate water types (Figure8) Fig.8:Sodium Chloride facies of Surface water in Wadi El-Natrun 0.100 1.000 10.000 100.000 1000.000 Ca Mg Na + K Cl SO4 HCO3 NaCl water type 12 11 10 9 6 Well No. 0.100 1.000 10.000 100.000 Ca Mg Na + K Cl SO4 HCO3 Na HCo₃ water type 35 33 31 30 24 23 7 5 4 Well No. 1 10 100 1000 10000 Ca epm Mg epm Na + K Cl epm SO4 epm HCO3 epm Na-Cl water type 8 22 26 29 41 25 SURFACE WATER SAMPLE No.
- 9. International Journal of Environment, Agriculture and Biotechnology (IJEAB) Vol-2, Issue-1, Jan-Feb- 2017 http://dx.doi.org/10.22161/ijeab/2.1.42 ISSN: 2456-1878 www.ijeab.com Page | 337 3.2.2 Classification of groundwater and surface water According to Piper (1953): The geochemical classification of groundwater is based on ion relationships, the most common are the tri linear diagram of (Piper ,1953). Piper's triangle diagram for groundwater wells consequently show that (Figure9), most groundwater samples and all surface watersamples (Six samples) lie in the upper triangle and has secondary salinity properties, where SO4 -- + Cl- >Na+ + K+ .So, the hypothetical salts are Ca and Mg chlorides and sulphate. Few water samples (represent the eastern part )lies in the lower triangle and the primary alkalinity proportion where CO3-- + HCO3 - > Ca++ + Mg++ and the hypothetical salts are Na and K carbonate and bicarbonate. (A) (B) Fig.9: Piper triangle diagram for groundwater samples (A) and lakes (B) of the Pliocene aquifer. 3.3-Hydrochemical coefficient ratios The relationship between the different major ions ratios is helpful in detecting the previous hydrochemical processes affecting water quality. The hydrochemical coefficients are used as a tool for detecting the origin of groundwater and helped in discovering the previous hydrochemical processes affecting water quality such as leaching, mixing and ion exchange. The hydrochemical coefficients (rNa/rCl, rSO4/rCl,rCa/rMg) and (rHCO3/rCl) revealed good information about the origin of groundwater and helped in detecting the hydrochemical processes affecting water quality. The values of rNa/rCl for the analyzed water samples range between 1.02 and 2.86 in groundwater and between 1.03 and 1.54 in the lakes. These values indicate predominance of sodium over chloride reflecting meteoric water origin. The increase in the concentration of Na+ ion than Cl- inthese water samples is mainly attributed to the dissolution of sodium bearing silicates. The values of hydrochemical coefficient rSO4/rCl range between 0.39 and 1.26 between 0.11 and 0.29 in the lakes. High value of this coefficient is mainly due to the dissolution processes of local terrestrial sulphate minerals present in aquifer materials. The hydrochemical coefficient rCa/rMg shows high values varying from 0.70 to 12.85, between 0.78 and 1.25 in the lakes.which is more related to rainwater value (3.08) than normal sea water (0.21). This confirms the meteoric water origin of groundwater of the Pliocene aquifer in the study area.The value of the hydrochemical coefficient (rHCO3/rCl) in the groundwater varies between 0.04 (well No. 39) at the west of the study area to 1.5 (well No.2) at east with an average of 0.48 in ground water wells. The majority of samples have value more than unity which indicates predominance of bicarbonate over chloride and leaching process of carbonate bearing minerals as well as precipitation of chloride minerals at the east and vice versa at the west where the chloride salts are the dominant The value of the Hydrochemical coefficient (rHCO3/rCl) in the surface water samples varies between 0.006 at sample No.22 (El Hammra lake) at the east of the study area to 0.2 at sample No. 41 ( El Gaar lake) at north with an average of 0.01 in surface water samples, where the chloride salts are the dominant. More confirmation of this concept is the occurrence of NaCl, Na2SO4, MgSO4, CaSO4, Mg(HCO3)2 and Ca(HCO3)2 in groundwater .The presence of marine salts of NaCl, Na2SO4 and MgSO4 and CaSO4 is mainly due to the flushing of salt water by fresh water through local heavy infiltration of rainwater in the past pluvial times and the long –term contact time between rock matrix and
- 10. International Journal of Environment, Agriculture and Biotechnology (IJEAB) Vol-2, Issue-1, Jan-Feb- 2017 http://dx.doi.org/10.22161/ijeab/2.1.42 ISSN: 2456-1878 www.ijeab.com Page | 338 groundwater also, due to the dissolution of these salts encountered in the Quaternary and Pliocene water bearing sediments, return flow of irrigation water and salt water encroachment as a result of over pumping specially at the middle and western portion. 3.4- Water/ Rocks interaction Water/ Rocks interaction focuses on the interactions that occur between groundwater and the solid phases comprising the unsaturated and saturated zone, these solids phase consist of inorganic material (minerals and amorphous compounds) and organic materials. Solid are important to the geochemistry of the system because they are the primary sources and sinks of dissolved constituents. The primary water rocks interaction described in this work are adsorption /desorption and mineral precipitation / dissolution process (Deutsch, W. J. 1997).,(Fattah K.,M. 2012), (Fattah and Abdelrazak, 2014) 3.4.1-Adsorption /desorption Adsorption is the removal of a dissolved species from solution by its attachment to the surface of a solid, desorption is the release of the species back into the solution. Adsorption /desorption will be discussed in term of ion exchange which primary impact the major cation in solution. Adsorption /desorption will be discussed through a-Hypothetical salts b- Cation Exchangeprocess c- The cation exchange index 3.4.1.a- Hypothetical salts combinations Hypothetically, ions of strong acids (Cl- and SO4 2- ) form chemical combination with alkali (Na+ and K+ ) and the rest of acid radicals combine with alkaline earths (Ca2+ and Mg2+ ). If the cations of alkali and alkaline earths are surplus in groundwater, they well combine with anions of the weak acids (CO3 2- and HCO3 - ). The hypothetical salts assemblages of groundwater of Pliocene aquifer have the following assemblage: Assemblage I: NaCl, Na2SO4, NaHCO3, Mg(HCO3)2 and Ca(HCO3)2 (Wells no. 1,2,3,4,5,6,7,9,11,14,15,18,20,21,23,24,27,31,33,35) (57.5% of the total samples). Assemblage II: NaCl, Na2SO4, MgSO4, Mg(HCO3)2, Ca(HCO3)2 (Wells no.12,19,30,34) (11.5% of the total samples). Assemblage III: NaCl, Na2SO4, MgSO4, CaSO4, Ca(HCO3)2 (Wells no.10,13,16,17,28,32,36,38,39,40) (31% of the total samples). Most groundwater samples of the Piocene aquifer are characterized by the following assemblages of salt combination. Assemblages I (three bicarbonate salts) and II (two bicarbonate salts) reflects the effect of pure rain water or fresh surface water on groundwater and also reflect recent recharge (from Quaternary aquifer ). Assemblage III (three sulphate salts), and assemblage II(two sulphate salts) (42% of the total groundwater samples) reflect the effects of leaching and dissolution of evaporation deposits and represent intermediate stages of chemical development. Regarding hypothetical salt combinations of surface water (Lakes) in the study area, all surface water samples have the following assemblage: NaCl, Na2SO4, MgSO4, CaSO4, Ca(HCO₃)₂.(100% of the total surface water samples). Three sulphate salts, reflect the effects of leaching and dissolution of evaporation deposits and represent intermediate stages of chemical development. The presence of three types of sulphate salts with high concentrations which reflects the effect of old marine salt pollution (marine facies groundwater type) with possible contribution of cation exchange phenomena resulting from the presence of the clay intercalated with aquifer in the study area. 3.4.1.b- Cation Exchange process Cation Exchange process is a type of adsorption /desorption phenomenon that applied principle to material with a porous lattice containing fixed charge. Clay minerals are the most common ion exchangers in the soil and aquifer environments. The fixed charge on clay minerals is a result of substitution of Al3+ for Si4+ in the tetrahederal clay lattice sites and Fe2+ and Mg2+ for Al3+ in the octahederal lattic sites, the presence of the lower charged cation in the structure results in a net negative charge on the surface of the clay this evident that, the groundwater types affected by leaching and dissolution of terrestrial salts (assemblages of hypothetical salts combination I,2,3 and 4), are possibly accompanied by cation exchange process. This process is related to clay minerals assemblage, dominated by kaolinite, palygorskite, chlorite, vermiculite and illite (hydrous mica) as well as amorphous inorganic materials .As measured in the laboratory. The cation exchange process leads to an increase or a decrease in the water salinity, temporary hardness (equation 1) and permanent hardness (equation 2) as follows:
- 11. International Journal of Environment, Agriculture and Biotechnology (IJEAB) Vol-2, Issue-1, Jan-Feb- 2017 http://dx.doi.org/10.22161/ijeab/2.1.42 ISSN: 2456-1878 www.ijeab.com Page | 339 Several indices are used for the identification of water that have undergone cation exchange processes (Matthess, G., 1982),(Appelo CAJ and Postma D.2005):. The alkali number is expressed as 100(Na+K)/(Cl, me/l), an increase or decrease of the alkali number is mainly attributed to cation exchange that takes place under three conditions as follows: a- Up to alkali number 100, alkalis in their halogens in solution replace Ca and Mg on the surface of clay minerals in aquifer matrix. b-From 100 to 120 alkaline earths (Ca and Mg) in their sulfates and part of their carbonate in solution replace alkalis on the surface of clay minerals in aquifer matrix. c- Above 120, alkaline earths (Ca and Mg) in their carbonate in solution replace alkalis on the surface of clay minerals in aquifer matrix. From tables (1 in appendix I), most groundwater samples (94%) of the Pliocene aquifer display an alkali number above 120 also most of groundwater types have the assemblages of salt combination I and II which reflect the effect of leaching and dissolution of terrestrial salts (continental facies groundwater) with some contribution of cation exchange process, forming hypothetical salt combination as follows: Assemplage I NaCl, Na2SO4, NaHCO3, Mg HCO3, Ca(HCO3)2 Assemplage II NaCl, Na2SO4, MgSO4, Mg HCO3, Ca(HCO3)2 In this case, alkaline earths (Ca2+ and Mg2+ ) in their carbonate in solution replace alkalis on the surface of clay minerals in aquifer matrix. As a result of cation exchange process, the increase of Na+ concentration and decrease in Ca2+ and Mg2+ concentration in solution and appearance of NaHCO3 salt. This is in agreement with the following cation exchange equation (1): The absence of both NaHCO3 and Mg (HCO3)2 and appearance of Na2SO4 and MgSO4 salts in some groundwater samples, may be result from cation exchange after simple dissolution of Ca(Mg)SO4 salts from the aquifer matrices or the sourrounding area and the catchements areas through heavy local precipitation in the past times that leads to the replacement of NaHCO3 and Mg(HCO3)2 salts by Na2SO4 and Mg(HCO3)2 salts and according to the following reactions: On the other hand, minor groundwater samples (6%) of the Pliocene aquifer have an alkali number that ranges from 100 to 120. These groundwater types are related to the salt combination assemblages I and 2 which reflect the effect of leaching and dissolution of terrestrial salts (continental facies groundwater) combination I and II as follows: Assemplage I NaCl, Na2SO4, NaHCO3, Mg HCO3, Ca(HCO3)2 Assemplage II NaCl, Na2SO4, MgSO4, Mg HCO3, Ca(HCO3)2 In this case, alkaline earths (Ca2+ and Mg2+ ) in their sulfates and part of their carbonate in solution, replace alkalis on the surface of clay minerals in aquifer matrix. This leads to appearance of Na2SO4 and disappearing of CaSO4 As a result of cation exchange process. , the increase of Na+ concentration and decrease in Ca2+ and Mg2+ concentration in solution, lead to a slight decrease in salts causing temporary hardness in form Ca (HCO3)2 which is in equilibrium with PCO2 and permanent hardness in the form of both CaSO4 and MgSO4, while causing a slight increase in water salinity but no change in pH and HCO3- content because each mole of Ca2+ or Mg2+ adsorbed is replaced by 2 moles of Na+ . The loss of Ca2+ and Mg2+ decreases the degree of water saturation with respect to both carbonate and gypsum minerals, leading to ion activity products (IAP) of carbonate and gypsum minerals became less than that of the solubility product constant (KSP), (Freeze, R.A. and Cherry, G.E. 1979). .. This is supported by the finding that groundwater samples are unsaturated with respect to gypsum (sulphates minerals). This case is quite coincident with the following cation exchange equations (1 and 2): The disappearance of both NaHCO3 and Mg (HCO3)2 salts in the groundwater samples are due to the same already mentioned reasons. 3.4.1.c-The Cation exchange index
- 12. International Journal of Environment, Agriculture and Biotechnology (IJEAB) Vol-2, Issue-1, Jan-Feb- 2017 http://dx.doi.org/10.22161/ijeab/2.1.42 ISSN: 2456-1878 www.ijeab.com Page | 340 For further elucidation of the data, the cation exchange index is employed where cation exchange index = rCl – r(Na+K)/ rCl This ratio has either negative or positive values. The negative value means that, alkaline earths (Ca and Mg) in water replace alkalis (Na+ + K+ ) on the surface of clay minerals in aquifer and vice versa in case of positive value, Glynn PD, Plummer LN (2005) . All groundwater samples of the Pliocene aquifer have negative values of cations exchange index, regardless of water salinity. (tables 1 to 3, in appendix I). This means that alkaline earths (Ca and Mg) in water replace alkalis (Na+ and K+ ) on the surface of clay minerals in aquifer matrices. Combination of cation exchange index, alkali number and hypothetical salts data reveals that, most groundwater of the Pliocene aquifer (continental facies groundwater) are characterized by an alkali number above 100, negative values of cation exchange index and terrestrial salts (I and II assemplages). This case is quite coincident with the following cation exchange equations (1 and 2): The disappearance of both NaHCO3 and Mg (HCO3)2 salts in the groundwater samples are due to the same already mentioned reasons. In brief, one can conclude that in most cases, cation exchange phenomenon in the Pliocene aquifer is playing an important role in the hydrogochemistry of the study area and in the relation of water rocks interaction. 3.5.- Spatial variation in groundwater chemistry: Spatial variation in groundwater using toexplain geochemicalevolution, geochemical variation and water- rock interaction of the local groundwater in the study area through the Pliocene aquifer.Geochemical profiles was performed for three groundwater paths (South, Centre and North path 1 (A-A ), path 2(B-B ) and path 3 (C-C ) Figure(10) 3.5.1. Along the east–west in southern part ;(Profile A – A cross section) This profile passes through Three productive wells (33,27,37) representing the Pliocene aquifer (Figure11). This hydrochemical profile is developed along the Pliocene aquifer in the study area from east to west direction, where the general flow of groundwater is in the same direction. From this profile (Figure11) the following points could be concluded: 1-The total dissolved salts (TDS) increase in the west direction in the same direction of groundwater flow to reach their maximum values at well No. 37 (1280 mg/l) in middle part of study area. 2- The behavior of different ions concentration is developed along the profile where there is increasing in each of Na, Ca and Cl, in west direction while the content of each of Mg, SO4 and HCO3 decrease in the same direction. 3- There is superiority of Na+ over Cl⁻ in all groundwater sample, indicating leaching and dissolution of terrestrial salts. 4-Carbonate contents represent about 24 % from TDS at the east part (well 33) while it reach to about 5% from TDS at the west. 5- The assemblage I of salt combination KCL, NaCl, Na2SO4, NaHCO₃ ,Mg(HCO3)2 and Ca(HCO3)2 is dominant in ground water samples in the east direction, while the assemblage II of salt combination KCl, NaCl, Na2SO4, MgSo4, CaSO4, Ca(HCO3)2(Well NO.37)is dominant in ground water samples in the west direction. 6- The ions displays two grades of metasomatism along this profile, first the stage of mineralization ( HCO3>Cl>So4) at wells No. ( 33 , 27) then the advanced stage of mineralization (Cl>SO4 >HCO3) at well no 37. These agree with the general gradient of chemical evolution of groundwater.
- 13. International Journal of Environment, Agriculture and Biotechnology (IJEAB) Vol-2, Issue-1, Jan-Feb- 2017 http://dx.doi.org/10.22161/ijeab/2.1.42 ISSN: 2456-1878 www.ijeab.com Page | 341 ( A) (B) Fig.10: Profiles selected along the groundwater wells (A) and lakes (B) 3.5.2-Along the east – west in middle part ; (Profile B – B cross section) This profile passes through three wells (2,21,39) (Figure12). The total salinity of the groundwater along this profile is (410 mg/l at well No.2) then increases to( 1206 mg/l at well No21) then increases in the west direction to reach their maximum value at well NO.39 (6822 mg/l). Bicarbonate content represents 35 % from TDS at (well
- 14. International Journal of Environment, Agriculture and Biotechnology (IJEAB) Vol-2, Issue-1, Jan-Feb- 2017 http://dx.doi.org/10.22161/ijeab/2.1.42 ISSN: 2456-1878 www.ijeab.com Page | 342 No.2) then gradually decreases to 9 % from TDS at(well No.21) then it decreases to 4% from Tds at well No 39/. While the concentration of SO4 and Cl are generally increase in the west direction along this profile. Concerning the metasomatic change of water chemistry in horizontal direction, it is clear that the groundwater of the Pliocene aquifer in this profile has change in groundwater composition, one can notice that KCl, Mg(HCO3)2, Na2SO4and NaHCO3 salts has changed behavior between increasing in well no 2 and decreasing in well 39 , this behavior may relate to recharge from the Quaternary aquifer in well no. 2 while NaCl increases in west direction in well no. 39 this agree with the general gradient of chemical evolution of groundwater. The assemblage of salts combination (I) KCl, NaCl, Na2SO4 NaHCO3,Mg(HCO3)2 and Ca(HCO3)2 is the dominant in groundwater samples at wells No (2,21). The assemblage of salts combination (II) KCl,NaCl, Na₂So₄ MgSO4, CaSO4 and Ca(HCO3)2.at well No39. The ions displays two grades of metasomatism along this profile, the first grade is a less advanced stage of mineralization (HCO3 > SO4 > Cl) at east part and the second grade is a more advanced stage of m ineralization( Cl> SO4> HCO₃) at west part. These agree with the general gradient of chemical evolution of groundwater. Fig.11: Hydrochemical cross section A - A'
- 15. International Journal of Environment, Agriculture and Biotechnology (IJEAB) Vol-2, Issue-1, Jan-Feb- 2017 http://dx.doi.org/10.22161/ijeab/2.1.42 ISSN: 2456-1878 www.ijeab.com Page | 343 Fig.12: Hydrochemical cross section B - B' Fig.13: Hydrochemical cross section C - C' 3.5.3.Along the east – west in nortern part ;(Profile C – C cross section) This profile passes through three productive wells (5,9,12) representing the Pliocene aquifer (Figure13). This hydrochemical profile is developed along the Pliocene aquifer in the study area from east to west direction, where the general flow of groundwater is in the same direction. From this profile the following points could be concluded: -The total dissolved salts (TDS) are increased from (691 mg/l ) at well NO. 5 at east to reach their maximum values at well No.9 ( 3712mg/l) then it decreases o(2432 mg/l at well no. (12) in west direction. Bicarbonate contents represent about 33 % from TDS at eastern part (Well No. 5) then it decreases to 5% at Well No. (9) thenit increases to 7% at well no.12 in west direction. The concentration of sulphate and chloride are generally increase groundwater flow direction along this profile follow the geochemical evolution system reported by(Burdon1958),(Back, W. and Hanshaw, B. B. 1979): this suggestion is agreement with the fact that there is recharge and groundwater flow from east to west direction. Concerning the metasomatic change of water chemistry in horizontal direction[21] Glynn PD, Plummer LN (2005), it is clear that the groundwater of the Pliocene aquifer in this profile has change in groundwater composition, one can notice that NaCl, increased towards west direction, while KCl, Na2SO4,NaHCO3 Ca(HCO3)2 and Mg(HCO3)2 salts decrease in the same direction. The 0 50 100 5 9 12 Hypotheticalsalts(epm %) Well no. Na Cl MgSO4 Mg (HCO3)2 Ca(HCO3)2 Na2SO4 NaHCO3
- 16. International Journal of Environment, Agriculture and Biotechnology (IJEAB) Vol-2, Issue-1, Jan-Feb- 2017 http://dx.doi.org/10.22161/ijeab/2.1.42 ISSN: 2456-1878 www.ijeab.com Page | 344 assemblage of salts combination(I) KCL, Nacl, Na2SO4, NaHCO3 , Mg (HCO3)2 andCa(HCO3)2is the dominant in groundwater samples in east direction well no (5,9) .while the assemblage of salt combination (II) KCL, Nacl, Na2SO4,MgSO4, Mg(HCO3)2 and Ca(HCO3)2 is dominant in groundwater samples in the west direction well no( 12). The ions displays different grades of metasomatism along this profile, the first grade is a less advanced stage of mineralization (HCO3 > Cl>SO4 ) at the east point well ( NO. 5).The second behavior is (Cl > SO4> HCO3 ) at wells no (9,12) These indicated that evolution degree reaches the maximum. 3.6- Evaluation of groundwater: 3.6.1- Evaluation of groundwater for drinking. According to the World Health Organization (W.H.O.2005) the maximum permissible limits of TDS in drinking water is 1000 mg/l. It’s concluded that 45 % of tested groundwater samples are permissible, while 55 % not permissible 3.6.2- .Evaluation of groundwater for irrigation 3.6.2.a-According to U.S. Salinity Laboratory Staff (1954): Groundwater samples collected from the Pliocene aquifer in the study area were evaluated according to U.S. Salinity Laboratory Staff (1954)based on the Sodium Adsorption Ratio (SAR), and the specific conductance (Figure14). The recommended classification of water for irrigation according SAR ranges are shown in (Table 3 in App.). SAR = Na+ /[ (Ca++ + Mg++ )/2]1/2 .Where, the concentrations of these cations are expressed in epm. According to the U.S. Salinity Laboratory diagram Fig(14). As recorded above, it clears that: 24 % of groundwater samples of the Pliocene aquifer fall in the good water class (C2-S1) and class (C2-S1) which good for soils of medium permeability for most plants. 51% fail in the moderate water class (class (C2-S2) and class (C3-S2) which Good with coarse grained permeability soils, unsatisfactory for highly clayey soils with low leaching and Satisfactory for plants, having a moderate salts tolerance on soils of moderate permeability with leaching. 20% fail in the intermediate and 6% fail in bad water class Suitable only with good drainage and satisfactory for salt tolerant crops on soils of good permeability with special leaching. Fig.14: Water classification for irrigation (according to US Salinity Lab. 1954 3.6.2.b- Evaluation of groundwater according to Residual Sodium Carbonate (RSC): When the sum of carbonate and bicarbonate is in excess of calcium and magnesium, there is almost complete precipitation of the latter (Eaton, 1950). This can cause an increase in the proportionate amount of sodium, and so, the effect on the soil is high. The term Residual Sodium Carbonate is defined as follows: RSC = (CO3 -- + HCO3 -- ) – (Ca++ + Mg++ )inepm.(Richards ,1954) stated that, water having more than 2.5epm RSC is not suitable for irrigation, water containing (1.25-2.5 epm) RSC is
- 17. International Journal of Environment, Agriculture and Biotechnology (IJEAB) Vol-2, Issue-1, Jan-Feb- 2017 http://dx.doi.org/10.22161/ijeab/2.1.42 ISSN: 2456-1878 www.ijeab.com Page | 345 marginal, and water have less than 1.25epm RSC is probably safe. According to the calculated RSC of the Pliocene groundwater samples, (Appendix1, table 3), 48.5% of groundwater samples safe for irrigation purposes, 28.5 % of groundwater samples are marginal and this water is suitable for irrigation in this area under normal condition. and 23% from the samples is not suitable for irrigation according to( RSC). 3- CONCLUSIONS Using geological, hydrological and hydrogeochemical knowledge's a clear understanding of the origin of hydrogeology, hydrogeochemistry and water resources patterns in the Pliocene aquifer at Wadi El Natrun area.Depth towaterofthePlioceneaquifervariesfromabout20mto30moutsidewadi El Natrun and less than 10 m to flowing in the surface inside Wadi El Natrun. TheGroundwaterflowsfromnortheastandsoutheast to southwest and northwest i.e. to Wadi El Natrun..The groundwater flow, recharge and geochemical evolution in the study area are complex and effected by the geological sequence, there is a zonation of chemical composition,. This zonation is Characterized by a change of cation species from dominantly Ca and Mg near the east to Na-dominated waters in the west. Mirroring this, anions change from HCO3 type to Cl and SO4 type. From spatial variation in groundwater chemistry,the assemblage (I) of hypothetical salt combination KCL, NaCl, Na2SO4, NaHCO₃ ,Mg(HCO3)2 and Ca(HCO3)2 is dominant in ground water samples in the east direction, while the assemblage (II) of hypothetical salt combination KCl, NaCl, Na2SO4, MgSo4, CaSO4, Ca(HCO3)2 is dominant in ground water samples in the west direction. The ions displays two grades of metasomatism along this profile, first the stage of mineralization ( HCO3>Cl>So4) at wells No. ( 33 , 27) at the east then the advanced stage of mineralization (Cl>SO4 >HCO3) at well No.(37) at the west. These agree with the general gradient of chemical evolution of groundwater.The regional geochemical variation in the study area from east to west is principally controlled by heterogeneity of aquifer composition complex of groundwater flow patterns beside the geochemical evolution processes (leaching, dissolution and precipitation) along groundwater flow path.According to the World Health Organization (W.H.O.2005) the maximum permissible limits of TDS in drinking water is 1000 mg/l. It’s concluded that 45 % of tested groundwater samples are permissible, while 55% are not permissible, most of groundwater samples according to SAR (45.5%) of the sample are excellent, 17% are good, 13.5% are fair and 24% are poor for irrigation which reflects suitability of most groundwater in the study area for irrigation purposes under normal condition. According to the calculated RSC of the Pliocene groundwater samples, (Appendix1, table 3), 48.5% of groundwater samples safe for irrigation purposes, 28.5 % of groundwater samples are marginal and this water is suitable for irrigation in this area under normal condition, while 24% from the samples is not suitable for irrigation according to( RSC). All surface water samples are saline water( lakes) so it is not valid for different purposes ,because of the high saline (TDS) content, so surface water in the study area is not available for drinking or irrigation purposes. REFERENCES [1] Abdel Baki, A. M A. (1983):"Hydrogeological and Hydrogeochemical studies in the area west of Rosetta branch and South El Nasr canal", Ph. D. Thesis, Faculty of Science, Ain Shams Univ. 156 p. [2] ASTM, American Society for testing and material (2002). In "water and environmental technology". annual book of ASYM standars, Sec. 11, Vol. 11.01 and 11.02, West Conshohocken, U.S.A. [3] Appelo CAJ and Postma D.(2005). Geochemistry, groundwater and pollution.A.A. , Second edition, Amesterdam, the Netherlands, Balkema 649 p. [4] Back, W. and Hanshaw, B. B. (1979): “ Major geochemical processes in the evolution of carbonate aquifer system’’ . Elsevier Scientific Publishing Company, Amesterdam, The Netherlands. [5] Burdon, D.J. (1958). Metasomatism of groundwater at depth, UNESCO course on Hydrology, Desert Institute, Cairo, Egypt. [6] Deutsch, W. J. (1997). Groundwater Geochemistry: fundamentals and application to contamination. Lewis puplishers, Boca Raton, New York. 221p. [7] Diab, M.Sh., Gad, M.I., Abd-el Baki, and El Sheihk, A.A. (2002): Study the effect of new reclamation projects on the groundwater system in the area northwest Wadi El Natrun and south El Nasr by using mathematical modeling. Final program and Abstracts at the Third International Conference, Groundwater level control Inside Urbanized Areas, Fac. Eng., Mansoura Univ., El Mansoura, December, 17 – 19, 2002. [8] Domenico, P.A., and Schwartz, F.W., (1990): Physical and chemical hydrogeology: John Wiley and Sons, New York, 824 p. [9] El- Abd, E. A. (2005): The Geological impact on the water bearing formations in the area south west Nile
- 18. International Journal of Environment, Agriculture and Biotechnology (IJEAB) Vol-2, Issue-1, Jan-Feb- 2017 http://dx.doi.org/10.22161/ijeab/2.1.42 ISSN: 2456-1878 www.ijeab.com Page | 346 Delta, Egypt., Ph.D. Thesis, Geol. Depart. Fac. Sci; MenoufiaUniv; 319 p. [10]El-Fayoumy, I.F.; (1987):"Geology of the quaternary succession and its impacts on the groundwater reservoir in the Nile Delta region, Egypt. submitted to the bull. Fac. of Sci. Menoufia Univ. [11]El Ghazawi, M.M. (1982):Geological studies of the Quaternary –Neogeneaquifers in the area northwest Nile Delta. M.Sc. Thesis, Fac. Sci, El AzharUniv, Cairo, Egypt,170 p. [12]El Sheikh, A.E. (2000): Hydrogeology of the area north and west of Wadi El Natrun. M. Sc. Thesis, Fac. Sci., Minufia Univ., Shibbin El Kom, Egypt, 177p. [13]Eaton, F.M. (1950): “Significance of carbonates in irrigation water”. Soil Sci., Vol. 69, No.2, pp.123-133. [14]Fattah, K. M. (2012): Hydrogeochemical evaluation of the Quaternary aquifer in El Sadat city, Egypt. Arabian Journal for science and engineering, Springer, vol.37, pp.121-145. [15]Fattah, M. K. and Abdelrazek, S. A.( 2014): "The Improvement of the Quality of Irrigation Water Contaminated with Heavy Metals in the Borg El Arab, Egypt". Journal of Water Resource and Protection, 6, P. 1703-1715. [16]Freeze, R.A. and Cherry, G.E. (1979).Groundwater. Prentice - Hall, Englewood Cliffs, New Jersey, U.S.A.460 p. [17]Glynn PD, Plummer LN (2005) Geochemistry and understanding of groundwater systems. Hydrogeology J. volume 13:pp 263–287. [18]Hem, J. D., (1989): Study and interpretation of the chemical characteristic of natural water. U.S. geol. Surv., Water supply paper 2254, 3rd edition, 264 p. [19]Lyon WB, Bird DA. (1995) : Geochemistry of the Madeira River Brazil: comparison of seasonal weathering reactions using a mass balance approach. Journal of South American Earth Science ; Volume 8, Number 1. Elsevier pp:97-101 . [20]Matthess, G., (1982): The Properties of Groundwater.” John Wiley & Sons, New York. [21]Piper,A.M.(1953).A graphic representation in the geochemical interpretation of groundwater analyses. American Geophysical Union Transactions, U.S.A.,volume 25, pp 914-923. [22]Richards, L.A. (1954): Diagnosis and improvement of saline and alkaline soils. U. S. Agric. HANDBOOK, No. 60, U. S. Dept. Agric. Washington D. C., pp.69 – 82. [23]Said, R. (1990): The geology of Egypt For the Egyptian gen. pet .cor. Conoco Hurghada Inc., and repsol exploration, Balkema, Rotterdam, Netherlands. [24]Sanad (1973): "Geology of the area between Wadi El- Natrun and theMoghra Depression", Ph. D. Thesis, Faculty of Science, AssuitUniv.,Assuit, Egypt, 184 p. [25]Schoeller, R. (1962): Les eauxSouterraines, Msson and Cie, Paris, 642pp. [26]Soulsby C, Chen M, Ferrier RC, Helliwell RC, Jenkins R, Harriman R.(1998). Hydrogeochemistry of shallow groundwater in an upland Scottish catchment. Hydrological Process;12, pp 1111-1117. [27]U.S. Salinity Lab. Staff. (1954): “diagnosis and improvement of saline and alkaline soils”. U.S. Dept. Agric., Handbook No. 60. [28]World Health Organization (WHO) (2005): International standards for drinking Waters. 5th Edition, Vol.1 Geneva, Switzerland. 130P.
- 19. International Journal of Environment, Agriculture and Biotechnology (IJEAB) Vol-2, Issue-1, Jan-Feb- 2017 http://dx.doi.org/10.22161/ijeab/2.1.42 ISSN: 2456-1878 www.ijeab.com Page | 347 Appendix (1) , Table (1) : Chemical analyses of groundwater samples of the Pliocene aquifer Anions (ppm)Cations (ppm)PHTDSEC mmohs Sample No. CO3HCO3SO4ClCaMgNaK 820520026112.810.7290408.3610501.641 01459055164.8410288.324100.642 32170901354012.15143138.256020.943 026095140402.4318077.326881.074 16215135110324.86165127.756911.085 830914001750329.721850387.853448.356 12320130180249.72252198.288961.47 281766441600247.29139038.2337125.89 01606701230649.721061448.0331874.9810 12160400414329.72450268.3115422.4111 121686237705617.01757288.0424323.812 4108470573647.92540258.1817922.813 02206161100402.431020367.5930724.814 02106501258327.291134377.9433155.1815 0150756644644.96742207.9922593.5316 014590010277217.011020287.83200517 896340347164.86394158.2312161.918 0240300550649.72487207.5516132.5219 12220152145324.86200147.57681.220 16100380296169.72380137.4812061.8821 10170110952414.5812237.565310.8323 36250110160329.72175867.58481.3224 021095115162.43147507.486270.9827 01003835904814.58502327.5516642.6628 01006150324.865167.53020.4730 61303640162.437077.553130.4931 08627215051.221.39123647.57630.1232 024990901616.52130277.486210.9733 01112003003219.44250177.559300.1434 01606060167.89477.564140.6435 015012825062.43.4195127.58000.1236 1010031041012810.7271367.5512802.0037 010254067364.114.6621207.520223.1638 0227110030001446.82360327.48682210.639 01103608319611.6661777.5526504.1440
- 20. International Journal of Environment, Agriculture and Biotechnology (IJEAB) Vol-2, Issue-1, Jan-Feb- 2017 http://dx.doi.org/10.22161/ijeab/2.1.42 ISSN: 2456-1878 www.ijeab.com Page | 348 Appendix (1) Table (2) : Chemical analuses of surface water (Lakes) at Wadi El natrun Anions (ppm)Cations (ppm)PHTDSEC mmohs Sample No. CO3HCO3SO4ClCaMgNaK 684007600910020090908054092707042.3ElBaida (8) 36500209005400030020044200500912288 0 192ElHamm ra(22) 601704500168002501701230045093481654.4Rozitta (26) 1626090003465030012031900400985120133Um Richa(25 ) 0205220055009070435020091209618.9Beni Salama( 29) 1631614509888200120660030091804828.2ElGaar (41) Appendix (1) Table.3: Residual Sodium Carbonate (RSC) and Sodium adsorption ratio (SAR): SARRSCEC(mmos/cm)TDS(PPm)Well NO. 14.471.841.6401050W1 5.731.180.640410W2 5.080.860.940602W3 7.462.061.075688W4 7.962.051.080691W5 73.44*2.67**8.3505344W6 10.962.261.400896W7 63.71*1.095.8003712W9 32.65*1.384.9803187W10 17.860.222.4101542W11 22.721.053.8002432W12 26.3*1.92.8001792W13 41.46*1.394.8003072W14 47.72*1.245.1803315W15 24.021.143.5302259W16 28.05*2.62**5.0003200W17 22.120.371.9001216W18 14.970.172.5201613W19 8.872.011.200768W20 18.480.581.8851206W21 4.840.390.830531W23 7.180.881.325848W24 9.472.440.980627W27
- 21. International Journal of Environment, Agriculture and Biotechnology (IJEAB) Vol-2, Issue-1, Jan-Feb- 2017 http://dx.doi.org/10.22161/ijeab/2.1.42 ISSN: 2456-1878 www.ijeab.com Page | 349 16.271.952.6601664W28 2.220.360.472302W30* 2.071.330.490313W31 3.642.92**1.192763W32 3.292.64**0.970621W33 3.741.381.453930W34 3.611.180.647414W35 6.500.941.250800W36 6.185.31**2.0001280W37 18.192.74**3.1602022W38 52.09*4.04**10.6606822W39 15.813.96**4.1402650W40