SlideShare a Scribd company logo
1 of 141
Effects of episodic fluid flow on hydrocarbon migration in
the Newport-Inglewood Fault Zone, Southern California
B. JUNG1, G. GARVEN 2 AND J. R. BOLES3
1Department of Earth Sciences, Uppsala University, Uppsala,
Sweden; 2Department of Earth and Ocean Sciences, Tufts
University, Medford, MA, USA; 3Department of Earth Science,
University of California, Santa Barbara, CA, USA
ABSTRACT
Fault permeability may vary through time due to tectonic
deformations, transients in pore pressure and effective
stress, and mineralization associated with water-rock reactions.
Time-varying permeability will affect subsurface
fluid migration rates and patterns of petroleum accumulation in
densely faulted sedimentary basins such as those
associated with the borderland basins of Southern California.
This study explores the petroleum fluid dynamics of
this migration. As a multiphase flow and petroleum migration
case study on the role of faults, computational
models for both episodic and continuous hydrocarbon migration
are constructed to investigate large-scale fluid
flow and petroleum accumulation along a northern section of
the Newport-Inglewood fault zone in the Los
Angeles basin, Southern California. The numerical code solves
the governing equations for oil, water, and heat
transport in heterogeneous and anisotropic geologic cross
sections but neglects flow in the third dimension for
practical applications. Our numerical results suggest that fault
permeability and fluid pressure fluctuations are cru-
cial factors for distributing hydrocarbon accumulations
associated with fault zones, and they also play important
roles in controlling the geologic timing for reservoir filling.
Episodic flow appears to enhance hydrocarbon accu-
mulation more strongly by enabling stepwise build-up in oil
saturation in adjacent sedimentary formations due to
temporally high pore pressure and high permeability caused by
periodic fault rupture. Under assumptions that
fault permeability fluctuate within the range of 1–1000
millidarcys (10�15–10�12 m2) and fault pressures fluctuate
within 10–80% of overpressure ratio, the estimated oil volume
in the Inglewood oil field (approximately 450 mil-
lion barrels oil equivalent) can be accumulated in about 24 000
years, assuming a seismically induced fluid flow
event occurs every 2000 years. This episodic petroleum
migration model could be more geologically important
than a continuous-flow model, when considering the observed
patterns of hydrocarbons and seismically active
tectonic setting of the Los Angeles basin.
Key words: episodic fluid flow, fluid flow in faults, multiphase
flow in siliciclastic sedimentary basins, petroleum
migration
Received 21 May 2013; accepted 16 October 2013
Corresponding author: Byeongju Jung, Department of Earth
Sciences, Uppsala University, Gl227 Geocentrum,
Villav€agen 16B, 753 36 Uppsala, Sweden.
Email: [email protected] Tel: +46 018 471 2264. Fax: +1 617
627 3584.
Geofluids (2014) 14, 234–250
INTRODUCTION
Large-scale faults in sedimentary basins have become
increasingly studied due to their important role in convey-
ing and compartmentalizing hydrocarbons (Aydin 2000;
Boles et al. 2004; Karlsen & Skeie 2006; Kroeger et al.
2009; Zhang et al. 2009; Gong et al. 2011). The hydro-
mechanical properties of faults in active continental mar-
gins are strongly affected by tectonic deformation, so
considering the fluid dynamics of faults will likely improve
our understanding of petroleum migration (Reynolds &
Lister 1987; Blanpied et al. 1992; Sibson 1994; Appold &
Garven 2000; Yamaguchi et al. 2011). For example, there
is abundant geological evidence, at both macroscopic and
microscopic scales, that faults focus fluid flow over long
periods of time but later are sealed by mechanical compac-
tion and chemical reactions causing mineral precipitation
(Eichhubl & Boles 2000; Caine et al. 2010; Faulkner et al.
2010). The hydrologic activity of fault zones may also
depend highly on earthquakes, which in turn may induce
periodic fluctuations in pore fluid pressure and fault per-
meability (Evans 1992; Sibson 1994). Furthermore, large-
© 2013 John Wiley & Sons Ltd
Geofluids (2014) 14, 234–250 doi: 10.1111/gfl.12070
scale fault zones may affect regional hydrocarbon migration
by regulating the spatial distribution of overpressure in the
subsurface (Sperrevik et al. 2002; Fisher et al. 2003; Sork-
habi & Tsuji 2005). Laboratory experiments on fractured
rock show that active shear faults are more permeable than
the adjacent country rock by two to three orders in magni-
tude. These faults then become less permeable when deac-
tivated (Aydin 2000).
The mechanism of recurring fluid pressure build-up, hy-
drofracturing, fluid surge, and fault sealing can also be a
potential means for hydrocarbon migration (Bradley 1975;
Walder & Nur 1984; Mandl & Harkness 1987). For exam-
ple, field observations of brecciated rocks and hydrother-
mal veins from the Stillwater fault zone in Nevada indicate
that petroleum migration was not completed as one single
flow event, but rather accumulation too place over many
episodes of oil flow during the deformation history (Caine
et al. 2010). Geochemical evidence from hydrocarbon con-
densates found in the South China basin also support the
notion that petroleum migration occurs simultaneously
with episodes of hydrothermal fluid flow (Guo et al.
2011).
We further hypothesize that the hydrodynamic effects of
multiphase flow are more effective for long-distance trans-
port, during periods of strong overpressuring associated
with episodes of seismically controlled fluid flow. Episodic
flow associated with large faults may also be more effective
than long-term continuous or steady flow of hydrocarbons,
as might be envisioned for a slowly subsiding sedimentary
basin. To test this hypothesis, we conduct 2D finite ele-
ment simulations for multiphase flow in geologically com-
plex cross sections through a basin. We introduce two
migration scenarios of continuous flow and of episodic
flow, which likely account for the current distribution of
hydrocarbon pools such as the Inglewood oil field. The
continuous models assume constant fault permeability and
fluid pressure throughout the simulation time, while those
conditions are time varying in the episodic models. We first
compared the fluid pressure, subsurface temperature, and
petroleum saturations from these models and then per-
formed sensitivity studies on the fault permeability and the
frequency of episodic flow pulses to understand how these
permeability transients might affect overall hydrocarbon
migration and accumulation patterns in a faulted sedimen-
tary basin.
GEOLOGIC SETTING
The Los Angeles (LA) basin is one of the most prolific
hydrocarbon-producing areas on Earth, and it hosts histor-
ically giant oil fields. From the geological survey, it was
recognized that the upper Miocene formations contain
organic-rich sediments and play an important role as the
primary hydrocarbon source rock. Most of the hydrocar-
bons were thermally matured in the central part of the
basin (the central syncline area) and have migrated to the
edges, which are laterally confined by regional-scale fault
zones (Biddle 1991; Jeffrey et al. 1991). The Newport-
Inglewood fault zone is one of the major regional fault sys-
tems that structurally border the southwestern side of the
LA basin, and numerous hydrocarbon reservoirs are closely
associated with the fault structure (Fig. 1A). In the Ingle-
(A) (B)
Fig. 1. Faults and oil fields in the Los Angeles basin (after
Wright 1991): (A) LA basin, (B) Inglewood oil field.
© 2013 John Wiley & Sons Ltd, Geofluids, 14, 234–250
Effects of episodic fluid flow 235
wood oil field located on the northern part of the fault
zone, the main production area exists at the intersection
between the Newport-Inglewood and Sentous faults and is
elongated along the trends of both faults (Fig. 1B). Geo-
chemical indicators and biomarkers also suggest the hydro-
carbons discovered in this area have mostly migrated
approximately 10–15 km from the deep basin center with
minor mixing of indigenous petroleum (Kaplan et al.
2000). Tectonic deformation and subsequent seismic activ-
ity make this region attractive for studying the relationship
between hydrocarbon migration and active fault structures
in young sedimentary basins.
The Newport-Inglewood fault zone consists of a series
of en echelon strike slip faults that were reactivated during
the late Pliocene transpressional deformation (Pasadena
Orogeny) and transformed into more complicated anticline
structures containing normal and reverse faults (Fig. 2).
Hydrocarbon reservoirs exist in multiple sedimentary for-
mations but are more concentrated in Pliocene strata con-
taining a high proportion of sandstone. Many productive
petroleum reservoirs align with the trend of the Newport-
Inglewood fault zone, which extends and merges with the
Central Basin d�ecollement at about 10 km depth (Shaw &
Suppe 1996).
The permeability of these sandstones ranges from 10’s
to 1000’s millidarcys (10�14–10�12 m2) for sandy Plio-
cene formations (Hesson & Olilang 1990). The thickness
of sediments in the central syncline is approximately
10 km and becomes gradually thinner toward the north-
ern and southwestern edges of the basin (Blake 1991;
Fig. 3). Figure 4A shows an outcrop of channel-fill sand-
stones (Sespe Formation) in the adjacent Santa Barbara
area. The faults in these rocks are filled with carbonate
mineral precipitates and lithified hydrocarbons, which is
strong evidence that the fault zone provided active chan-
nels for hydrocarbon fluids, but later these were sealed
by subsequent reactions involving diagenetic-hydrother-
mal mineralization as fluids cooled or the pressure rap-
idly dropped (Fig. 4B). Five separate hydrogeologic units
were considered here: middle and pper Miocene, lower
and upper Pliocene, and Pleistocene formations (Fig. 3).
The middle Miocene unit (Topanga Formation) consists
of medium to coarse sandstones with intercalated shale
layers. The upper Miocene sediments (Puente Formation)
are mostly siltstone and silty sandstone with interbedded
pelagic mudstone and shale layers (nodular shales in
some areas) that contain high organic carbon contents
(10–16%). This formation is often considered to be the
primary source rock for petroleum generation (Jeffrey
et al. 1991). The lower Pliocene unit (Repetto forma-
tion) serves as a major reservoir for hydrocarbon accu-
mulation. The Repetto consists of fine to coarse
sandstones with interbedded siltstone and shale layers
that have relatively high permeability of 10–100 md
(10�14–10�13 m2) (Higgins & Chapman 1984). The
geology of the upper Pliocene unit (Pico formation) is
very similar to the Repetto formation, consisting of inter-
bedded sandstone and siltstone, but with slightly lower
permeability. The Pleistocene unit (San Pedro formation)
consists of relatively uniform and highly permeable sand
layers interbedded with minor gravel, silt, and shale lay-
ers (Olson 1978).
We propose that north–south transpressional tectonic
stresses pressurized the basin continuously from the late
Pliocene to the present. A coupled mechanism of tec-
tonic loading, pore fluid pressure build-up, fault instabil-
ity, and fluid flow may have induced episodic fluid flow
events (Sibson 1994). Elevated effective stress and pore
pressure by tectonic loading compact the sedimentary
rocks during the interseismic periods, making the fault
zone mechanically unstable. When ruptured, high perme-
ability and low pore pressure temporarily create focused
fluid flow in the fault zone. The fault stays open for a
relatively short period of time due to hydromechanical
compaction as the pore pressure decreases, and then
sealed further by hydrothermal mineral precipitation
(Fig. 5). The continuous tectonic stress and rebuilding of
pore pressure cause this cycle to repeat after the fault
zone becomes sealed. Field observations of petroleum
and carbonate mineral deposits in other siliciclastic faults
suggest an episodic nature of injected fluids (Eichhubl &
Boles 2000; Garden et al. 2001), and these episodic flow
patterns may affect the geohydrologic controls on hydro-
carbon accumulation. We modeled this dynamic aspect of
fault zone to understand its effects on petroleum migra-
tion and entrapment.
Fig. 2. Cross section of the Newport-Inglewood fault zone along
the tran-
sect X–X′ (courtesy of Plains Exploration and Production
Company, 2008).
© 2013 John Wiley & Sons Ltd, Geofluids, 14, 234–250
236 B. JUNG et al.
MULTIPHASE FLOW MODEL
To model petroleum migration in the basin, we need to
predict fluid saturation and pressure for both the wetting
phase (formation water) and nonwetting phase (oil). The
governing equations for multiphase fluid flow can be
derived from the fluid mass conservation equations, as
written by Bear (1972):
(A) (B)
Fig. 4. Outcrop pictures of organic-rich sedimentary rocks in
California: (A) channel-fill sandstones in nonmarine Sespe
Formation (Oligocene) from Old San
Marcos road, Santa Barbara County, CA, (B) tar-filled fault
breccia in Monterey Formation at Arroyo Burro beach, Santa
Barbara County, CA.
Fig. 3. Lithostratigraphy of the Los Angeles
basin, modified from Blake (1991).
© 2013 John Wiley & Sons Ltd, Geofluids, 14, 234–250
Effects of episodic fluid flow 237
/
@ðqwSwÞ
@t
¼ �O � ðqwvwÞ þ qwmw ð1Þ
/
@ðqnSnÞ
@t
¼ / @ðqnð1 � SwÞÞ
@t
¼ �O � ðqnvnÞ þ qnmn ð2Þ
where / is the effective porosity of a formation, and S is
the saturation of the phase: the subscripts n and w denote
the nonwetting (liquid petroleum) and wetting (water)
phases, respectively. Additionally, q is mass density of the
fluid, m is a source/sink term, and v is the Darcy velocity
(specific discharge) of each fluid phase, expressed as fol-
lows:
vw ¼ �kwkðOqw � qwgÞ ð3Þ
vn ¼ �knkðOqn � qngÞ ¼ �knðOqw þ Oqc � qgÞ ð4Þ
where k is the intrinsic permeability tensor, p is fluid pres-
sure, g is a gravitational vector (g = (0, 0, �g)), and pc is
capillary pressure (pc = pn – pw). The parameter, k, is the
mobility coefficient and defined by the ratio of relative per-
meability (kr) and dynamic viscosity (l) as:
kw ¼ krw=lw; kn ¼ krn=ln ð5Þ
After a few steps of algebraic manipulation, the pressure
and saturation equations can be decoupled. If slightly com-
pressible fluids are assumed, the final form of average pres-
sure and saturation equations can be written as follows
(Geiger et al. 2004):
/ct
@ �P
@t
¼ O � kfktO�P � 0:5ðkw � knÞOpc�
ðkwqw þ knqnÞggþmt
ð6Þ
/
@Sn
@t
¼ O � ½fnvt � �kkfOqc þ ðpw � pnÞgg� � mt ¼ 0 ð7Þ
where ct is bulk compressibility of a medium, and mt is a
source/sink term. vt is the sum of water and petroleum
velocites (vt = vw + vn). The average pressure �P is an arith-
metic mean of the water and petroleum pressure, and f is a
fractional flow coefficient that is also defined for simplicity:
fw ¼
kw
kt
; fn ¼
kn
kt
; and �k ¼ kwkn
kt
ð8Þ
The first, second, and third terms in the right-hand side
of the pressure equation (Eq. 6) represent advection, capil-
larity, and buoyancy flow terms, respectively.
Conventional multiphase flow equations were decoupled
in terms of average pressure and petroleum saturation.
These equations were solved using the implicit-pressure
explicit-saturation (so called ‘IMPES’) technique (Helmig
1997; Huber & Helmig 2000; Class et al. 2002; Reichen-
berger et al. 2006), a technique that produces solutions
faster than those requiring time-consuming nonlinear itera-
tions.
Solution
s to the pressure and saturation equations
were computed using a hybrid numerical method called
FEFVM suggested by Geiger et al. (2004, 2006). This
method applies a finite element method (FEM) for com-
puting average pressure and then a finite volume method
(FVM) for computing fluid saturation. A fully upwind for-
mulation and total velocity diminishing (TVD) method
(Harten 1997) were also used for solutions to avoid both
numerical dispersion and spurious oscillation at the satura-
tion front.
Capillary pressure and relative permeability models devel-
oped by van Genuchten (1980) were used for describing
two-phase fluid–solid interaction in the porous media.
The van Genuchten model has been widely used in a
multiphase flow modeling and well known for providing
stable numerical solutions when applying continuous capil-
lary pressure functions for a whole saturation interval.
Stress or temperature dependent parameters were not
included in the numerical formulation.
Petroleum density and viscosity were computed using
empirical equations suggested by Glasø (1980) and Eng-
land et al. (1987). Liquid petroleum density generally
decreases with increasing pressure because the solubility of
gaseous component increases. The dynamic viscosity of oil
Fig. 5. Coupled hydromechanic and hydrother-
mal processes for episodic fluid flow (as known
as fault-valve mechanism), adopted from Sibson
(1994). The parameter and variables: pf is fluid
pressure; s is shear stress along the fault; C is
the cohesive strength of the fault; ls is the sta-
tic coefficient of rock friction, and rn is the nor-
mal stress on the fault.
© 2013 John Wiley & Sons Ltd, Geofluids, 14, 234–250
238 B. JUNG et al.
varies between 5 9 10�4 and 5 9 10�2 Pa�s, and generally
decreases exponentially with increasing temperature (Eng-
land et al. 1987). Fluid properties of the formation water
were obtained from a set of state equations proposed by
Phillips et al. (1981, 1983) and Watson et al. (1980),
which consider the effects of temperature, pressure, and
salinity/NaCl concentration on water density.
MODEL CONFIGURATION
The models, in this research, are based on the cross section
in Fig. 2, which illustrates the present geology of the New-
port-Inglewood fault zone and associated oil fields (e.g.,
Inglewood oil field) along the transect X–X′ in Fig. 1B.
This profile, which consists of anticline folds with heavily
faulted rocks, was chosen because it represents the typical
geologic settings of oil reservoirs along the NIFZ. The
numerical grid was discretized into 7655 triangular ele-
ments using a Delaunay triangulation method for detailed
rendering of geological structures (de Berg et al. 2008;
Fig. 6). The Newport-Inglewood fault zone and surround-
ing areas were divided into smaller elements to increase the
resolution of the numerical solution.
Because this model is only two-dimensional, a character-
istic fault length or effective flow field length was intro-
duced for petroleum volume calculation. The total length
of Inglewood Oil Field is about 5 km, so we assume that
20% of the total fault length (Approximately 1 km) in pro-
file is available for petroleum migration. The width of fault
zone in the numerical grid is approximately 50 m. Model
parameters used in the simulations are listed in Table 1.
Permeability and porosity of each hydrogeologic unit were
obtained from several publications (Yerkes 1972; Olson
1978; Higgins & Chapman 1984; Hesson & Olilang
1990; Nishikawa et al. 2009) and chosen within the ranges
considered to be representative for these local formations.
Fault permeability was not available from any local field
measurements, so it was systematically varied or dynami-
cally changed as part of model parameter sensitivity analy-
sis. Anisotropic permeability ratio values of up to 100:1
(kx/kz), typical for a regional-scale flow, were chosen for
most formations except the Pleistocene sediments, which
are known to be the most permeable and yet not fully con-
solidated. A thermal dispersivity a approximately 100 m
was assumed for all formations, reflecting the longitudinal
solute dispersivity value for a regional groundwater flow
system (de Marsily 1986; Gelhar et al. 1992). Matrix ther-
mal conductivity values of 3.0 W m�1°C were assigned to
most sandstone-dominant units and values of 2.5–
2.8 W m�1°C were assigned to the units having high con-
tent of siltstone and interbedded shale (Blackwell & Steele
1989). A specific heat capacity value of 750 J kg�1°C, typi-
cal of sandstone and shale, was assigned for all hydrogeo-
logic units and faults (Sabins 1997). Formation of water
salinity in the LA basin usually ranges from 20 000 to
34 000 ppm TDS (Hesson & Olilang 1990; California
Department of Conservation 1992) for most oil fields. The
groundwater salinity was set to 25 000 ppm TDS for the
entire model profile.
Capillary pressure in porous sandstone is generally
<0.1 bar (approximately 0.01 MPa) but may increase to
tens of bars in source rocks with clay grain size (Ingebrit-
sen et al. 2006). Capillarity model parameters were chosen
within the range of typical rock types obtained from other
publications (Levorsen 1967; Wendebourg 1994; Bloom-
field et al. 2001). Typically, the capillary pressure of more
permeable formations exhibit lower values, but sharp
increases occur near the irreducible water saturation point
(Swr). The sum of water and petroleum relative permeabil-
ity is usually less than one when both phases are mobile.
Initially, hydrostatic conditions and conductive thermal
profile were assumed throughout the basin. The levels of
overpressure were chosen considering that the pore pres-
sure in the Southern California faults may approach
lithostatic pressure due to mechanical compaction (Gra-
tier et al. 2002, 2003). The values of overpressure ratio,
fault permeability, and the period of episodic flow pulses
are presented in Table 2. The over pressure ratio (k*) in
a sedimentary basin can be defined as follows (Wang
et al. 2006)
Fig. 6. Model numerical grid, boundary conditions and
hydrostratigraphy
of the Newport-Inglewood fault zone based on the cross section
along the
transect X–X’ (Fig. 1b). The upper margin is the prescribed
pressure head
of 200 m and the isothermal boundary condition of 4°C. The left
and right
margins of the grid were assigned to be hydrostatic for pressure
and ther-
mally insulated (no flow) for heat. The bottom margin were
assigned as no
flow and a constant temperature of 160°C. Overpressure is
applied to the
right end of the fault boundary (marked as a white arrow) as a
prescribed
pressure condition, and the petroleum saturation at this
boundary is con-
stant (Sn = 0.6).
© 2013 John Wiley & Sons Ltd, Geofluids, 14, 234–250
Effects of episodic fluid flow 239
k� ¼ P � PF
PL � PF
� 100 ð9Þ
where P is pore fluid pressure in the formation, PF is
hydrostatic pressure, and PL is lithostatic pressure. Porosity
of the fault also changes dynamically in the range of 0.1–
0.3, accompanying with the permeability variation.
In middle Miocene to early Pleistocene, the basin is still
under a shallow marine environment (Wright 1991), so
the prescribed pressure head of 200 m and the isothermal
boundary condition of 4°C were assigned to the top
boundary of the grid. The temperature value was chosen
within the ranges of estimated Miocene shallow seawater
temperature (0–6°C) (Zachos et al. 2001). Boundary con-
ditions along the bottom margin of the grid were
assigned as no fluid flow (impermeable) and a constant
temperature of 160°C, based on geothermal gradients
reported in this area of 35–40°C km�1 (Higgins & Chap-
man 1984; Jeffrey et al. 1991). The left and right mar-
gins of the grid were assigned to be hydrostatic for
pressure and thermally insulated for heat. Petroleum was
injected through the fault boundary at the right boundary
(white arrow in Fig. 6), and this condition is physically
possible only when we assume that most of petroleum
was generated in the deep basin center and migrated
through the fault zone.
CONTINUOUS FLOW MODEL
First, we considered a continuous hydrocarbon migration
scenario through the Newport-Inglewood fault zone,
assuming a slightly overpressured sedimentary basin envi-
ronment with constant fault zone permeability. The level
of overpressure at the fault boundary (marked as a white
arrow in Fig. 6) was held constant during the simulation,
and the fault zone was considered as a channel for releas-
ing overpressure of the basin center as well as a conduit for
petroleum migration. For Model 1, the vertical fault per-
meability kz was set to 10 md (10
�14 m2), which is within
the range of kx for the Pliocene unit and higher than that
of Upper Miocene unit. The permeability value was
inferred from the fact that a fault zone may be more per-
meable than its host rock, especially when the fault was
ruptured by shear stresses and brecciated to include sur-
rounding rocks (Aydin 2000). The change of fault perme-
ability during deformation depends on fault rock clay
content and burial history. Laboratory experimental data
show permeability increasing over 2–4 orders of magnitude
(Fisher & Knipe 2001).
Fluid pressure gradients in a compacting sedimentary
basin usually vary between hydrostatic (approximately
10.1 MPa km�1) and lithostatic pressure (approximately
23.3 MPa km�1), and the values used in the simulations
Table 1 Hydrogeologic model parameters.
Parameter Topanga Puente Repetto Pico San Pedro NIFZ
kx, Horizontal permeability (md) 3.2 0.13 18 50 50 1–1000*
kx/kz, Anisotropy 100 100 100 100 100 0.1
/, Porosity 0.16 0.17 0.23 0.33 0.30 0.20
ct, Bulk compressibility (Pa
�1) 1 9 10�10 3 9 10�9 1 9 10�10 1 9 10�10 1 9 10�10 3 9
10�9
e, Thermal dispersivity (m) 100 100 100 100 100 100
k, Bulk thermal conductivity (W m�1°C) 3.0 2.5 2.7 2.8 2.8 3.0
c, Specific heat of matrix (J kg�1 °C) 750 750 750 750 750 750
a, van Genuchten coefficient (m�1) 3.0 9 10�4 4.0 9 10�4 2.5
9 10�3 2.0 9 10�3 2.0 9 10�3 1.0 9 10�2
n, van Genuchten coefficient 5.0 4.0 6.0 4.5 4.3 8.0
Swr, Irreducible wetting phase saturation (%) 10 18 12 12 12 12
Snr, Irreducible nonwetting phase saturation (%) 6 10 7 7 7 3
*Fault zone permeabilities are varied depending on model
settings described in Table 2. Permeability and porosity values
were selected within the ranges
from a technical report written by the California Department of
Conservation (1991) and unpublished data from Plains
Exploration and Production Company.
1 md = 10�15 m2. Capillarity model parameters are obtained
from publications (see the text).
Table 2 Petroleum migration scenarios for the Newport-
Inglewood fault zone.
Model Scenario Overpressure ratio (%) Fault permeability
(md)* Period of fluid pulse (years) Petroleum saturation
1 Continuous 10 10 0.6
2 Continuous 10 5 0.6
3 Continuous 10 20 0.6
4 Continuous 10 50 0.6
5 Episodic 10–80 1–1000 3000 0.6
6 Episodic 10–80 1–1000 2000 0.6
7 Episodic 10–80 1–1000 1000 0.6
8 Episodic 10–80 1–1000 500 0.6
*1 md = 10�15 m2.
© 2013 John Wiley & Sons Ltd, Geofluids, 14, 234–250
240 B. JUNG et al.
were selected based on the current LA basin fluid pressure
gradient of 9.9–12.6 MPa km�1 (Berry 1973; McCulloh
1979). These values can be converted to �1.5 to 19.0% in
overpressure ratio. These relatively low-pressure gradients,
despite the high subsidence and sedimentation rates, seem
to originate from the high content of coarse-grained sedi-
ments that can dissipate pressure very effectively in the LA
basin (Hayba & Bethke 1995).
We assumed the whole domain was initially hydrostatic,
and then, the lower right end of the fault on the boundary
of the mesh (marked by the white arrow in Fig. 6) was set
to 10% overpressure. Petroleum saturation at the inlet of
the fault zone was maintained as a constant value of 0.6,
which is taken from the average value of Miocene strata in
the Inglewood oil field (California Department of Conser-
vation 1992).
Figure 7 illustrates the pore pressure change in terms of
hydraulic head (h) of the continuous flow model, assuming
a constant fault permeability of 10 md (10�14 m2) and
overpressure ratio of 10% during the whole simulation time
(Model 1). The overpressured areas are sustained in the
lower part of the fault zone and the Miocene formations,
but the Pliocene and Pleistocene formations remain largely
hydrostatic (colored in white). The high pore fluid pressure
change is shown in the lower part of the fault. High fluid
pressure in the fault zone is confined in the Upper Mio-
cene formation due to its low permeability. The pressure
pattern reaches the equilibrium state approximately after
40 000 …
747
Bulletin of the Seismological Society of America, Vol. 94, No.
2, pp. 747–752, April 2004
Activity of the Offshore Newport–Inglewood Rose Canyon Fault
Zone,
Coastal Southern California, from Relocated Microseismicity
by Lisa B. Grant and Peter M. Shearer
Abstract An offshore zone of faulting approximately 10 km
from the southern
California coast connects the seismically active strike-slip
Newport–Inglewood fault
zone in the Los Angeles metropolitan region with the active
Rose Canyon fault zone
in the San Diego area. Relatively little seismicity has been
recorded along the off-
shore Newport–Inglewood Rose Canyon fault zone, although it
has long been sus-
pected of being seismogenic. Active low-angle thrust faults and
Quaternary folds
have been imaged by seismic reflection profiling along the
offshore fault zone, raising
the question of whether a through-going, active strike-slip fault
zone exists. We
applied a waveform cross-correlation algorithm to identify
clusters of microseis-
micity consisting of similar events. Analysis of two clusters
along the offshore fault
zone shows that they are associated with nearly vertical, north-
northwest-striking
faults, consistent with an offshore extension of the Newport–
Inglewood and Rose
Canyon strike-slip fault zones. P-wave polarities from a 1981
event cluster are con-
sistent with a right-lateral strike-slip focal mechanism solution.
Introduction
The Newport–Inglewood fault zone (NIFZ) was first
identified as a significant threat to southern California resi-
dents in 1933 when it generated the M 6.3 Long Beach earth-
quake, killing 115 people and providing motivation for pas-
sage of the first seismic safety legislation in the United States
(Barrows, 1974; Hauksson and Gross, 1991; Yeats, 2001).
The Rose Canyon fault (RCF) zone in the San Diego area
has ruptured several times during the Holocene (Lindvall
and Rockwell, 1995) and poses significant seismic hazard to
San Diego area residents (Anderson et al., 1989). An off-
shore zone of faulting approximately 10 km from the south-
ern California coast connects the strike-slip NIFZ in the Los
Angeles metropolitan region with the strike-slip RCF zone
in the San Diego area. The activity and seismic potential of
the intervening offshore fault zone, herein referred to as the
offshore Newport–Inglewood Rose Canyon (ONI-RC) fault
zone, has been the subject of debate for decades (e.g., Hill,
1971; Barrows, 1974; Fischer and Mills, 1991; Rivero et al.,
2000; Grant and Rockwell, 2002). Recent attention has fo-
cused on blind thrusts that may intersect the ONI-RC fault
zone and accommodate some of the regional deformation
(Grant et al., 1999; Rivero et al., 2000). Interaction with the
thrust system could limit the magnitude of earthquakes on
strike-slip faults in the ONI-RC fault zone, if they are active.
Sparse offshore microseismicity has been difficult to locate
accurately (Astiz and Shearer, 2000) but has been interpreted
to be associated with an active ONI-RC fault zone (Fischer
and Mills, 1991). We identified, relocated, and analyzed two
clusters of microearthquakes within the northern and central
ONI-RC fault zone to examine the fault structure, minimum
depth of seismic activity, and source fault mechanism. The
results suggest that the ONI-RC fault zone is a steeply dip-
ping, active strike-slip fault to seismogenic depths.
Tectonic and Geologic Setting
In southern California, tectonic deformation between
the Pacific and North American plates is accommodated pri-
marily by a zone of strike-slip faults (Walls et al., 1998)
with maximum deformation along the San Andreas system,
decreasing westward into the offshore inner Continental
Borderland region (Fig. 1). The inner Continental Border-
land has complex structure including low-angle detachment
faults, thrust faults, and high-angle strike-slip faults resulting
from late Cenozoic rifting prior to the current transpressional
tectonic regime (Crouch and Suppe, 1993; Bohannon and
Geist, 1998). The geometry and slip rate of faults in the inner
Continental Borderland are poorly constrained relative to
onshore faults (Astiz and Shearer, 2000), yet they may pose
significant seismic risk because they are close to populated
areas, and several offshore faults appear to displace seafloor
sediments (Legg, 1991). Grant and Rockwell (2002) pro-
posed that an active �300-km-long Coastal Fault zone
(Fig. 2) extends between the Los Angeles basin (USA) and
coastal Baja California (Mexico), including the NIFZ and
RCF zone in southern California, the Agua Blanca fault in
748 Short Notes
Figure 1. Regional fault map (modified from Grant and
Rockwell [2002]; after
Walls et al. [1998]) summarizing regional tectonic deformation
according to slip rate
on major faults, including the San Andreas fault (SAF), San
Jacinto fault zone (SJFZ),
Elsinore fault zone (EFZ), Whittier fault (WF), Palos Verdes
fault (PVF), NIFZ near Los
Angeles (LA), RCF zone (RCFZ) near San Diego (SD), Agua
Blanca fault zone (ABFZ),
San Miguel fault zone (SMFZ), Imperial fault (IF), Cerro Prieto
fault (CPF), and Laguna
Salada fault (LSF). Offshore faults of the inner Continental
Borderland include the
Coronado Bank fault zone (CBF), San Diego Trough fault
(SDTF), San Clemente fault
zone (SCFZ), Santa Cruz Island fault (SCIF), and Santa Rosa
Island fault (SRIF). The
San Gabriel fault (SGF), San Cayetano fault (SCF), Oak Ridge
fault (ORF), and Santa
Ynez fault (SYF) are located in the Transverse Ranges.
Baja California, and contiguous offshore fault zones. The
structural style and slip rates of the NIFZ and RCF zone sug-
gest that the intervening ONI-RC fault zone is an active,
strike-slip fault zone with complex structure and a slip rate
of 0.5–2.0 mm/yr.
The NIFZ has been studied extensively in the Los An-
geles basin by petroleum geologists. Hill (1971) proposed
that the NIFZ overlies a major tectonic boundary separating
eastern continental basement facies of granitic and associ-
ated metamorphic rocks from oceanic Catalina schist facies
of the inner Continental Borderland province to the west.
The current strike-slip faulting regime apparently reactivated
a structural weakness along the Mesozoic subduction zone
(Hill, 1971) and initiated right-lateral motion in the mid-to-
late Pliocene (Wright, 1991; Freeman et al., 1992). The NIFZ
is a structurally complex series of discontinuous strike-slip
faults with associated folds and shorter normal and reverse
faults (Yeats, 1973), described by Wilcox et al. (1973) and
Harding (1973) in a set of classic papers on wrench tecton-
ics. Dextral displacement of late Miocene and younger sed-
iments reveals a long-term slip rate of 0.5 mm/yr (Freeman
et al., 1992). Multiple surface ruptures since the early Ho-
locene indicate that the minimum slip rate is at least 0.3–0.6
mm/yr and may be substantially higher (Grant et al., 1997).
A Holocene slip rate of �1 mm/yr has been assumed for
seismic hazard assessment (SCECWG, 1995). Seismically
active strands of the NIFZ have been mapped along the west-
ern margin of the Los Angeles basin between the cities of
Beverly Hills and Newport Beach (Bryant, 1988; Grant et
al., 1997) where the fault steps over and continues offshore
parallel to the coast (Morton and Miller, 1981).
The subsurface structure and tectonic history of the RCF
zone have not been studied as thoroughly as the NIFZ be-
cause it lacks petroleum reserves. The Holocene sense of
movement and slip rate of the RCF have been investigated
for seismic hazard studies. Lindvall and Rockwell (1995)
Short Notes 749
Figure 2. Map shows approximate location of major strands in
the Coastal fault
zone and dates of most recent rupture. The Coastal fault zone
includes the northern
NIFZ near Beverly Hills (BH) (dashed), southern NIFZ (bold)
near Newport Beach (NB),
the ONI-RC fault zone (gray) offshore of the San Joaquin Hills
(SJH) and city of Ocean-
side (O), the RCF zone (bold line) between La Jolla (LJ) and
San Diego, the Coronado
Bank fault zone (CBF), and the Agua Blanca fault zone (ABFZ,
bold). Modified from
Grant and Rockwell (2002); after Grant et al. (1997), Lindvall
and Rockwell (1995),
and Rockwell and Murbach (1999).
and Rockwell and Murbach (1999) reported that it is pri-
marily a strike-slip fault zone with a slip rate of 1–2 mm/yr,
although individual strands display varying amounts of dip-
slip motion in combination with strike slip.
Location and Structural Models of the ONI-RC
Fault Zone
The location of the ONI-RC fault zone has been mapped
by seismic reflection profiling in shallow water along the
inner continental margin between Newport Beach and La
Jolla, north of San Diego. Fischer and Mills (1991) sum-
marized the results of eight investigations between 1972 and
1988, including unpublished mapping for the nuclear gen-
erating station at San Onofre. Interpretations of Fischer and
Mills (1991) and prior studies disagree about the location
and number of traces, but all reveal a fairly continuous zone
of faulting within a few kilometers of the coastline. Fischer
and Mills (1991) presented several interpretive cross sec-
tions with a steeply dipping fault and flower structure sug-
gestive of strike-slip motion. They described an inner and
outer “thrust fault-fold complex” consisting of multiple
thrust faults and thrust-generated folds associated with a
positive flower structure, and they described an offshore ex-
tension of the San Joaquin Hills as being dextrally offset by
the ONI-RC fault zone. Grant and others (1999, 2000, 2002)
reported late Quaternary and Holocene uplift of the San Joa-
quin Hills inboard of the ONI-RC fault zone and suggested
that seismic activity of the San Joaquin Hills blind thrust and
ONI-RC fault zone are linked.
Recent offshore investigations have focused on the
structure and potential activity of a low-angle fault, the
Oceanside thrust, and its relationship to the ONI-RC fault
zone (Bohannon and Geist, 1998; Rivero et al., 2000). Riv-
ero et al. (2000) proposed that the San Joaquin Hills blind
thrust is a backthrust soling into the larger Oceanside thrust.
In this model, Quaternary uplift of the San Joaquin Hills and
coastline south to San Diego is associated with movement
of the Oceanside thrust. They presented four potential con-
figurations for thrust interaction with strike-slip faults in the
ONI-RC fault zone, each leading to a different maximum
magnitude estimate, based on the activity and depth of the
strike-slip system. Our analysis of microseismicity helps
constrain the most viable model for interaction between the
Oceanside thrust and ONI-RC fault zone.
Seismicity and Event Location Method
No significant historic earthquakes have occurred on the
ONI-RC fault zone. Scattered seismicity has been recorded
along the ONI-RC fault zone (Fig. 3), although events are
difficult to locate accurately due to poor station coverage
(Fischer and Mills, 1991; Astiz and Shearer, 2000). With the
exception of the energetic 1986 ML 5.3 Oceanside earth-
quake sequence, rates of microseismicity have been low
since digital waveform data became available in 1981 (Astiz
and Shearer, 2000). Fischer and Mills (1991) reported that
the rate of seismicity along the ONI-RC fault zone is ap-
proximately 10 times lower than along the onshore NIFZ.
Rivero et al. (2000) interpreted the 1986 Oceanside earth-
quake sequence as generated by the Thirtymile Bank thrust
fault, a reactivated low-angle detachment fault.
Figure 3 shows microseismicity of the inner Continental
Borderland between 1981 and February 2003. The earth-
quake locations were computed from the archived P and S
picks using the source-specific station term method of
Richards-Dinger and Shearer (2000). This method improves
the relative location of events within compact clusters by
solving for custom station terms for subsets of the events,
thus removing the biasing effects of unmodeled three-
750 Short Notes
-118.0 -117.5
33.2
33.4
33.6
33.8
Oceanside
Newport Beach
A
B
Elsinore
San Clemente
Newport-Inglewood
P
alos Verdes
0 10 km
Figure 3. Earthquakes (black dots) near the
coastal cities (circles) of Newport Beach, San Cle-
mente, and Oceanside, California, recorded from
1981 to February 2003. Black boxes indicate clusters
of similar events near the ONI-RC fault zone. A 1981
cluster near Oceanside (box A) is shown in Figure 4,
and a 2000 cluster near Newport Beach (box B) is
shown in Figure 5. The approximate locations of the
Elsinore, Newport–Inglewood, and Palos Verdes
faults are also shown.
-117.52 -117.51
33.26
33.27
A
A'
0.0 0.4 0.8
12.0
12.5
13.0
13.5
Distance (km)
D
e
p
th
(
km
)
A A'
0.5 km0
Figure 4. The 1981 Oceanside cluster (from box
A on Fig. 3) is plotted at higher resolution in
map view and cross section, after relocation using
differential times computed using waveform cross-
correlation.
dimensional velocity and the varying station coverage
among the events. In general, this results in sharper and
better-defined seismicity alignments. The method does not,
however, necessarily yield improvements in the absolute lo-
cations of the clusters. We obtained waveforms for these
events and performed waveform cross-correlation between
each event and 100 neighboring events (Shearer, 1997; Astiz
et al., 2000). We then identified clusters of similar events
and relocated the microearthquakes within similar event
clusters using the method of Shearer (1998, 2002). On Fig-
ure 3, each cluster is so compact that these appear mostly as
single dots. Two of these clusters, in boxes labeled A and B
in Figure 3, are associated with the ONI-RC fault zone and
are the focus of this article.
Results
The Oceanside Cluster
The most interesting cluster is from a 1981 swarm of
19 M �3.0 earthquakes approximately 10 km northwest of
Oceanside. This cluster should not be confused with the
more energetic 1986 ML 5.3 Oceanside earthquake sequence
located much further offshore. As shown in Figure 4, the
events align along a north-northwest trend about 0.5 km
long. In cross section, the events define a nearly vertical
plane between 12.5 and 13.0 km depth. The strike, dip, and
location of a plane fit by these events are consistent with
active strike-slip faulting on the ONI-RC fault zone.
Fischer and Mills (1991) reported that the 1981 cluster
represents “a direct correlation of seismicity” (p. 30) with
the ONI-RC fault zone because they located the earthquakes
within 0.5 km of where they mapped the Oceanside segment
of the fault zone. Our relocation results support this inter-
pretation by showing that the events within the cluster form
a linear trend that is approximately parallel to the fault zone.
Fischer and Mills (1991) also calculated a strike-slip single
event first motion focal mechanism solution for an earth-
quake in the 1981 cluster. We are doubtful that unique focal
mechanisms can be computed for the 1981 events, given the
sparse distribution of seismic stations. However, we did ex-
amine composite waveform polarities from the 1981 cluster
using the method of Shearer et al. (2003) and found that the
polarities are consistent with a right-lateral strike-slip focal
mechanism solution, aligned with the trend of the ONI-RC
Short Notes 751
-117.870 -117.860
33.545
33.550
33.555
B
B'
0.0 0.5 1.0 1.5
6
7
Distance (km)
D
e
p
th
(
km
)
B B'
0.5 km0
Figure 5. The 2000 Newport Beach cluster (from
box B on Fig. 3) is plotted at higher resolution in
map view and cross section, after relocation using
differential times computed using waveform cross-
correlation.
fault zone. We cannot, however, entirely eliminate other
possible focal mechanisms.
The Newport Beach Cluster
A cluster of seven similar microearthquakes occurred
offshore of Newport Beach in 2000 at a depth of approxi-
mately 6.5–7.0 km. The cluster is near the offshore NIFZ as
mapped by Morton and Miller (1981) and compiled by
Fischer and Mills (1991). In map view and cross section
(Fig. 5), five of the seven events are aligned in a pattern
consistent with a shallow (7 km), north-northwest-striking,
vertical or steeply dipping active fault. Observed polarities
for this cluster are too sparse to provide any meaningful
constraint on the focal mechanisms.
The location of the 2000 cluster is southwest of an area
of active faulting reported by Fischer and Mills (1991) from
mapping offshore of Newport Beach and the San Joaquin
Hills. Fischer and Mills (1991) analyzed microseismicity
from 1982 to 1990 along this zone and reported strike-slip
and reverse-fault first motion solutions from a cluster of epi-
centers between 2 and 2.5 km on either side of the mapped
fault zone.
Discussion
The mean locations of each cluster are determined using
a standard 1D velocity model for all of southern California
and are probably not very accurate, particularly in depth. We
estimate uncertainties on the absolute cluster locations as
roughly �2 km in horizontal position and �5 km in depth.
However, the relative location accuracy among events
within each cluster is much better constrained, so the trends
defined by the seismicity alignments should be reliable. The
estimated relative location accuracy is generally less than
50 m for the events in the Oceanside cluster and less than
150 m for the aligned events in the Newport Beach cluster.
The two outlying events in the Newport Beach cluster have
standard errors of about 500 m; thus it is entirely possible
that their true locations lie within the linear trend of the other
events.
The location, alignment, and apparent dip of the Ocean-
side and Newport Beach clusters of microearthquakes are
consistent with the presence of active, steeply dipping faults
in the ONI-RC fault zone. Waveform polarities are also con-
sistent with strike-slip motion, although other mechanisms
cannot be ruled out.
For hazard estimation of offshore faults, it is not as im-
portant to precisely locate active traces as it is for onshore
faults in populated areas. A more important consideration is
the potential for a through-going rupture and an estimate of
the maximum magnitude earthquake. Our relocated micro-
seismicity is too sparse to reveal whether or not there is a
through-going strike-slip fault zone. The structure of the
ONI-RC fault zone may be similar to that of the onshore
NIFZ, which contains multiple strike-slip traces. Others have
mapped a fairly continuous structurally complex zone of
faulting �110 km long, subparallel to and within 10 km of
the coast (Fischer and Mills, 1991). The maximum magni-
tude of an ONI-RC fault rupture can be estimated from the
length of the fault zone. Assuming a 110-km surface rupture
length of a strike-slip fault zone yields an estimated M 7.4
earthquake (Wells and Coppersmith, 1994).
If strike-slip faults do not terminate the Oceanside
thrust, Rivero et al. (2000) estimate an Mw 7.5 maximum
magnitude earthquake could result from rupture of the entire
thrust fault. The �6.5-km depth of the Newport Beach seis-
micity cluster does not provide information on the geometry
or interaction between the strike-slip ONI-RC fault zone and
the Oceanside thrust. However, the location and �13 km
depth of the Oceanside cluster suggests that the Oceanside
thrust is terminated by active strike-slip faults. According to
Rivero et al. (2000), this geometry would lead to an Mw 7.3
maximum magnitude earthquake on the Oceanside thrust.
The maximum magnitude estimate is at the upper range of
magnitude estimated for an earthquake that uplifted the San
Joaquin Hills circa A.D. 1635–1769 (Grant et al., 2002).
752 Short Notes
Acknowledgments
This research was supported by the Southern California
Earthquake
Center. SCEC is funded by NSF Cooperative Agreement EAR-
0106924
and USGS Cooperative Agreement 02HQAG0008. The SCEC
Contribution
Number for this article is 746.
References
Anderson, J. G., T. K. Rockwell, and D. C. Agnew (1989). Past
and possible
future earthquakes of significance to the San Diego region,
Earth-
quake Spectra 5, 299–335.
Astiz, L., and P. M. Shearer (2000). Earthquake locations in the
inner Con-
tinental Borderland, offshore southern California, Bull. Seism.
Soc.
Am. 90, 425–449.
Astiz, L., P. M. Shearer, and D. C. Agnew (2000). Precise
relocations and
stress-change calculations for the Upland earthquake sequence
in
southern California, J. Geophys. Res. 105, 2937–2953.
Barrows, A. G. (1974). A review of the geology and earthquake
history of
the Newport–Inglewood structural zone, Calif. Div. Mines Geol.
Spe-
cial Report 114, 115 pp.
Bohannon, R. G., and E. Geist (1998). Upper crustal structure
and Neogene
tectonic development of the California continental borderland,
Geol.
Soc. Am. Bull. 110, no. 6, 779–800.
Bryant, W. A. (1988). Recently active traces of the Newport–
Inglewood
fault zone, Los Angeles and Orange Counties, California,
California
Division of Mines and Geology, DMG OFR 88-14.
Crouch, J. K., and J. Suppe (1993). Late Cenozoic tectonic
evolution of the
Los Angeles basin and inner California borderland: a model for
core
complex-like crustal extension, Geol. Soc. Am. Bull. 105,
1415–1434.
Fischer, P. J., and Mills, G. I. (1991). The offshore Newport–
Inglewood–
Rose Canyon fault zone, California: structure, segmentation and
tec-
tonics, in Environmental Perils San Diego Region, P. L. Abbott
and
W. J. Elliot (Editors), San Diego Association of Geologists, San
Di-
ego, Geological Society of America Annual Meeting, 17–36.
Freeman, S. T., E. G. Heath, P. D. Guptil, and J. T. Waggoner
(1992).
Seismic hazard assessment, Newport–Inglewood fault zone, in
En-
gineering Geology Practice in Southern California, B. W. Pipkin
and
R. J. Proctor (Editors), Star, Belmont, California, 211–231.
Grant, L. B., and T. K. Rockwell (2002). A northward-
propagating earth-
quake sequence in coastal southern California? Seism. Res.
Lett. 73,
no. 4, 461–469.
Grant, L. B., J. T. Waggoner, C. von Stein, and T. K. Rockwell
(1997).
Paleoseismicity of the north branch of the Newport–Inglewood
fault
zone in Huntington Beach, California, from cone penetrometer
test
data, Bull. Seism. Soc. Am. 87, 277–293.
Grant, L. B., K. J. Mueller, E. M. Gath, H. Cheng, R. L.
Edwards, R. Munro,
and G. L. Kennedy (1999). Late Quaternary uplift and
earthquake
potential of the San Joaquin Hills, southern Los Angeles basin,
Cali-
fornia, Geology 27, 1031–1034.
Grant, L. B., K. J. Mueller, E. M. Gath, and R. Munro (2000).
Late Qua-
ternary uplift and earthquake potential of the San Joaquin Hills,
south-
ern Los Angeles basin, California—Reply, Geology 28, 384.
Grant, L. B., L. J. Ballenger, and E. E. Runnerstrom (2002).
Coastal uplift
of the San Joaquin Hills, southern Los Angeles Basin,
California, by
a large earthquake since 1635 A.D., Bull. Seism. Soc. Am. 92,
no. 2,
590–599.
Harding, T. P. (1973). Newport–Inglewood Trend, California:
an example
of wrenching style of deformation, Am. Assoc. Petrol. Geol.
Bull. 57,
no. 1, 97–116.
Hauksson, E., and S. Gross (1991). Source parameters of the
1933 Long
Beach earthquake, Bull. Seism. Soc. Am. 81, 81–98.
Hill, M. L. (1971). Newport–Inglewood zone and Mesozoic
subduction,
California, Geol. Soc. Am. Bull. 82, 2957–2962.
Legg, M. R. (1991). Sea Beam evidence of recent tectonic
activity in the
California Continental Borderland, in The Gulf and Peninsular
Prov-
ince of the Californias, P. Dauphin and G. Ness (Editors),
American
Association of Petroleum Geologists Memoir 47, 179–196.
Lindvall, S. C., and T. K. Rockwell (1995). Holocene activity of
the Rose
Canyon fault zone in San Diego, California, J. Geophys. Res.
100,
no. B12, 24,121–24,132.
Morton, P. K., and R. V. Miller (1981). Geologic map of Orange
County
California, showing mines and mineral deposits, Calif. Div.
Mines
Geol. Bull. 204, plate 1, 1:48,000 scale.
Richards-Dinger, K. B., and P. M. Shearer (2000). Earthquake
locations in
southern California obtained using source-specific station
terms,
J. Geophys Res. 105, 10,939–10,960.
Rivero, C., J. H. Shaw, and K. Mueller (2000). Oceanside and
Thirty-Mile
Bank blind thrusts: implications for earthquake hazards in
coastal
southern California, Geology 28, 891–894.
Rockwell, T., and M. Murbach (1999). Holocene earthquake
history of the
Rose Canyon fault zone: final technical report submitted for
USGS
Grant No. 1434-95-G-2613, 37 pp.
Shearer, P. M. (1997). Improving local earthquake locations
using the L1-
norm and waveform cross-correlation: application to the
Whittier Nar-
rows, California, aftershock sequence, J. Geophys. Res. 102,
8269–
8283.
Shearer, P. M. (1998). Evidence from a cluster of small
earthquakes for a
fault at 18 km depth beneath Oak Ridge, southern California,
Bull.
Seism. Soc. Am. 88, 1327–1336.
Shearer, P. M. (2002). Parallel faults strands at 9-km depth
resolved on the
Imperial Fault, southern California, Geophys. Res. Lett. 29, no.
14,
1674.
Shearer, P. M., J. L. Hardebeck, L. Astiz, and K. B. Richards-
Dinger
(2003). Analysis of similar event clusters in aftershocks of the
1994
Northridge, California, earthquake, J. Geophys Res. 108, no.
B1,
2035, doi 10.1029/2001JB000685.
Southern California Earthquake Center Working Group on the
Probabilities
of Future Large Earthquakes in Southern California (SCECWG)
(1995). Seismic hazards in southern California: probable
earthquakes,
1994–2024, Bull. Seism. Soc. Am. 85, 379–439.
Walls, C., T. Rockwell, K. Mueller, Y. Bock, S. Williams, J.
Pfanner, J.
Dolan, and P. Feng (1998). Escape tectonics in the Los Angeles
met-
ropolitan region and implications for seismic risk, Nature 394,
356–
360.
Wells, D. L., and K. J. Coppersmith (1994). New empirical
relationships
among magnitude, rupture length, rupture area, and surface
displace-
ment, Bull. Seism. Soc. Am. 84, 974–1002.
Wilcox, R. E., T. P. Harding, and D. R. Seely (1973). Basic
wrench tec-
tonics, Am. Assoc. Petrol. Geol. Bull. 57, no. 1, 74–96.
Wright, T. L. (1991). Structural geology and tectonic evolution
of the Los
Angeles basin, In Active Margin Basins, K. T. Biddle (Editor),
Amer-
ican Association of Petroleum Geologists Memoir 52, 35–134.
Yeats, R. S. (1973). Newport–Inglewood fault zone, Los
Angeles basin,
California, Am. Assoc. Petrol. Geol. Bull. 57, no. 1, 117–135.
Yeats, R. S. (2001). Living with Earthquakes in California,
Oregon State
University Press, Corvallis, 406 pp.
Department of Environmental Health, Science, and Policy
University of California
Irvine, California 92697-7070
[email protected]
(L.B.G.)
Institute of Geophysics and Planetary Physics
Scripps Institution of Oceanography
University of California, San Diego
La Jolla, California 92093-0225
[email protected]
(P.M.S.)
Manuscript received 23 July 2003.
Student Name: Bud Benneman
Geology 105 Spring 2020
Paper Outline
The Newport–Inglewood fault zone (NIFZ) of southern
California.
I. The Newport–Inglewood fault zone (NIFZ) was first
identified as a significant threat to southern California residents
in 1933 when it generated the Magnitude 6.3 Long Beach
Earthquake, killing 115 people.
A. The Newport Inglewood fault is located in southern Los
Angeles County in the city of Inglewood and transverses south
to Newport Beach in Orange County where it becomes an off
shore fault.
B. The NIFZ then connects to the Rose Canyon Fault none,
becomes a landward fault in San Diego County.
C. This is a stress reliever Strike-Slip Fault Zone associated
with the San Andréas Fault Zone.
D. Ground water basins in Los Angeles County may be used as
predictors of fault movement due to sudden changes in ground
water level.
E. In southern California, tectonic deformation between
the Pacific and North American plates is accommodated
primarily by a zone of strike-slip faults,
II. This fault is important to the exploration of Oil.
A. The NIFZ has been studied extensively in the Los Angeles
basin by petroleum geologists.
B. The NIFZ overlies a major tectonic boundary separating
eastern continental basement rocks of granitic and associated
metamorphic rocks of Santa Catalina Island schist.
C. The NIFZ follows along a former Mesozoic subduction zone.
D. This fault is associated with several oil basins including
Newport Beach, Huntington Beach, Seal Beach, Long Beach,
and Signal Hill.
III. Earthquake Potential for Los Angeles, Orange and San
Diego Counties.
A. The epicenter for the 1933 Long Beach Quake was located
in Newport Beach just south of the Santa Ana River discharge
into the Pacific Ocean.
B. Orange County in 1933 consisted of small farm-towns, cattle
ranching and agricultural fields.
C. The closest city of significant development was Lang Beach,
which was devastated by the 1933 6,3 quake.
D. Today cities of Newport Beach, Huntington Beach, Costa
Mesa, are large population centers, which have replaced
agriculture as the primary economic sector.
E. The rate of ground water basin contraction is important in
determining possible earthquake releases in the Los Angeles
Basin.
F. Many Orange and Los Angeles county buildings are located
along high risk development zones during earthquakes.
IV. Earthquake Monitoring and Prediction
a. The location of the 2000 cluster is southwest of an area of
active faulting from 1982 to 1990 along this zone and reported
strike-slip offshore fault between Newport Beach and the San
Joaquin Hills was traced from seismic activity.
b. Analyzed microseismicity from a cluster of epicenters
between 2 and 2.5 km along the fault zone suggest potential
earthquakes of higher magnitude are possible.
c. A possible 7.5 magnitude earthquake could result from
rupture of the entire fault. The 6.5-km depth of the Newport
Beach seismicity cluster does not provide information on the
geometry or interaction between the strike-fault zone and
Oceanside thrust faults.
d. Los Angeles groundwater basin contraction could cause faults
such as the Whittier
E. Oil companies and water basin studies using seismic
studies and human
induced micro-seismic studies have identified several fault
structures such as
blind thrust faults in the Los Angeles basin. Blind thrust
along with strike slip
fault structures suggest potential earthquakes of higher
magnitude are
possible for the Los Angeles and Orange County basins.
IV. Conclusion
a. The Newport Inglewood Fault is a major stress reliever for
the San Andreas Fault Zone.
b. This fault zone is tied in between the North American Plate
and Pacific Plates Strike Slip Zones and follows a Mesozoic
Subduction zone.
c. The location of the NIFZ has potential for a large magnitude
earthquake due to it being sandwiched between the eastern San
Andreas and Pacific Margin plate Boundary.
Paper Outline Due Thursday April 23
Posted on GWC Blackboard 3-5-20
Announced in class and illustrated on Thursday March 5, 2020
Required:
1. Two (2) reviewed articles with a person or persons as the
author. The U.S.G.S or the
EPA is not a person. The last pages of your article must
have a reference page. No
reference page or named person or multiple authors are
not acceptable.
2. Two but not more than five pages of text double or 1.5
spaced with normal margins like those in the sample outline.
3. Sources that are good various reviewed journals Science,
Nature, Scientific
American. These publications will have sources at the end
with references
within the text of the paper.
4. Sources to stay away from Science Direct, Geology.com,
National Geographic,
Newspapers, Magazines. If the article you chose has
advertisements then stay away
from these sources, or any with advertising ads.
What to hand in.
1. Your outline as a hard copy.
2. Complete printed out copies of your sources all clipped
together.
3. Must be clipped together with the outline. No folded corners
on the papers
as an attempt to keep them together. Use a clip.
Failure to provide a copy of your sources along with the outline
will result in a failing grade for this outline. No late
assignments will be accepted. No electronic files accepted.
Colton
City of
COMPREHENSIVE ANNUAL
FINANCIAL REPORT
Fiscal Year Ended June 30, 2019
City of Colton, California
650 N. La Cadena Drive, Colton, California 92324
THIS PAGE INTENTIONALLY LEFT BLANK
CITY OF COLTON, CALIFORNIA
COMPREHENSIVE ANNUAL FINANCIAL REPORT
WITH REPORT ON AUDIT
BY INDEPENDENT
CERTIFIED PUBLIC ACCOUNTANTS
FOR THE YEAR ENDED JUNE 30, 2019
Prepared By:
Finance Department
Finance Administration Division
THIS PAGE INTENTIONALLY LEFT BLANK
CITY OF COLTON, CALIFORNIA
Comprehensive Annual Financial Report
For the Fiscal Year Ended June 30, 2019
Table of Contents
Page
Number
INTRODUCTORY SECTION:
Letter of Transmittal i
Municipal Officials v
Organization Chart vi
Government Finance Officers Association Certificate vii
FINANCIAL SECTION:
Independent Auditors’ Report 1
Managements’ Discussion and Analysis
(Required Supplementary Information) 5
Basic Financial Statements:
Government-Wide Financial Statements:
Statement of Net Position 17
Statement of Activities 18
Fund Financial Statements:
Governmental Funds:
Balance Sheet 20
Reconciliation of the Governmental Funds Balance Sheet
to the Statement of Net Position 21
Statement of Revenues, Expenditures and Changes in Fund
Balances 22
Reconciliation of the Governmental Funds Statement of
Revenues,
Expenditures and Changes in Fund Balances to the Statement
of Activities 23
Budgetary Comparison Statement by Department - General
Fund 25
Proprietary Funds:
Statement of Net Position 26
Statement of Revenues, Expenses and Changes in Net Position
30
Statement of Cash Flows 32
Fiduciary Funds:
Statement of Net Position 36
Statement of Changes in Net Position 37
Notes to Financial Statements 39
CITY OF COLTON, CALIFORNIA
Comprehensive Annual Financial Report
For the Fiscal Year Ended June 30, 2019
Table of Contents
Page
Number
Required Supplementary Information: 87
CalPERS Pension Plans:
Safety Plans:
Schedule of Proportionate Share of the Net Pension Liability
88
Schedule of Contributions 89
Miscellaneous Plan:
Schedule of Changes in the Net Pension Liability and Related
Ratios 90
Schedule of Contributions 91
Other Post-Employment Benefits Plan:
Schedule of Changes in the Total OPEB Liability and Related
Ratios 92
Supplementary Information:
Combining and Individual Fund Statements and Schedules:
Other Governmental Funds: 93
Combining Balance Sheet 96
Combining Statement of Revenues, Expenditures and
Changes in Fund Balances 102
Schedules of Revenues, Expenditures and Changes in
Fund Balance - Budget and Actual:
Gas Tax Special Revenue Fund 108
Community Child Care Special Revenue Fund 109
Library Grant Special Revenue Fund 110
Community Development Block Grant Special Revenue Fund
111
State Traffic Relief Special Revenue Fund 112
Asset Seizure Special Revenue Fund 113
Air Quality Special Revenue Fund 114
Drug/Gang Intervention Special Revenue Fund 115
Host City Fees Special Revenue Fund 116
Storm Water Special Revenue Fund 117
Local Transportation Special Revenue Fund 118
New Facilities Special Revenue Fund 119
Civic Center Development Fee Special Revenue Fund 120
Fire Facility Development Fee Special Revenue Fund 121
Police Facility Development Fee Special Revenue Fund 122
ViTep Special Revenue Fund 123
Miscellaneous Grants Special Revenue Fund 124
Housing Authority Special Revenue Fund 125
CITY OF COLTON, CALIFORNIA
Comprehensive Annual Financial Report
For the Fiscal Year Ended June 30, 2019
Table of Contents
Page
Number
Supplementary Information (Continued):
Other Governmental Funds (Continued):
Schedules of Revenues, Expenditures and Changes in
Fund Balance - Budget and Actual (Continued):
Public Financing Authority Debt Service Fund 126
Taxable Pension Funding Bonds Debt Service Fund 127
Capital Improvements Capital Projects Fund 128
Development Fees Capital Projects Fund 129
Colton Crossing Capital Projects Fund 130
Internal Service Funds: 131
Combining Statement of Net Position 132
Combining Statement of Revenues, Expenses and Changes in
Net Position 133
Combining Statement of Cash Flows 134
Agency Funds: 135
Combining Statement of Assets and Liabilities 136
Combining Statement of Changes in Assets and Liabilities 137
Private-Purpose Trust Funds: 139
Combining Statement of Net Position 140
Combining Statement of Changes in Net Position 141
STATISTICAL SECTION:
Description of Statistical Section Contents 143
Financial Trends:
Net Position by Component - Last Ten Fiscal Years 145
Changes in Net Position - Last Ten Fiscal Years 146
Fund Balances of Governmental Funds - Last Ten Fiscal Years
148
Changes in Fund Balances of Governmental Funds - Last Ten
Fiscal Years 150
CITY OF COLTON, CALIFORNIA
Comprehensive Annual Financial Report
For the Fiscal Year Ended June 30, 2019
Table of Contents
Page
Number
STATISTICAL SECTION (CONTINUED):
Revenue Capacity:
Assessed Value and Estimated Actual Value of Taxable
Property - Last Ten Fiscal Years 152
Property Tax Rates - All Overlapping Governments - Last Ten
Fiscal Years 153
Principal Property Tax Payers - Current and Nine Years Ago
154
Property Tax Levies and Collections - Last Ten Fiscal Years
155
Taxable Sales by Category - Last Ten Calendar Years 156
Direct and Overlapping Sales Tax Rates - Last Ten Fiscal
Years 157
Top 25 Principal Sales Tax Remitters - Identified by Category
158
Debt Capacity:
Ratios of Outstanding Debt by Type - Last Ten Fiscal Years
159
Direct and Overlapping Governmental Activities Debt - As of
June 30, 2017 160
Legal Debt Margin Information - Last Ten Fiscal Years 161
Pledged-Revenue Coverage - Last Ten Fiscal Years 162
Demographic and Economic Information:
Demographic and Economic Statistics - Last Ten Calendar
Years 163
Top 20 Principal Employers - Current Year and Nine Years
Ago 164
Operating Information:
Full-Time City Government Employees by Function/Program -
Last Ten Fiscal Years 165
Operating Indicators by Function/Program - Last Ten Fiscal
Years 166
Capital Asset Statistics by Function/Program - Last Ten Fiscal
Years 167
INTRODUCTORY SECTION
THIS PAGE INTENTIONALLY LEFT BLANK
i
ii
iii
Colton
City of
City Council
Dr. Luis S. González
Frank J. Navarro
Mayor
District 2
Kenneth Koperski
Council Member
District 3
District 4 District 5
Isaac T. Suchil
Council Member
District 6
David J. Toro
Council Member
District 1
Ernest R. Cisneros
Mayor Pro Tem
Council Member
Jack R. Woods
Council Member
iv
C
it
y
w
id
e
O
rg
a
n
iz
a
ti
o
n
a
l
C
h
a
rt
C
o
lt
o
n
C
it
iz
e
n
s
C
it
y
C
o
u
n
ci
l
C
it
y
C
le
rk
C
it
y
T
re
a
su
re
r
C
it
y
A
tt
o
rn
e
y
C
it
y
M
an
ag
e
r
C
o
m
m
is
si
o
n
s
/
Co
m
m
itt
ee
s
F
in
an
ce
D
e
v
e
lo
p
m
e
n
t
S
er
vi
ce
s
C
o
m
m
u
n
it
y
S
er
vi
ce
s
P
o
lic
e
G
e
n
e
ra
l
G
o
ve
rn
m
e
n
t
F
ir
e
O
p
e
ra
ti
o
n
s
P
re
v
e
n
ti
o
n
D
is
a
st
e
r
P
re
p
ar
e
d
n
e
ss
A
d
m
in
is
tr
at
io
n
P
a
tr
o
l
D
e
te
ct
iv
e
C
o
d
e
E
n
fo
rc
e
m
e
n
t
H
u
m
a
n
S
e
rv
ic
e
s
R
ec
re
at
io
n
Li
b
ra
ry
C
h
ild
ca
re
C
u
st
o
m
e
r
S
e
rv
ic
e
C
it
y
M
an
ag
e
r
St
a
ff
C
it
y
C
le
rk
S
ta
ff
P
u
b
li
c
W
o
rk
s
&
U
ti
li
ty
S
e
rv
ic
e
s
E
le
ct
ri
c
W
at
e
r
W
as
te
w
at
e
r
P
u
b
lic
W
o
rk
s/
E
n
g
in
e
e
ri
n
g
P
la
n
n
in
g
B
u
ild
in
g
B
u
si
n
e
ss
L
ic
en
se
F
in
an
ce
A
d
m
in
is
tr
at
io
n
In
fo
rm
a
ti
o
n
S
er
vi
ce
s
A
n
im
al
S
e
rv
ic
e
s
C
e
m
e
te
ry
H
u
m
a
n
R
e
so
u
rc
e
s
R
is
k
M
a
n
a
g
e
m
e
n
t/
P
u
b
lic
L
ia
b
ili
ty
P
u
rc
h
a
si
n
g/
W
ar
e
h
o
u
se
E
co
n
o
m
ic
D
e
v
e
lo
p
m
e
n
t
A
u
to
S
h
o
p
/B
u
il
d
in
g
M
a
in
te
n
a
n
c
e
v
vi
FINANCIAL SECTION
THIS PAGE INTENTIONALLY LEFT BLANK
2875 Michelle Drive, Suite 300 | Irvine, California 92606 |
WNDECPA.com | 714.978.1300
1
INDEPENDENT AUDITORS’ REPORT
Honorable Mayor and
Members of the City Council
of the City of Colton
Colton, California
Report on the Financial Statements
We have audited the accompanying financial statements of the
governmental activities, the business-type
activities, each major fund and the aggregate remaining fund
information of the City of Colton, California (the
City), as of and for the year ended June 30, 2019, and the
related notes to the financial statements, which
collectively comprise the City’s basic financial statements as
listed in the table of contents.
Management’s Responsibility for the Financial Statements
Management is responsible for the preparation and fair
presentation of these financial statements in accordance
with accounting principles generally accepted in the United
States of America; this includes the design,
implementation and maintenance of internal control relevant to
the preparation and fair presentation of financial
statements that are free from material misstatement, whether
due to fraud or error.
Auditors’ Responsibility
Our responsibility is to express opinions on these basic
financial statements based on our audit. We conducted our
audit in accordance with auditing standards generally accepted
in the United States of America and the standards
applicable to financial audits contained in Government Auditing
Standards, issued by the Comptroller General of
the United States. Those standards require that we plan and
perform the audit to obtain reasonable assurance about
whether the basic financial statements are free from material
misstatement.
An audit involves performing procedures to obtain audit
evidence about the amounts and disclosures in the basic
financial statements. The procedures selected depend on the
auditors’ judgment, including the assessment of the
risks of material misstatement of the financial statements,
whether due to fraud or error. In making those risk
assessments, the auditors consider internal control relevant to
the City’s preparation and fair presentation of the
financial statements in order to design audit procedures that are
appropriate in the circumstances, but not for the
purpose of expressing an opinion on the effectiveness of the
City’s internal control. Accordingly, we express no
such opinion. An audit also includes evaluating the
appropriateness of accounting policies used and the
reasonableness of significant accounting estimates made by
management, as well as evaluating the overall
presentation of the financial statements.
We believe that the audit evidence we have obtained is
sufficient and appropriate to provide a basis for our audit
opinions.
2
Opinions
In our opinion, the financial statements referred to above
present fairly, in all material respects, the respective
financial position of the governmental activities, the business-
type activities, each major fund and the aggregate
remaining fund information of the City, as of June 30, 2019,
and the respective changes in financial position and,
where applicable, cash flows thereof and the budgetary
comparison information for the General Fund for the year
then ended in accordance with accounting principles generally
accepted in the United States of America.
Other Matters
Required Supplementary Information
Accounting principles generally accepted in the United States of
America require that the management’s
discussion and analysis, the CalPERS pension plans - schedule
of proportionate share of the net pension liability
and the schedule of contributions - safety plans, the schedule of
changes in the net pension liability and related
ratios and the schedule of contributions - miscellaneous plan
and the other post-employment benefit
plan - schedule of changes in the OPEB liability and related
ratios, identified as Required Supplementary
Information (RSI) in the accompanying table of contents, be
presented to supplement the basic financial
statements. Such information, although not a part of the basic
financial statements, is required by the
Governmental Accounting Standards Board, who considers it to
be an essential part of financial reporting for
placing the basic financial statements in an appropriate
operational, economic, or historical context. We have
applied certain limited procedures to the RSI in accordance with
auditing standards generally accepted in the
United States of America, which consisted of inquiries of
management about the methods of preparing the
information and comparing the information for consistency with
management’s responses to our inquiries, the
basic financial statements and other knowledge we obtained
during the audit of the basic financial statements. We
do not express an opinion or provide any assurance on the RSI
because the limited procedures do not provide us
with sufficient evidence to express an opinion or provide any
assurance.
Other Information
Our audit was conducted for the purpose of forming opinions on
the financial statements that collectively comprise
the City’s basic financial statements. The introductory section,
the combining and individual fund statements and
schedules (supplementary information) and statistical section
are presented for purposes of additional analysis and
are not a required part of the basic financial statements.
The supplementary information, as listed in the table of
contents, is the responsibility of management and was
derived from and relates directly to the underlying accounting
and other records used to prepare the basic financial
statements. Such information has been subjected to the auditing
procedures applied in the audit of the basic
financial statements and certain additional procedures,
including comparing and reconciling such information
directly to the underlying accounting and other records used to
prepare the basic financial statements or to the
basic financial statements themselves and other additional
procedures in accordance with auditing standards
generally accepted in the United States of America. In our
opinion, the supplementary information is fairly stated
in all material respects in relation to the basic financial
statements as a whole.
3
Other Information (Continued)
The introductory section and statistical section have not been
subjected to the auditing procedures applied in the
audit of the basic financial statements and, accordingly, we do
not express an opinion or provide any assurance
on them.
Other Reporting Required by Government Auditing Standards
In accordance with Government Auditing Standards, we have
also issued our report dated December 19, 2019, on
our consideration of the City’s internal control over financial
reporting and on our tests of its compliance with
certain provisions of laws, regulations, contracts and grant
agreements and other matters. The purpose of that
report is to describe the scope of our testing of internal control
over financial reporting and compliance and the
results of that testing, and not to provide an opinion on internal
control over financial reporting or on compliance.
That report is an integral part of an audit performed in
accordance with Government Auditing Standards in
considering the City’s internal control over financial reporting
and compliance.
Irvine, California
December 19, 2019
4
THIS PAGE INTENTIONALLY LEFT BLANK
5
Management’s Discussion and Analysis
As management of the City of Colton, California (“City”) we
offer readers of the City’s financial statements this narrative
overview and analysis of the financial activities of the City of
Colton for the fiscal year ended June 30, 2019. To obtain a
complete picture of the City’s financial condition, this
document should be read in conjunction with the accompanying
letter
of transmittal and financial statements.
Financial Highlights
All changes in financial conditions in the following discussion
are expressed relative to fiscal year 2017-18. Please note that
each of these changes will be discussed in detail in the
appropriate sections of this analysis.
exceeded its liabilities and deferred inflows of resources
at the close of the fiscal year by $120,880,240 (net position).
The two components of this total are: ($6,867,489) in
governmental activities and $127,747,729 in business-type
activities.
$21,604,303, or 21.7%.
balance for the general fund was $6,290,763 and balances
committed for the City’s pension and OPEB liabilities total
$10,150,871 and $4,558,102 respectively.
-term liabilities related to Governmental Activities
decreased by $1,109,975 or 2.65%, while long-term
liabilities related to Business-type activities decreased
$4,974,049, or 7.51%, over the prior year.
activities reported combined ending net position of
($6,867,489), an increase of $11,955,819 over the prior year.
-term liabilities of the
governmental activities and business-type activities include net
pension liabilities of $78,046,285 and $18,883,836 respectively,
which represents increases of $1,382,613, or 1.8%,
and $458,846, or 2.5%, respectively. As of June 30, 2019, total
long-term liabilities of the governmental activities
and business-type activities include net OPEB liabilities of
$25,039,289 and $5,891,597 respectively, which
represents increases of $400,770, or 1.6%, and $93,403, or
1.6%, respectively.
Overview of the Financial Statements
This discussion and analysis is intended to serve as an
introduction to the City’s basic financial statements. The City’s
basic
financial statements contain three components: government-
wide financial statements; fund financial statements; and notes
to the basic financial statements
This report also contains supplementary information in addition
to the basic financial statements.
Government-wide Financial Statements. The government-wide
financial statements are designed to provide readers with
a broad overview of the City’s finances in a manner similar to a
private sector business. These statements include all assets,
deferred outflows of resources, liabilities, and deferred inflows
of resources of the City using the accrual basis of accounting,
which is similar to the accounting used by most private-sector
companies. All of the current year’s revenues and expenses
are taken into account regardless of when cash is received or
paid.
The statement of net position presents information on all City
assets deferred outflows of resources, liabilities, and deferred
inflows of resources, with the difference reported as net
position. Over time, increases or decreases in net position may
serve
as a useful indicator of whether the financial position of the
City is improving or deteriorating.
6
The statement of activities presents information showing how
the government’s net position changed during the most recent
fiscal year. All changes in net position are reported as soon as
the underlying event giving rise to the change occurs regardless
of the timing of related cash flows. Thus, some of the revenues
and expenses reported in this statement will have no effect on
cash until some future fiscal period.
Both government-wide financial statements distinguish
functions of the City that are principally supported by taxes and
intergovernmental revenues (governmental activities) from
functions that are intended to recover some or all of their costs
through user fees and charges (business-type activities).
Governmental activities. Most of the City’s basic services are
reported in this category, including general administration
(city manager, city clerk, finance, etc.), police and fire
protection, public works and community development. Property
taxes,
sales tax, transient occupancy tax, user fees, interest income,
franchise fees, state and federal grants, contributions from other
agencies, and other revenues finance these activities.
Business-type activities. The City charges a fee to customers to
cover all or most of the cost of certain services it provides.
The City’s Electric, Water and Wastewater utilities are reported
in this category.
The government-wide financial statements are available on
pages 17-19 of this report.
Fund Financial Statements. The fund financial statements
provide detailed information about the individual funds, not the
City as a whole. A fund is a fiscal and accounting entity with a
self-balancing set of accounts that is used to keep track of
specific sources of funding and spending for a particular
purpose. Certain funds are required by state law and bond
covenants.
However, additional funds have been established to assist with
controlling and managing money for particular purposes or to
show that legal responsibilities for using certain taxes, grants,
and other resources are being met. All of the funds of the City
can be divided into three categories: governmental funds,
proprietary funds, and fiduciary funds.
Governmental funds. Most of the City’s basic services are
reported in governmental funds, which focus on how money
flows in and out of those funds and year-end balances that are
available for spending. These funds are reported using an
accounting method called modified accrual accounting, which
measures cash and all other financial assets that can readily
be converted to cash. The governmental fund statements provide
a detailed short-term view of the City’s general government
operations and the basic services it provides. Governmental
fund information helps determine whether there are more or
fewer financial resources that can be spent in the near future to
finance the City’s programs. The differences between the
results in the governmental fund financial statements to those in
the government-wide financial statements are explained in a
reconciliation following each governmental fund financial
statement.
In addition to the major funds reported separately on the
governmental fund balance sheet and in the governmental fund
statement of revenues, expenditures, and changes in fund
balances, the City also maintains 18 special revenue funds, 3
capital
project funds, and 2 debt service funds. Data from these funds
are combined into a single, aggregated presentation referred
to as other governmental funds. Individual fund data for each of
these non-major governmental funds is provided in the form
of combining statements after the notes section of the report.
The City adopts an annual appropriated budget for all of its
governmental and proprietary funds. Budgetary comparison
statements have been provided for the General Fund to
demonstrate compliance with this budget. This comparison is
available
on page 25 of this report.
The basic governmental fund financial statements are available
on pages 20-23 of this report.
7
Proprietary funds. When the City charges customers for the
services it provides, these services are generally reported in
proprietary funds. The City maintains two different types of
proprietary funds: enterprise funds and internal service funds.
Enterprise funds are used to report the same functions presented
as business-type activities in the government-wide financial
statements. The City uses enterprise funds to account for its
Electric, Water and Wastewater activities. Internal service funds
are an accounting device used to accumulate and allocate costs
internally among the City’s various functions. The City uses
an internal service fund to account for its insurance programs,
information services department and facilities/equipment
maintenance activities. Because these services predominantly
benefit governmental rather than business-type functions, these
funds have been included within governmental activities in the
government-wide financial statement.
Proprietary funds provide the same type of information as the
government-wide financial statements with more detail. The
proprietary fund financial statements provide separate
information for the Electric, Water and Wastewater operations,
all of
which are considered major funds of the City. The City’s
internal service funds combined are shown separately under the
heading Governmental Activities – Internal Service Funds.
The basic proprietary fund financial statements are available on
pages 26-35 of this report.
Fiduciary Funds. Fiduciary funds are used to account for
resources held for the benefit of parties outside the government.
Fiduciary funds are not reflected in the government-wide
financial statements because the resources of these funds are not
available to support the City’s programs. The accounting used
for fiduciary funds is much like that used for proprietary funds.
The City’s fiduciary activities are reported in a separate
Statement of Fiduciary Net Position. Individual fund data for
each
of these fiduciary funds is provided in the form of combining
statements after the notes section of the report. The City
currently
has two agency funds and two private-purpose trust funds. The
Successor Agency of the former Redevelopment Agency
(RDA) is accounted for as a private-purpose trust fund.
The basic fiduciary fund financial statements are available on
pages 36-37 of this report.
Notes to the financial statements. The notes provide additional
information that is essential to a full understanding of the
data provided in the government-wide and fund financial
statements. The Notes to the financial statements are available
on
pages 39-87 of this report.
Required Supplementary Information. Required actuarial
valuation schedules and underlying assumptions for Safety and
Miscellaneous CalPERS Pension Plans and the schedule of
progress for the Other Post-Employment Benefits (OPEB) Plan
are contained in this section. Required Supplementary
Information is available on pages 89-94 of this report.
Other information. In addition, the combining statements
referred to earlier in connection with non-major governmental
funds, internal service funds and fiduciary funds are presented
immediately following the notes to the financial statements.
Combining and individual fund statements and schedules are
available on pages 95-143 of this report.
8
GOVERNMENT-WIDE FINANCIAL ANALYSIS
As referenced earlier, net position may serve over time as a
useful indicator of a government’s financial position. At the end
of the current year, total City assets and deferred outflows of
resources exceeded liabilities and deferred inflows of resources
by $120,880,240, an increase of $21,604,303 over the prior
year. Of this net increase, governmental activities net position
increased by $11,955,891 and business-type activities increased
by $9,648,484. The underlying reasons for major changes in
each of these components will be discussed in the following
sections.
Governmental Activities
In the case of the City, governmental activities increased the
City of Colton’s net position by $11,955,819 a 63.5% increase
over the prior year. By far, the largest portion of the City’s net
position is its investment in capital assets. Total assets and
deferred outflows of resources for governmental activities
increased $11,842,551, or 8.9%.
Total assets government-wide increased by $21,943,009 as a
result of increases in revenues that were complemented by a
decrease in expenses. Total revenues increased by $2,331,673,
which is attributed to increases in the property taxes, sales
taxes, franchises, transient occupancy taxes, investment income,
and capital gains and contributions. Declines were realized
in the operating grants and contributions category for general
government and transfers. Overall, the increase in revenues is
a positive indicator showing stabilizing growth in the City. The
City’s governmental expenses were $2,268,760 lower in
comparison to the prior year. Year-over-year reductions in
General Government, Public Works, and Interest on long-term
debt expenditure categories offset increases in expenditures
related to Public Safety and Community Services.
2019 2018 2019 2018 2019 2018
Current and Other Assets 58,008,713$ 44,190,218$
102,264,369$ 98,515,685$ 160,273,082$
142,705,903$
Capital Assets 70,112,845 67,464,024 114,234,032
112,507,023 184,346,877$ 179,971,047$
Total Assets 128,121,558 111,654,242 216,498,401
211,022,708 …

More Related Content

Similar to Effects of episodic fluid flow on hydrocarbon migration inth.docx

Terry Engelder Letter to PNAS Objecting to Publication of Duke Study on Brine...
Terry Engelder Letter to PNAS Objecting to Publication of Duke Study on Brine...Terry Engelder Letter to PNAS Objecting to Publication of Duke Study on Brine...
Terry Engelder Letter to PNAS Objecting to Publication of Duke Study on Brine...Marcellus Drilling News
 
Annals of Limnology and Oceanography
Annals of Limnology and OceanographyAnnals of Limnology and Oceanography
Annals of Limnology and Oceanographypeertechzpublication
 
Annals of Limnology and Oceanography
Annals of Limnology and OceanographyAnnals of Limnology and Oceanography
Annals of Limnology and Oceanographypeertechzpublication
 
USGS: Can Shale Safely Host U.S. Nuclear Waste?
USGS: Can Shale Safely Host U.S. Nuclear Waste?USGS: Can Shale Safely Host U.S. Nuclear Waste?
USGS: Can Shale Safely Host U.S. Nuclear Waste?Marcellus Drilling News
 
Saltwater intrusion model pompano fl
Saltwater intrusion model pompano flSaltwater intrusion model pompano fl
Saltwater intrusion model pompano flDarrel Dunn
 
Study: Fault activation by hydraulic fracturing in western Canada
Study: Fault activation by hydraulic fracturing in western CanadaStudy: Fault activation by hydraulic fracturing in western Canada
Study: Fault activation by hydraulic fracturing in western CanadaMarcellus Drilling News
 
Baseline Water Study of 113 Wells in Chenango County, NY
Baseline Water Study of 113 Wells in Chenango County, NYBaseline Water Study of 113 Wells in Chenango County, NY
Baseline Water Study of 113 Wells in Chenango County, NYMarcellus Drilling News
 
impactos del cambio climatico en ecosistemas costeros
 impactos del cambio climatico en ecosistemas costeros impactos del cambio climatico en ecosistemas costeros
impactos del cambio climatico en ecosistemas costerosXin San
 
Global Warming Effect Groundwater Proposal
Global Warming Effect Groundwater ProposalGlobal Warming Effect Groundwater Proposal
Global Warming Effect Groundwater Proposalmahfoodhshuely
 
EUSTATIC CHANGES IN QUATERNARY_083406.pptx
EUSTATIC CHANGES IN QUATERNARY_083406.pptxEUSTATIC CHANGES IN QUATERNARY_083406.pptx
EUSTATIC CHANGES IN QUATERNARY_083406.pptxKuki Boruah
 
Molofsky_et_al-2016-Groundwater
Molofsky_et_al-2016-GroundwaterMolofsky_et_al-2016-Groundwater
Molofsky_et_al-2016-GroundwaterLisa Molofsky
 
Stratigraphy-SEQUENCES.pptx
Stratigraphy-SEQUENCES.pptxStratigraphy-SEQUENCES.pptx
Stratigraphy-SEQUENCES.pptxSaadTaman
 

Similar to Effects of episodic fluid flow on hydrocarbon migration inth.docx (20)

Terry Engelder Letter to PNAS Objecting to Publication of Duke Study on Brine...
Terry Engelder Letter to PNAS Objecting to Publication of Duke Study on Brine...Terry Engelder Letter to PNAS Objecting to Publication of Duke Study on Brine...
Terry Engelder Letter to PNAS Objecting to Publication of Duke Study on Brine...
 
Annals of Limnology and Oceanography
Annals of Limnology and OceanographyAnnals of Limnology and Oceanography
Annals of Limnology and Oceanography
 
Annals of Limnology and Oceanography
Annals of Limnology and OceanographyAnnals of Limnology and Oceanography
Annals of Limnology and Oceanography
 
USGS: Can Shale Safely Host U.S. Nuclear Waste?
USGS: Can Shale Safely Host U.S. Nuclear Waste?USGS: Can Shale Safely Host U.S. Nuclear Waste?
USGS: Can Shale Safely Host U.S. Nuclear Waste?
 
PRIMERA EVIDENCIA DE DEPÓSITOS DE PALEO-TSUNAMIS DE UN GRANDE ACONTECIMIENTO ...
PRIMERA EVIDENCIA DE DEPÓSITOS DE PALEO-TSUNAMIS DE UN GRANDE ACONTECIMIENTO ...PRIMERA EVIDENCIA DE DEPÓSITOS DE PALEO-TSUNAMIS DE UN GRANDE ACONTECIMIENTO ...
PRIMERA EVIDENCIA DE DEPÓSITOS DE PALEO-TSUNAMIS DE UN GRANDE ACONTECIMIENTO ...
 
Depositional sequences
Depositional sequencesDepositional sequences
Depositional sequences
 
Saltwater intrusion model pompano fl
Saltwater intrusion model pompano flSaltwater intrusion model pompano fl
Saltwater intrusion model pompano fl
 
Spe 168666-ms
Spe 168666-msSpe 168666-ms
Spe 168666-ms
 
Study: Fault activation by hydraulic fracturing in western Canada
Study: Fault activation by hydraulic fracturing in western CanadaStudy: Fault activation by hydraulic fracturing in western Canada
Study: Fault activation by hydraulic fracturing in western Canada
 
3D Seismic Refraction
3D Seismic Refraction3D Seismic Refraction
3D Seismic Refraction
 
Dieterich et al 2016
Dieterich et al 2016Dieterich et al 2016
Dieterich et al 2016
 
Baseline Water Study of 113 Wells in Chenango County, NY
Baseline Water Study of 113 Wells in Chenango County, NYBaseline Water Study of 113 Wells in Chenango County, NY
Baseline Water Study of 113 Wells in Chenango County, NY
 
impactos del cambio climatico en ecosistemas costeros
 impactos del cambio climatico en ecosistemas costeros impactos del cambio climatico en ecosistemas costeros
impactos del cambio climatico en ecosistemas costeros
 
Impact of climate on groundwater
Impact of climate on groundwaterImpact of climate on groundwater
Impact of climate on groundwater
 
Lit Review7
Lit Review7Lit Review7
Lit Review7
 
Global Warming Effect Groundwater Proposal
Global Warming Effect Groundwater ProposalGlobal Warming Effect Groundwater Proposal
Global Warming Effect Groundwater Proposal
 
EUSTATIC CHANGES IN QUATERNARY_083406.pptx
EUSTATIC CHANGES IN QUATERNARY_083406.pptxEUSTATIC CHANGES IN QUATERNARY_083406.pptx
EUSTATIC CHANGES IN QUATERNARY_083406.pptx
 
Molofsky_et_al-2016-Groundwater
Molofsky_et_al-2016-GroundwaterMolofsky_et_al-2016-Groundwater
Molofsky_et_al-2016-Groundwater
 
Minsley et al 2011 - JEEG
Minsley et al 2011 - JEEGMinsley et al 2011 - JEEG
Minsley et al 2011 - JEEG
 
Stratigraphy-SEQUENCES.pptx
Stratigraphy-SEQUENCES.pptxStratigraphy-SEQUENCES.pptx
Stratigraphy-SEQUENCES.pptx
 

More from toltonkendal

Elementary CurriculaBoth articles highlight the fact that middle.docx
Elementary CurriculaBoth articles highlight the fact that middle.docxElementary CurriculaBoth articles highlight the fact that middle.docx
Elementary CurriculaBoth articles highlight the fact that middle.docxtoltonkendal
 
Elementary Statistics (MATH220)Assignment Statistic.docx
Elementary Statistics (MATH220)Assignment Statistic.docxElementary Statistics (MATH220)Assignment Statistic.docx
Elementary Statistics (MATH220)Assignment Statistic.docxtoltonkendal
 
Elements of Religious Traditions PaperWritea 700- to 1,050-word .docx
Elements of Religious Traditions PaperWritea 700- to 1,050-word .docxElements of Religious Traditions PaperWritea 700- to 1,050-word .docx
Elements of Religious Traditions PaperWritea 700- to 1,050-word .docxtoltonkendal
 
Elements of MusicPitch- relative highness or lowness that we .docx
Elements of MusicPitch-  relative highness or lowness that we .docxElements of MusicPitch-  relative highness or lowness that we .docx
Elements of MusicPitch- relative highness or lowness that we .docxtoltonkendal
 
Elevated Blood Lead Levels in Children AssociatedWith the Fl.docx
Elevated Blood Lead Levels in Children AssociatedWith the Fl.docxElevated Blood Lead Levels in Children AssociatedWith the Fl.docx
Elevated Blood Lead Levels in Children AssociatedWith the Fl.docxtoltonkendal
 
Elev ent h EDIT IONREAL ESTATE PRINCIPLESCHARLES F. .docx
Elev ent h EDIT IONREAL ESTATE PRINCIPLESCHARLES F. .docxElev ent h EDIT IONREAL ESTATE PRINCIPLESCHARLES F. .docx
Elev ent h EDIT IONREAL ESTATE PRINCIPLESCHARLES F. .docxtoltonkendal
 
Elements of the Communication ProcessIn Chapter One, we learne.docx
Elements of the Communication ProcessIn Chapter One, we learne.docxElements of the Communication ProcessIn Chapter One, we learne.docx
Elements of the Communication ProcessIn Chapter One, we learne.docxtoltonkendal
 
Elements of Music #1 Handout1. Rhythm the flow of music in te.docx
Elements of Music #1 Handout1. Rhythm  the flow of music in te.docxElements of Music #1 Handout1. Rhythm  the flow of music in te.docx
Elements of Music #1 Handout1. Rhythm the flow of music in te.docxtoltonkendal
 
Elements of Music Report InstrumentsFor the assignment on the el.docx
Elements of Music Report InstrumentsFor the assignment on the el.docxElements of Music Report InstrumentsFor the assignment on the el.docx
Elements of Music Report InstrumentsFor the assignment on the el.docxtoltonkendal
 
Elements of GenreAfter watching three of the five .docx
Elements of GenreAfter watching three of the five .docxElements of GenreAfter watching three of the five .docx
Elements of GenreAfter watching three of the five .docxtoltonkendal
 
Elements of DesignDuring the process of envisioning and designing .docx
Elements of DesignDuring the process of envisioning and designing .docxElements of DesignDuring the process of envisioning and designing .docx
Elements of DesignDuring the process of envisioning and designing .docxtoltonkendal
 
Elements of Critical Thinking [WLOs 2, 3, 4] [CLOs 2, 3, 4]P.docx
Elements of Critical Thinking [WLOs 2, 3, 4] [CLOs 2, 3, 4]P.docxElements of Critical Thinking [WLOs 2, 3, 4] [CLOs 2, 3, 4]P.docx
Elements of Critical Thinking [WLOs 2, 3, 4] [CLOs 2, 3, 4]P.docxtoltonkendal
 
Elements of DesignDuring the process of envisioning and design.docx
Elements of DesignDuring the process of envisioning and design.docxElements of DesignDuring the process of envisioning and design.docx
Elements of DesignDuring the process of envisioning and design.docxtoltonkendal
 
Elements of a contact due 16 OctRead the Case Campbell Soup Co. v..docx
Elements of a contact due 16 OctRead the Case Campbell Soup Co. v..docxElements of a contact due 16 OctRead the Case Campbell Soup Co. v..docx
Elements of a contact due 16 OctRead the Case Campbell Soup Co. v..docxtoltonkendal
 
Elements for analyzing mise en sceneIdentify the components of.docx
Elements for analyzing mise en sceneIdentify the components of.docxElements for analyzing mise en sceneIdentify the components of.docx
Elements for analyzing mise en sceneIdentify the components of.docxtoltonkendal
 
Elements in the same row have the same number of () levelsWhi.docx
Elements in the same row have the same number of () levelsWhi.docxElements in the same row have the same number of () levelsWhi.docx
Elements in the same row have the same number of () levelsWhi.docxtoltonkendal
 
ELEG 421 Control Systems Transient and Steady State .docx
ELEG 421 Control Systems  Transient and Steady State .docxELEG 421 Control Systems  Transient and Steady State .docx
ELEG 421 Control Systems Transient and Steady State .docxtoltonkendal
 
Element 010 ASSIGNMENT 3000 WORDS (100)Task Individual assign.docx
Element 010 ASSIGNMENT 3000 WORDS (100)Task Individual assign.docxElement 010 ASSIGNMENT 3000 WORDS (100)Task Individual assign.docx
Element 010 ASSIGNMENT 3000 WORDS (100)Task Individual assign.docxtoltonkendal
 
ELEG 320L – Signals & Systems Laboratory Dr. Jibran Khan Yous.docx
ELEG 320L – Signals & Systems Laboratory Dr. Jibran Khan Yous.docxELEG 320L – Signals & Systems Laboratory Dr. Jibran Khan Yous.docx
ELEG 320L – Signals & Systems Laboratory Dr. Jibran Khan Yous.docxtoltonkendal
 
Electronic Media PresentationChoose two of the following.docx
Electronic Media PresentationChoose two of the following.docxElectronic Media PresentationChoose two of the following.docx
Electronic Media PresentationChoose two of the following.docxtoltonkendal
 

More from toltonkendal (20)

Elementary CurriculaBoth articles highlight the fact that middle.docx
Elementary CurriculaBoth articles highlight the fact that middle.docxElementary CurriculaBoth articles highlight the fact that middle.docx
Elementary CurriculaBoth articles highlight the fact that middle.docx
 
Elementary Statistics (MATH220)Assignment Statistic.docx
Elementary Statistics (MATH220)Assignment Statistic.docxElementary Statistics (MATH220)Assignment Statistic.docx
Elementary Statistics (MATH220)Assignment Statistic.docx
 
Elements of Religious Traditions PaperWritea 700- to 1,050-word .docx
Elements of Religious Traditions PaperWritea 700- to 1,050-word .docxElements of Religious Traditions PaperWritea 700- to 1,050-word .docx
Elements of Religious Traditions PaperWritea 700- to 1,050-word .docx
 
Elements of MusicPitch- relative highness or lowness that we .docx
Elements of MusicPitch-  relative highness or lowness that we .docxElements of MusicPitch-  relative highness or lowness that we .docx
Elements of MusicPitch- relative highness or lowness that we .docx
 
Elevated Blood Lead Levels in Children AssociatedWith the Fl.docx
Elevated Blood Lead Levels in Children AssociatedWith the Fl.docxElevated Blood Lead Levels in Children AssociatedWith the Fl.docx
Elevated Blood Lead Levels in Children AssociatedWith the Fl.docx
 
Elev ent h EDIT IONREAL ESTATE PRINCIPLESCHARLES F. .docx
Elev ent h EDIT IONREAL ESTATE PRINCIPLESCHARLES F. .docxElev ent h EDIT IONREAL ESTATE PRINCIPLESCHARLES F. .docx
Elev ent h EDIT IONREAL ESTATE PRINCIPLESCHARLES F. .docx
 
Elements of the Communication ProcessIn Chapter One, we learne.docx
Elements of the Communication ProcessIn Chapter One, we learne.docxElements of the Communication ProcessIn Chapter One, we learne.docx
Elements of the Communication ProcessIn Chapter One, we learne.docx
 
Elements of Music #1 Handout1. Rhythm the flow of music in te.docx
Elements of Music #1 Handout1. Rhythm  the flow of music in te.docxElements of Music #1 Handout1. Rhythm  the flow of music in te.docx
Elements of Music #1 Handout1. Rhythm the flow of music in te.docx
 
Elements of Music Report InstrumentsFor the assignment on the el.docx
Elements of Music Report InstrumentsFor the assignment on the el.docxElements of Music Report InstrumentsFor the assignment on the el.docx
Elements of Music Report InstrumentsFor the assignment on the el.docx
 
Elements of GenreAfter watching three of the five .docx
Elements of GenreAfter watching three of the five .docxElements of GenreAfter watching three of the five .docx
Elements of GenreAfter watching three of the five .docx
 
Elements of DesignDuring the process of envisioning and designing .docx
Elements of DesignDuring the process of envisioning and designing .docxElements of DesignDuring the process of envisioning and designing .docx
Elements of DesignDuring the process of envisioning and designing .docx
 
Elements of Critical Thinking [WLOs 2, 3, 4] [CLOs 2, 3, 4]P.docx
Elements of Critical Thinking [WLOs 2, 3, 4] [CLOs 2, 3, 4]P.docxElements of Critical Thinking [WLOs 2, 3, 4] [CLOs 2, 3, 4]P.docx
Elements of Critical Thinking [WLOs 2, 3, 4] [CLOs 2, 3, 4]P.docx
 
Elements of DesignDuring the process of envisioning and design.docx
Elements of DesignDuring the process of envisioning and design.docxElements of DesignDuring the process of envisioning and design.docx
Elements of DesignDuring the process of envisioning and design.docx
 
Elements of a contact due 16 OctRead the Case Campbell Soup Co. v..docx
Elements of a contact due 16 OctRead the Case Campbell Soup Co. v..docxElements of a contact due 16 OctRead the Case Campbell Soup Co. v..docx
Elements of a contact due 16 OctRead the Case Campbell Soup Co. v..docx
 
Elements for analyzing mise en sceneIdentify the components of.docx
Elements for analyzing mise en sceneIdentify the components of.docxElements for analyzing mise en sceneIdentify the components of.docx
Elements for analyzing mise en sceneIdentify the components of.docx
 
Elements in the same row have the same number of () levelsWhi.docx
Elements in the same row have the same number of () levelsWhi.docxElements in the same row have the same number of () levelsWhi.docx
Elements in the same row have the same number of () levelsWhi.docx
 
ELEG 421 Control Systems Transient and Steady State .docx
ELEG 421 Control Systems  Transient and Steady State .docxELEG 421 Control Systems  Transient and Steady State .docx
ELEG 421 Control Systems Transient and Steady State .docx
 
Element 010 ASSIGNMENT 3000 WORDS (100)Task Individual assign.docx
Element 010 ASSIGNMENT 3000 WORDS (100)Task Individual assign.docxElement 010 ASSIGNMENT 3000 WORDS (100)Task Individual assign.docx
Element 010 ASSIGNMENT 3000 WORDS (100)Task Individual assign.docx
 
ELEG 320L – Signals & Systems Laboratory Dr. Jibran Khan Yous.docx
ELEG 320L – Signals & Systems Laboratory Dr. Jibran Khan Yous.docxELEG 320L – Signals & Systems Laboratory Dr. Jibran Khan Yous.docx
ELEG 320L – Signals & Systems Laboratory Dr. Jibran Khan Yous.docx
 
Electronic Media PresentationChoose two of the following.docx
Electronic Media PresentationChoose two of the following.docxElectronic Media PresentationChoose two of the following.docx
Electronic Media PresentationChoose two of the following.docx
 

Recently uploaded

POINT- BIOCHEMISTRY SEM 2 ENZYMES UNIT 5.pptx
POINT- BIOCHEMISTRY SEM 2 ENZYMES UNIT 5.pptxPOINT- BIOCHEMISTRY SEM 2 ENZYMES UNIT 5.pptx
POINT- BIOCHEMISTRY SEM 2 ENZYMES UNIT 5.pptxSayali Powar
 
Science 7 - LAND and SEA BREEZE and its Characteristics
Science 7 - LAND and SEA BREEZE and its CharacteristicsScience 7 - LAND and SEA BREEZE and its Characteristics
Science 7 - LAND and SEA BREEZE and its CharacteristicsKarinaGenton
 
How to Make a Pirate ship Primary Education.pptx
How to Make a Pirate ship Primary Education.pptxHow to Make a Pirate ship Primary Education.pptx
How to Make a Pirate ship Primary Education.pptxmanuelaromero2013
 
Crayon Activity Handout For the Crayon A
Crayon Activity Handout For the Crayon ACrayon Activity Handout For the Crayon A
Crayon Activity Handout For the Crayon AUnboundStockton
 
Biting mechanism of poisonous snakes.pdf
Biting mechanism of poisonous snakes.pdfBiting mechanism of poisonous snakes.pdf
Biting mechanism of poisonous snakes.pdfadityarao40181
 
ENGLISH5 QUARTER4 MODULE1 WEEK1-3 How Visual and Multimedia Elements.pptx
ENGLISH5 QUARTER4 MODULE1 WEEK1-3 How Visual and Multimedia Elements.pptxENGLISH5 QUARTER4 MODULE1 WEEK1-3 How Visual and Multimedia Elements.pptx
ENGLISH5 QUARTER4 MODULE1 WEEK1-3 How Visual and Multimedia Elements.pptxAnaBeatriceAblay2
 
Call Girls in Dwarka Mor Delhi Contact Us 9654467111
Call Girls in Dwarka Mor Delhi Contact Us 9654467111Call Girls in Dwarka Mor Delhi Contact Us 9654467111
Call Girls in Dwarka Mor Delhi Contact Us 9654467111Sapana Sha
 
Final demo Grade 9 for demo Plan dessert.pptx
Final demo Grade 9 for demo Plan dessert.pptxFinal demo Grade 9 for demo Plan dessert.pptx
Final demo Grade 9 for demo Plan dessert.pptxAvyJaneVismanos
 
Sanyam Choudhary Chemistry practical.pdf
Sanyam Choudhary Chemistry practical.pdfSanyam Choudhary Chemistry practical.pdf
Sanyam Choudhary Chemistry practical.pdfsanyamsingh5019
 
Class 11 Legal Studies Ch-1 Concept of State .pdf
Class 11 Legal Studies Ch-1 Concept of State .pdfClass 11 Legal Studies Ch-1 Concept of State .pdf
Class 11 Legal Studies Ch-1 Concept of State .pdfakmcokerachita
 
Pharmacognosy Flower 3. Compositae 2023.pdf
Pharmacognosy Flower 3. Compositae 2023.pdfPharmacognosy Flower 3. Compositae 2023.pdf
Pharmacognosy Flower 3. Compositae 2023.pdfMahmoud M. Sallam
 
Paris 2024 Olympic Geographies - an activity
Paris 2024 Olympic Geographies - an activityParis 2024 Olympic Geographies - an activity
Paris 2024 Olympic Geographies - an activityGeoBlogs
 
call girls in Kamla Market (DELHI) 🔝 >༒9953330565🔝 genuine Escort Service 🔝✔️✔️
call girls in Kamla Market (DELHI) 🔝 >༒9953330565🔝 genuine Escort Service 🔝✔️✔️call girls in Kamla Market (DELHI) 🔝 >༒9953330565🔝 genuine Escort Service 🔝✔️✔️
call girls in Kamla Market (DELHI) 🔝 >༒9953330565🔝 genuine Escort Service 🔝✔️✔️9953056974 Low Rate Call Girls In Saket, Delhi NCR
 
“Oh GOSH! Reflecting on Hackteria's Collaborative Practices in a Global Do-It...
“Oh GOSH! Reflecting on Hackteria's Collaborative Practices in a Global Do-It...“Oh GOSH! Reflecting on Hackteria's Collaborative Practices in a Global Do-It...
“Oh GOSH! Reflecting on Hackteria's Collaborative Practices in a Global Do-It...Marc Dusseiller Dusjagr
 
internship ppt on smartinternz platform as salesforce developer
internship ppt on smartinternz platform as salesforce developerinternship ppt on smartinternz platform as salesforce developer
internship ppt on smartinternz platform as salesforce developerunnathinaik
 
EPANDING THE CONTENT OF AN OUTLINE using notes.pptx
EPANDING THE CONTENT OF AN OUTLINE using notes.pptxEPANDING THE CONTENT OF AN OUTLINE using notes.pptx
EPANDING THE CONTENT OF AN OUTLINE using notes.pptxRaymartEstabillo3
 
How to Configure Email Server in Odoo 17
How to Configure Email Server in Odoo 17How to Configure Email Server in Odoo 17
How to Configure Email Server in Odoo 17Celine George
 
CARE OF CHILD IN INCUBATOR..........pptx
CARE OF CHILD IN INCUBATOR..........pptxCARE OF CHILD IN INCUBATOR..........pptx
CARE OF CHILD IN INCUBATOR..........pptxGaneshChakor2
 

Recently uploaded (20)

POINT- BIOCHEMISTRY SEM 2 ENZYMES UNIT 5.pptx
POINT- BIOCHEMISTRY SEM 2 ENZYMES UNIT 5.pptxPOINT- BIOCHEMISTRY SEM 2 ENZYMES UNIT 5.pptx
POINT- BIOCHEMISTRY SEM 2 ENZYMES UNIT 5.pptx
 
Science 7 - LAND and SEA BREEZE and its Characteristics
Science 7 - LAND and SEA BREEZE and its CharacteristicsScience 7 - LAND and SEA BREEZE and its Characteristics
Science 7 - LAND and SEA BREEZE and its Characteristics
 
How to Make a Pirate ship Primary Education.pptx
How to Make a Pirate ship Primary Education.pptxHow to Make a Pirate ship Primary Education.pptx
How to Make a Pirate ship Primary Education.pptx
 
Crayon Activity Handout For the Crayon A
Crayon Activity Handout For the Crayon ACrayon Activity Handout For the Crayon A
Crayon Activity Handout For the Crayon A
 
Biting mechanism of poisonous snakes.pdf
Biting mechanism of poisonous snakes.pdfBiting mechanism of poisonous snakes.pdf
Biting mechanism of poisonous snakes.pdf
 
ENGLISH5 QUARTER4 MODULE1 WEEK1-3 How Visual and Multimedia Elements.pptx
ENGLISH5 QUARTER4 MODULE1 WEEK1-3 How Visual and Multimedia Elements.pptxENGLISH5 QUARTER4 MODULE1 WEEK1-3 How Visual and Multimedia Elements.pptx
ENGLISH5 QUARTER4 MODULE1 WEEK1-3 How Visual and Multimedia Elements.pptx
 
Call Girls in Dwarka Mor Delhi Contact Us 9654467111
Call Girls in Dwarka Mor Delhi Contact Us 9654467111Call Girls in Dwarka Mor Delhi Contact Us 9654467111
Call Girls in Dwarka Mor Delhi Contact Us 9654467111
 
Final demo Grade 9 for demo Plan dessert.pptx
Final demo Grade 9 for demo Plan dessert.pptxFinal demo Grade 9 for demo Plan dessert.pptx
Final demo Grade 9 for demo Plan dessert.pptx
 
Sanyam Choudhary Chemistry practical.pdf
Sanyam Choudhary Chemistry practical.pdfSanyam Choudhary Chemistry practical.pdf
Sanyam Choudhary Chemistry practical.pdf
 
Class 11 Legal Studies Ch-1 Concept of State .pdf
Class 11 Legal Studies Ch-1 Concept of State .pdfClass 11 Legal Studies Ch-1 Concept of State .pdf
Class 11 Legal Studies Ch-1 Concept of State .pdf
 
Pharmacognosy Flower 3. Compositae 2023.pdf
Pharmacognosy Flower 3. Compositae 2023.pdfPharmacognosy Flower 3. Compositae 2023.pdf
Pharmacognosy Flower 3. Compositae 2023.pdf
 
Paris 2024 Olympic Geographies - an activity
Paris 2024 Olympic Geographies - an activityParis 2024 Olympic Geographies - an activity
Paris 2024 Olympic Geographies - an activity
 
call girls in Kamla Market (DELHI) 🔝 >༒9953330565🔝 genuine Escort Service 🔝✔️✔️
call girls in Kamla Market (DELHI) 🔝 >༒9953330565🔝 genuine Escort Service 🔝✔️✔️call girls in Kamla Market (DELHI) 🔝 >༒9953330565🔝 genuine Escort Service 🔝✔️✔️
call girls in Kamla Market (DELHI) 🔝 >༒9953330565🔝 genuine Escort Service 🔝✔️✔️
 
“Oh GOSH! Reflecting on Hackteria's Collaborative Practices in a Global Do-It...
“Oh GOSH! Reflecting on Hackteria's Collaborative Practices in a Global Do-It...“Oh GOSH! Reflecting on Hackteria's Collaborative Practices in a Global Do-It...
“Oh GOSH! Reflecting on Hackteria's Collaborative Practices in a Global Do-It...
 
internship ppt on smartinternz platform as salesforce developer
internship ppt on smartinternz platform as salesforce developerinternship ppt on smartinternz platform as salesforce developer
internship ppt on smartinternz platform as salesforce developer
 
TataKelola dan KamSiber Kecerdasan Buatan v022.pdf
TataKelola dan KamSiber Kecerdasan Buatan v022.pdfTataKelola dan KamSiber Kecerdasan Buatan v022.pdf
TataKelola dan KamSiber Kecerdasan Buatan v022.pdf
 
Staff of Color (SOC) Retention Efforts DDSD
Staff of Color (SOC) Retention Efforts DDSDStaff of Color (SOC) Retention Efforts DDSD
Staff of Color (SOC) Retention Efforts DDSD
 
EPANDING THE CONTENT OF AN OUTLINE using notes.pptx
EPANDING THE CONTENT OF AN OUTLINE using notes.pptxEPANDING THE CONTENT OF AN OUTLINE using notes.pptx
EPANDING THE CONTENT OF AN OUTLINE using notes.pptx
 
How to Configure Email Server in Odoo 17
How to Configure Email Server in Odoo 17How to Configure Email Server in Odoo 17
How to Configure Email Server in Odoo 17
 
CARE OF CHILD IN INCUBATOR..........pptx
CARE OF CHILD IN INCUBATOR..........pptxCARE OF CHILD IN INCUBATOR..........pptx
CARE OF CHILD IN INCUBATOR..........pptx
 

Effects of episodic fluid flow on hydrocarbon migration inth.docx

  • 1. Effects of episodic fluid flow on hydrocarbon migration in the Newport-Inglewood Fault Zone, Southern California B. JUNG1, G. GARVEN 2 AND J. R. BOLES3 1Department of Earth Sciences, Uppsala University, Uppsala, Sweden; 2Department of Earth and Ocean Sciences, Tufts University, Medford, MA, USA; 3Department of Earth Science, University of California, Santa Barbara, CA, USA ABSTRACT Fault permeability may vary through time due to tectonic deformations, transients in pore pressure and effective stress, and mineralization associated with water-rock reactions. Time-varying permeability will affect subsurface fluid migration rates and patterns of petroleum accumulation in densely faulted sedimentary basins such as those associated with the borderland basins of Southern California. This study explores the petroleum fluid dynamics of this migration. As a multiphase flow and petroleum migration case study on the role of faults, computational models for both episodic and continuous hydrocarbon migration are constructed to investigate large-scale fluid flow and petroleum accumulation along a northern section of
  • 2. the Newport-Inglewood fault zone in the Los Angeles basin, Southern California. The numerical code solves the governing equations for oil, water, and heat transport in heterogeneous and anisotropic geologic cross sections but neglects flow in the third dimension for practical applications. Our numerical results suggest that fault permeability and fluid pressure fluctuations are cru- cial factors for distributing hydrocarbon accumulations associated with fault zones, and they also play important roles in controlling the geologic timing for reservoir filling. Episodic flow appears to enhance hydrocarbon accu- mulation more strongly by enabling stepwise build-up in oil saturation in adjacent sedimentary formations due to temporally high pore pressure and high permeability caused by periodic fault rupture. Under assumptions that fault permeability fluctuate within the range of 1–1000 millidarcys (10�15–10�12 m2) and fault pressures fluctuate within 10–80% of overpressure ratio, the estimated oil volume in the Inglewood oil field (approximately 450 mil- lion barrels oil equivalent) can be accumulated in about 24 000 years, assuming a seismically induced fluid flow event occurs every 2000 years. This episodic petroleum migration model could be more geologically important than a continuous-flow model, when considering the observed patterns of hydrocarbons and seismically active
  • 3. tectonic setting of the Los Angeles basin. Key words: episodic fluid flow, fluid flow in faults, multiphase flow in siliciclastic sedimentary basins, petroleum migration Received 21 May 2013; accepted 16 October 2013 Corresponding author: Byeongju Jung, Department of Earth Sciences, Uppsala University, Gl227 Geocentrum, Villav€agen 16B, 753 36 Uppsala, Sweden. Email: [email protected] Tel: +46 018 471 2264. Fax: +1 617 627 3584. Geofluids (2014) 14, 234–250 INTRODUCTION Large-scale faults in sedimentary basins have become increasingly studied due to their important role in convey- ing and compartmentalizing hydrocarbons (Aydin 2000; Boles et al. 2004; Karlsen & Skeie 2006; Kroeger et al. 2009; Zhang et al. 2009; Gong et al. 2011). The hydro- mechanical properties of faults in active continental mar- gins are strongly affected by tectonic deformation, so
  • 4. considering the fluid dynamics of faults will likely improve our understanding of petroleum migration (Reynolds & Lister 1987; Blanpied et al. 1992; Sibson 1994; Appold & Garven 2000; Yamaguchi et al. 2011). For example, there is abundant geological evidence, at both macroscopic and microscopic scales, that faults focus fluid flow over long periods of time but later are sealed by mechanical compac- tion and chemical reactions causing mineral precipitation (Eichhubl & Boles 2000; Caine et al. 2010; Faulkner et al. 2010). The hydrologic activity of fault zones may also depend highly on earthquakes, which in turn may induce periodic fluctuations in pore fluid pressure and fault per- meability (Evans 1992; Sibson 1994). Furthermore, large- © 2013 John Wiley & Sons Ltd Geofluids (2014) 14, 234–250 doi: 10.1111/gfl.12070 scale fault zones may affect regional hydrocarbon migration by regulating the spatial distribution of overpressure in the
  • 5. subsurface (Sperrevik et al. 2002; Fisher et al. 2003; Sork- habi & Tsuji 2005). Laboratory experiments on fractured rock show that active shear faults are more permeable than the adjacent country rock by two to three orders in magni- tude. These faults then become less permeable when deac- tivated (Aydin 2000). The mechanism of recurring fluid pressure build-up, hy- drofracturing, fluid surge, and fault sealing can also be a potential means for hydrocarbon migration (Bradley 1975; Walder & Nur 1984; Mandl & Harkness 1987). For exam- ple, field observations of brecciated rocks and hydrother- mal veins from the Stillwater fault zone in Nevada indicate that petroleum migration was not completed as one single flow event, but rather accumulation too place over many episodes of oil flow during the deformation history (Caine et al. 2010). Geochemical evidence from hydrocarbon con- densates found in the South China basin also support the notion that petroleum migration occurs simultaneously
  • 6. with episodes of hydrothermal fluid flow (Guo et al. 2011). We further hypothesize that the hydrodynamic effects of multiphase flow are more effective for long-distance trans- port, during periods of strong overpressuring associated with episodes of seismically controlled fluid flow. Episodic flow associated with large faults may also be more effective than long-term continuous or steady flow of hydrocarbons, as might be envisioned for a slowly subsiding sedimentary basin. To test this hypothesis, we conduct 2D finite ele- ment simulations for multiphase flow in geologically com- plex cross sections through a basin. We introduce two migration scenarios of continuous flow and of episodic flow, which likely account for the current distribution of hydrocarbon pools such as the Inglewood oil field. The continuous models assume constant fault permeability and fluid pressure throughout the simulation time, while those conditions are time varying in the episodic models. We first
  • 7. compared the fluid pressure, subsurface temperature, and petroleum saturations from these models and then per- formed sensitivity studies on the fault permeability and the frequency of episodic flow pulses to understand how these permeability transients might affect overall hydrocarbon migration and accumulation patterns in a faulted sedimen- tary basin. GEOLOGIC SETTING The Los Angeles (LA) basin is one of the most prolific hydrocarbon-producing areas on Earth, and it hosts histor- ically giant oil fields. From the geological survey, it was recognized that the upper Miocene formations contain organic-rich sediments and play an important role as the primary hydrocarbon source rock. Most of the hydrocar- bons were thermally matured in the central part of the basin (the central syncline area) and have migrated to the edges, which are laterally confined by regional-scale fault zones (Biddle 1991; Jeffrey et al. 1991). The Newport-
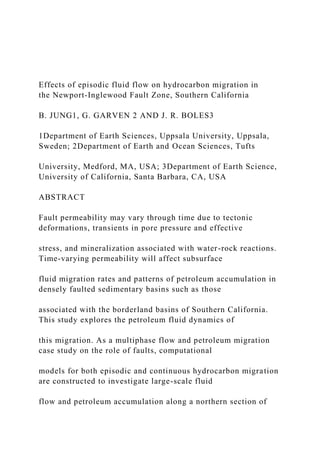
  • 8. Inglewood fault zone is one of the major regional fault sys- tems that structurally border the southwestern side of the LA basin, and numerous hydrocarbon reservoirs are closely associated with the fault structure (Fig. 1A). In the Ingle- (A) (B) Fig. 1. Faults and oil fields in the Los Angeles basin (after Wright 1991): (A) LA basin, (B) Inglewood oil field. © 2013 John Wiley & Sons Ltd, Geofluids, 14, 234–250 Effects of episodic fluid flow 235 wood oil field located on the northern part of the fault zone, the main production area exists at the intersection between the Newport-Inglewood and Sentous faults and is elongated along the trends of both faults (Fig. 1B). Geo- chemical indicators and biomarkers also suggest the hydro- carbons discovered in this area have mostly migrated approximately 10–15 km from the deep basin center with minor mixing of indigenous petroleum (Kaplan et al. 2000). Tectonic deformation and subsequent seismic activ-
  • 9. ity make this region attractive for studying the relationship between hydrocarbon migration and active fault structures in young sedimentary basins. The Newport-Inglewood fault zone consists of a series of en echelon strike slip faults that were reactivated during the late Pliocene transpressional deformation (Pasadena Orogeny) and transformed into more complicated anticline structures containing normal and reverse faults (Fig. 2). Hydrocarbon reservoirs exist in multiple sedimentary for- mations but are more concentrated in Pliocene strata con- taining a high proportion of sandstone. Many productive petroleum reservoirs align with the trend of the Newport- Inglewood fault zone, which extends and merges with the Central Basin d�ecollement at about 10 km depth (Shaw & Suppe 1996). The permeability of these sandstones ranges from 10’s to 1000’s millidarcys (10�14–10�12 m2) for sandy Plio- cene formations (Hesson & Olilang 1990). The thickness
  • 10. of sediments in the central syncline is approximately 10 km and becomes gradually thinner toward the north- ern and southwestern edges of the basin (Blake 1991; Fig. 3). Figure 4A shows an outcrop of channel-fill sand- stones (Sespe Formation) in the adjacent Santa Barbara area. The faults in these rocks are filled with carbonate mineral precipitates and lithified hydrocarbons, which is strong evidence that the fault zone provided active chan- nels for hydrocarbon fluids, but later these were sealed by subsequent reactions involving diagenetic-hydrother- mal mineralization as fluids cooled or the pressure rap- idly dropped (Fig. 4B). Five separate hydrogeologic units were considered here: middle and pper Miocene, lower and upper Pliocene, and Pleistocene formations (Fig. 3). The middle Miocene unit (Topanga Formation) consists of medium to coarse sandstones with intercalated shale layers. The upper Miocene sediments (Puente Formation) are mostly siltstone and silty sandstone with interbedded
  • 11. pelagic mudstone and shale layers (nodular shales in some areas) that contain high organic carbon contents (10–16%). This formation is often considered to be the primary source rock for petroleum generation (Jeffrey et al. 1991). The lower Pliocene unit (Repetto forma- tion) serves as a major reservoir for hydrocarbon accu- mulation. The Repetto consists of fine to coarse sandstones with interbedded siltstone and shale layers that have relatively high permeability of 10–100 md (10�14–10�13 m2) (Higgins & Chapman 1984). The geology of the upper Pliocene unit (Pico formation) is very similar to the Repetto formation, consisting of inter- bedded sandstone and siltstone, but with slightly lower permeability. The Pleistocene unit (San Pedro formation) consists of relatively uniform and highly permeable sand layers interbedded with minor gravel, silt, and shale lay- ers (Olson 1978). We propose that north–south transpressional tectonic stresses pressurized the basin continuously from the late
  • 12. Pliocene to the present. A coupled mechanism of tec- tonic loading, pore fluid pressure build-up, fault instabil- ity, and fluid flow may have induced episodic fluid flow events (Sibson 1994). Elevated effective stress and pore pressure by tectonic loading compact the sedimentary rocks during the interseismic periods, making the fault zone mechanically unstable. When ruptured, high perme- ability and low pore pressure temporarily create focused fluid flow in the fault zone. The fault stays open for a relatively short period of time due to hydromechanical compaction as the pore pressure decreases, and then sealed further by hydrothermal mineral precipitation (Fig. 5). The continuous tectonic stress and rebuilding of pore pressure cause this cycle to repeat after the fault zone becomes sealed. Field observations of petroleum and carbonate mineral deposits in other siliciclastic faults suggest an episodic nature of injected fluids (Eichhubl & Boles 2000; Garden et al. 2001), and these episodic flow
  • 13. patterns may affect the geohydrologic controls on hydro- carbon accumulation. We modeled this dynamic aspect of fault zone to understand its effects on petroleum migra- tion and entrapment. Fig. 2. Cross section of the Newport-Inglewood fault zone along the tran- sect X–X′ (courtesy of Plains Exploration and Production Company, 2008). © 2013 John Wiley & Sons Ltd, Geofluids, 14, 234–250 236 B. JUNG et al. MULTIPHASE FLOW MODEL To model petroleum migration in the basin, we need to predict fluid saturation and pressure for both the wetting phase (formation water) and nonwetting phase (oil). The governing equations for multiphase fluid flow can be derived from the fluid mass conservation equations, as written by Bear (1972): (A) (B)
  • 14. Fig. 4. Outcrop pictures of organic-rich sedimentary rocks in California: (A) channel-fill sandstones in nonmarine Sespe Formation (Oligocene) from Old San Marcos road, Santa Barbara County, CA, (B) tar-filled fault breccia in Monterey Formation at Arroyo Burro beach, Santa Barbara County, CA. Fig. 3. Lithostratigraphy of the Los Angeles basin, modified from Blake (1991). © 2013 John Wiley & Sons Ltd, Geofluids, 14, 234–250 Effects of episodic fluid flow 237 / @ðqwSwÞ @t ¼ �O � ðqwvwÞ þ qwmw ð1Þ / @ðqnSnÞ @t ¼ / @ðqnð1 � SwÞÞ @t ¼ �O � ðqnvnÞ þ qnmn ð2Þ where / is the effective porosity of a formation, and S is the saturation of the phase: the subscripts n and w denote
  • 15. the nonwetting (liquid petroleum) and wetting (water) phases, respectively. Additionally, q is mass density of the fluid, m is a source/sink term, and v is the Darcy velocity (specific discharge) of each fluid phase, expressed as fol- lows: vw ¼ �kwkðOqw � qwgÞ ð3Þ vn ¼ �knkðOqn � qngÞ ¼ �knðOqw þ Oqc � qgÞ ð4Þ where k is the intrinsic permeability tensor, p is fluid pres- sure, g is a gravitational vector (g = (0, 0, �g)), and pc is capillary pressure (pc = pn – pw). The parameter, k, is the mobility coefficient and defined by the ratio of relative per- meability (kr) and dynamic viscosity (l) as: kw ¼ krw=lw; kn ¼ krn=ln ð5Þ After a few steps of algebraic manipulation, the pressure and saturation equations can be decoupled. If slightly com- pressible fluids are assumed, the final form of average pres- sure and saturation equations can be written as follows (Geiger et al. 2004): /ct @ �P @t
  • 16. ¼ O � kfktO�P � 0:5ðkw � knÞOpc� ðkwqw þ knqnÞggþmt ð6Þ / @Sn @t ¼ O � ½fnvt � �kkfOqc þ ðpw � pnÞgg� � mt ¼ 0 ð7Þ where ct is bulk compressibility of a medium, and mt is a source/sink term. vt is the sum of water and petroleum velocites (vt = vw + vn). The average pressure �P is an arith- metic mean of the water and petroleum pressure, and f is a fractional flow coefficient that is also defined for simplicity: fw ¼ kw kt ; fn ¼ kn kt ; and �k ¼ kwkn kt ð8Þ The first, second, and third terms in the right-hand side of the pressure equation (Eq. 6) represent advection, capil-
  • 17. larity, and buoyancy flow terms, respectively. Conventional multiphase flow equations were decoupled in terms of average pressure and petroleum saturation. These equations were solved using the implicit-pressure explicit-saturation (so called ‘IMPES’) technique (Helmig 1997; Huber & Helmig 2000; Class et al. 2002; Reichen- berger et al. 2006), a technique that produces solutions faster than those requiring time-consuming nonlinear itera- tions. Solution s to the pressure and saturation equations were computed using a hybrid numerical method called FEFVM suggested by Geiger et al. (2004, 2006). This method applies a finite element method (FEM) for com- puting average pressure and then a finite volume method
  • 18. (FVM) for computing fluid saturation. A fully upwind for- mulation and total velocity diminishing (TVD) method (Harten 1997) were also used for solutions to avoid both numerical dispersion and spurious oscillation at the satura- tion front. Capillary pressure and relative permeability models devel- oped by van Genuchten (1980) were used for describing two-phase fluid–solid interaction in the porous media. The van Genuchten model has been widely used in a multiphase flow modeling and well known for providing stable numerical solutions when applying continuous capil- lary pressure functions for a whole saturation interval.
  • 19. Stress or temperature dependent parameters were not included in the numerical formulation. Petroleum density and viscosity were computed using empirical equations suggested by Glasø (1980) and Eng- land et al. (1987). Liquid petroleum density generally decreases with increasing pressure because the solubility of gaseous component increases. The dynamic viscosity of oil Fig. 5. Coupled hydromechanic and hydrother- mal processes for episodic fluid flow (as known as fault-valve mechanism), adopted from Sibson (1994). The parameter and variables: pf is fluid pressure; s is shear stress along the fault; C is the cohesive strength of the fault; ls is the sta-
  • 20. tic coefficient of rock friction, and rn is the nor- mal stress on the fault. © 2013 John Wiley & Sons Ltd, Geofluids, 14, 234–250 238 B. JUNG et al. varies between 5 9 10�4 and 5 9 10�2 Pa�s, and generally decreases exponentially with increasing temperature (Eng- land et al. 1987). Fluid properties of the formation water were obtained from a set of state equations proposed by Phillips et al. (1981, 1983) and Watson et al. (1980), which consider the effects of temperature, pressure, and salinity/NaCl concentration on water density. MODEL CONFIGURATION
  • 21. The models, in this research, are based on the cross section in Fig. 2, which illustrates the present geology of the New- port-Inglewood fault zone and associated oil fields (e.g., Inglewood oil field) along the transect X–X′ in Fig. 1B. This profile, which consists of anticline folds with heavily faulted rocks, was chosen because it represents the typical geologic settings of oil reservoirs along the NIFZ. The numerical grid was discretized into 7655 triangular ele- ments using a Delaunay triangulation method for detailed rendering of geological structures (de Berg et al. 2008; Fig. 6). The Newport-Inglewood fault zone and surround- ing areas were divided into smaller elements to increase the
  • 22. resolution of the numerical solution. Because this model is only two-dimensional, a character- istic fault length or effective flow field length was intro- duced for petroleum volume calculation. The total length of Inglewood Oil Field is about 5 km, so we assume that 20% of the total fault length (Approximately 1 km) in pro- file is available for petroleum migration. The width of fault zone in the numerical grid is approximately 50 m. Model parameters used in the simulations are listed in Table 1. Permeability and porosity of each hydrogeologic unit were obtained from several publications (Yerkes 1972; Olson 1978; Higgins & Chapman 1984; Hesson & Olilang 1990; Nishikawa et al. 2009) and chosen within the ranges
  • 23. considered to be representative for these local formations. Fault permeability was not available from any local field measurements, so it was systematically varied or dynami- cally changed as part of model parameter sensitivity analy- sis. Anisotropic permeability ratio values of up to 100:1 (kx/kz), typical for a regional-scale flow, were chosen for most formations except the Pleistocene sediments, which are known to be the most permeable and yet not fully con- solidated. A thermal dispersivity a approximately 100 m was assumed for all formations, reflecting the longitudinal solute dispersivity value for a regional groundwater flow system (de Marsily 1986; Gelhar et al. 1992). Matrix ther- mal conductivity values of 3.0 W m�1°C were assigned to
  • 24. most sandstone-dominant units and values of 2.5– 2.8 W m�1°C were assigned to the units having high con- tent of siltstone and interbedded shale (Blackwell & Steele 1989). A specific heat capacity value of 750 J kg�1°C, typi- cal of sandstone and shale, was assigned for all hydrogeo- logic units and faults (Sabins 1997). Formation of water salinity in the LA basin usually ranges from 20 000 to 34 000 ppm TDS (Hesson & Olilang 1990; California Department of Conservation 1992) for most oil fields. The groundwater salinity was set to 25 000 ppm TDS for the entire model profile. Capillary pressure in porous sandstone is generally <0.1 bar (approximately 0.01 MPa) but may increase to tens of bars in source rocks with clay grain size (Ingebrit-
  • 25. sen et al. 2006). Capillarity model parameters were chosen within the range of typical rock types obtained from other publications (Levorsen 1967; Wendebourg 1994; Bloom- field et al. 2001). Typically, the capillary pressure of more permeable formations exhibit lower values, but sharp increases occur near the irreducible water saturation point (Swr). The sum of water and petroleum relative permeabil- ity is usually less than one when both phases are mobile. Initially, hydrostatic conditions and conductive thermal profile were assumed throughout the basin. The levels of overpressure were chosen considering that the pore pres- sure in the Southern California faults may approach lithostatic pressure due to mechanical compaction (Gra-
  • 26. tier et al. 2002, 2003). The values of overpressure ratio, fault permeability, and the period of episodic flow pulses are presented in Table 2. The over pressure ratio (k*) in a sedimentary basin can be defined as follows (Wang et al. 2006) Fig. 6. Model numerical grid, boundary conditions and hydrostratigraphy of the Newport-Inglewood fault zone based on the cross section along the transect X–X’ (Fig. 1b). The upper margin is the prescribed pressure head of 200 m and the isothermal boundary condition of 4°C. The left and right margins of the grid were assigned to be hydrostatic for pressure and ther-
  • 27. mally insulated (no flow) for heat. The bottom margin were assigned as no flow and a constant temperature of 160°C. Overpressure is applied to the right end of the fault boundary (marked as a white arrow) as a prescribed pressure condition, and the petroleum saturation at this boundary is con- stant (Sn = 0.6). © 2013 John Wiley & Sons Ltd, Geofluids, 14, 234–250 Effects of episodic fluid flow 239 k� ¼ P � PF PL � PF � 100 ð9Þ
  • 28. where P is pore fluid pressure in the formation, PF is hydrostatic pressure, and PL is lithostatic pressure. Porosity of the fault also changes dynamically in the range of 0.1– 0.3, accompanying with the permeability variation. In middle Miocene to early Pleistocene, the basin is still under a shallow marine environment (Wright 1991), so the prescribed pressure head of 200 m and the isothermal boundary condition of 4°C were assigned to the top boundary of the grid. The temperature value was chosen within the ranges of estimated Miocene shallow seawater temperature (0–6°C) (Zachos et al. 2001). Boundary con- ditions along the bottom margin of the grid were assigned as no fluid flow (impermeable) and a constant temperature of 160°C, based on geothermal gradients
  • 29. reported in this area of 35–40°C km�1 (Higgins & Chap- man 1984; Jeffrey et al. 1991). The left and right mar- gins of the grid were assigned to be hydrostatic for pressure and thermally insulated for heat. Petroleum was injected through the fault boundary at the right boundary (white arrow in Fig. 6), and this condition is physically possible only when we assume that most of petroleum was generated in the deep basin center and migrated through the fault zone. CONTINUOUS FLOW MODEL First, we considered a continuous hydrocarbon migration scenario through the Newport-Inglewood fault zone, assuming a slightly overpressured sedimentary basin envi-
  • 30. ronment with constant fault zone permeability. The level of overpressure at the fault boundary (marked as a white arrow in Fig. 6) was held constant during the simulation, and the fault zone was considered as a channel for releas- ing overpressure of the basin center as well as a conduit for petroleum migration. For Model 1, the vertical fault per- meability kz was set to 10 md (10 �14 m2), which is within the range of kx for the Pliocene unit and higher than that of Upper Miocene unit. The permeability value was inferred from the fact that a fault zone may be more per- meable than its host rock, especially when the fault was ruptured by shear stresses and brecciated to include sur-
  • 31. rounding rocks (Aydin 2000). The change of fault perme- ability during deformation depends on fault rock clay content and burial history. Laboratory experimental data show permeability increasing over 2–4 orders of magnitude (Fisher & Knipe 2001). Fluid pressure gradients in a compacting sedimentary basin usually vary between hydrostatic (approximately 10.1 MPa km�1) and lithostatic pressure (approximately 23.3 MPa km�1), and the values used in the simulations Table 1 Hydrogeologic model parameters. Parameter Topanga Puente Repetto Pico San Pedro NIFZ kx, Horizontal permeability (md) 3.2 0.13 18 50 50 1–1000* kx/kz, Anisotropy 100 100 100 100 100 0.1 /, Porosity 0.16 0.17 0.23 0.33 0.30 0.20 ct, Bulk compressibility (Pa
  • 32. �1) 1 9 10�10 3 9 10�9 1 9 10�10 1 9 10�10 1 9 10�10 3 9 10�9 e, Thermal dispersivity (m) 100 100 100 100 100 100 k, Bulk thermal conductivity (W m�1°C) 3.0 2.5 2.7 2.8 2.8 3.0 c, Specific heat of matrix (J kg�1 °C) 750 750 750 750 750 750 a, van Genuchten coefficient (m�1) 3.0 9 10�4 4.0 9 10�4 2.5 9 10�3 2.0 9 10�3 2.0 9 10�3 1.0 9 10�2 n, van Genuchten coefficient 5.0 4.0 6.0 4.5 4.3 8.0 Swr, Irreducible wetting phase saturation (%) 10 18 12 12 12 12 Snr, Irreducible nonwetting phase saturation (%) 6 10 7 7 7 3 *Fault zone permeabilities are varied depending on model settings described in Table 2. Permeability and porosity values were selected within the ranges from a technical report written by the California Department of Conservation (1991) and unpublished data from Plains Exploration and Production Company. 1 md = 10�15 m2. Capillarity model parameters are obtained from publications (see the text). Table 2 Petroleum migration scenarios for the Newport- Inglewood fault zone.
  • 33. Model Scenario Overpressure ratio (%) Fault permeability (md)* Period of fluid pulse (years) Petroleum saturation 1 Continuous 10 10 0.6 2 Continuous 10 5 0.6 3 Continuous 10 20 0.6 4 Continuous 10 50 0.6 5 Episodic 10–80 1–1000 3000 0.6 6 Episodic 10–80 1–1000 2000 0.6 7 Episodic 10–80 1–1000 1000 0.6 8 Episodic 10–80 1–1000 500 0.6 *1 md = 10�15 m2. © 2013 John Wiley & Sons Ltd, Geofluids, 14, 234–250 240 B. JUNG et al. were selected based on the current LA basin fluid pressure gradient of 9.9–12.6 MPa km�1 (Berry 1973; McCulloh
  • 34. 1979). These values can be converted to �1.5 to 19.0% in overpressure ratio. These relatively low-pressure gradients, despite the high subsidence and sedimentation rates, seem to originate from the high content of coarse-grained sedi- ments that can dissipate pressure very effectively in the LA basin (Hayba & Bethke 1995). We assumed the whole domain was initially hydrostatic, and then, the lower right end of the fault on the boundary of the mesh (marked by the white arrow in Fig. 6) was set to 10% overpressure. Petroleum saturation at the inlet of the fault zone was maintained as a constant value of 0.6, which is taken from the average value of Miocene strata in the Inglewood oil field (California Department of Conser-
  • 35. vation 1992). Figure 7 illustrates the pore pressure change in terms of hydraulic head (h) of the continuous flow model, assuming a constant fault permeability of 10 md (10�14 m2) and overpressure ratio of 10% during the whole simulation time (Model 1). The overpressured areas are sustained in the lower part of the fault zone and the Miocene formations, but the Pliocene and Pleistocene formations remain largely hydrostatic (colored in white). The high pore fluid pressure change is shown in the lower part of the fault. High fluid pressure in the fault zone is confined in the Upper Mio- cene formation due to its low permeability. The pressure pattern reaches the equilibrium state approximately after
  • 36. 40 000 … 747 Bulletin of the Seismological Society of America, Vol. 94, No. 2, pp. 747–752, April 2004 Activity of the Offshore Newport–Inglewood Rose Canyon Fault Zone, Coastal Southern California, from Relocated Microseismicity by Lisa B. Grant and Peter M. Shearer Abstract An offshore zone of faulting approximately 10 km from the southern California coast connects the seismically active strike-slip Newport–Inglewood fault zone in the Los Angeles metropolitan region with the active Rose Canyon fault zone in the San Diego area. Relatively little seismicity has been recorded along the off- shore Newport–Inglewood Rose Canyon fault zone, although it
  • 37. has long been sus- pected of being seismogenic. Active low-angle thrust faults and Quaternary folds have been imaged by seismic reflection profiling along the offshore fault zone, raising the question of whether a through-going, active strike-slip fault zone exists. We applied a waveform cross-correlation algorithm to identify clusters of microseis- micity consisting of similar events. Analysis of two clusters along the offshore fault zone shows that they are associated with nearly vertical, north- northwest-striking faults, consistent with an offshore extension of the Newport– Inglewood and Rose Canyon strike-slip fault zones. P-wave polarities from a 1981 event cluster are con- sistent with a right-lateral strike-slip focal mechanism solution. Introduction The Newport–Inglewood fault zone (NIFZ) was first identified as a significant threat to southern California resi- dents in 1933 when it generated the M 6.3 Long Beach earth- quake, killing 115 people and providing motivation for pas-
  • 38. sage of the first seismic safety legislation in the United States (Barrows, 1974; Hauksson and Gross, 1991; Yeats, 2001). The Rose Canyon fault (RCF) zone in the San Diego area has ruptured several times during the Holocene (Lindvall and Rockwell, 1995) and poses significant seismic hazard to San Diego area residents (Anderson et al., 1989). An off- shore zone of faulting approximately 10 km from the south- ern California coast connects the strike-slip NIFZ in the Los Angeles metropolitan region with the strike-slip RCF zone in the San Diego area. The activity and seismic potential of the intervening offshore fault zone, herein referred to as the offshore Newport–Inglewood Rose Canyon (ONI-RC) fault zone, has been the subject of debate for decades (e.g., Hill, 1971; Barrows, 1974; Fischer and Mills, 1991; Rivero et al., 2000; Grant and Rockwell, 2002). Recent attention has fo- cused on blind thrusts that may intersect the ONI-RC fault zone and accommodate some of the regional deformation (Grant et al., 1999; Rivero et al., 2000). Interaction with the thrust system could limit the magnitude of earthquakes on strike-slip faults in the ONI-RC fault zone, if they are active. Sparse offshore microseismicity has been difficult to locate accurately (Astiz and Shearer, 2000) but has been interpreted to be associated with an active ONI-RC fault zone (Fischer and Mills, 1991). We identified, relocated, and analyzed two
  • 39. clusters of microearthquakes within the northern and central ONI-RC fault zone to examine the fault structure, minimum depth of seismic activity, and source fault mechanism. The results suggest that the ONI-RC fault zone is a steeply dip- ping, active strike-slip fault to seismogenic depths. Tectonic and Geologic Setting In southern California, tectonic deformation between the Pacific and North American plates is accommodated pri- marily by a zone of strike-slip faults (Walls et al., 1998) with maximum deformation along the San Andreas system, decreasing westward into the offshore inner Continental Borderland region (Fig. 1). The inner Continental Border- land has complex structure including low-angle detachment faults, thrust faults, and high-angle strike-slip faults resulting from late Cenozoic rifting prior to the current transpressional tectonic regime (Crouch and Suppe, 1993; Bohannon and Geist, 1998). The geometry and slip rate of faults in the inner Continental Borderland are poorly constrained relative to onshore faults (Astiz and Shearer, 2000), yet they may pose significant seismic risk because they are close to populated areas, and several offshore faults appear to displace seafloor sediments (Legg, 1991). Grant and Rockwell (2002) pro- posed that an active �300-km-long Coastal Fault zone
  • 40. (Fig. 2) extends between the Los Angeles basin (USA) and coastal Baja California (Mexico), including the NIFZ and RCF zone in southern California, the Agua Blanca fault in 748 Short Notes Figure 1. Regional fault map (modified from Grant and Rockwell [2002]; after Walls et al. [1998]) summarizing regional tectonic deformation according to slip rate on major faults, including the San Andreas fault (SAF), San Jacinto fault zone (SJFZ), Elsinore fault zone (EFZ), Whittier fault (WF), Palos Verdes fault (PVF), NIFZ near Los Angeles (LA), RCF zone (RCFZ) near San Diego (SD), Agua Blanca fault zone (ABFZ), San Miguel fault zone (SMFZ), Imperial fault (IF), Cerro Prieto fault (CPF), and Laguna Salada fault (LSF). Offshore faults of the inner Continental Borderland include the Coronado Bank fault zone (CBF), San Diego Trough fault (SDTF), San Clemente fault zone (SCFZ), Santa Cruz Island fault (SCIF), and Santa Rosa
  • 41. Island fault (SRIF). The San Gabriel fault (SGF), San Cayetano fault (SCF), Oak Ridge fault (ORF), and Santa Ynez fault (SYF) are located in the Transverse Ranges. Baja California, and contiguous offshore fault zones. The structural style and slip rates of the NIFZ and RCF zone sug- gest that the intervening ONI-RC fault zone is an active, strike-slip fault zone with complex structure and a slip rate of 0.5–2.0 mm/yr. The NIFZ has been studied extensively in the Los An- geles basin by petroleum geologists. Hill (1971) proposed that the NIFZ overlies a major tectonic boundary separating eastern continental basement facies of granitic and associ- ated metamorphic rocks from oceanic Catalina schist facies of the inner Continental Borderland province to the west. The current strike-slip faulting regime apparently reactivated a structural weakness along the Mesozoic subduction zone (Hill, 1971) and initiated right-lateral motion in the mid-to- late Pliocene (Wright, 1991; Freeman et al., 1992). The NIFZ is a structurally complex series of discontinuous strike-slip faults with associated folds and shorter normal and reverse faults (Yeats, 1973), described by Wilcox et al. (1973) and
  • 42. Harding (1973) in a set of classic papers on wrench tecton- ics. Dextral displacement of late Miocene and younger sed- iments reveals a long-term slip rate of 0.5 mm/yr (Freeman et al., 1992). Multiple surface ruptures since the early Ho- locene indicate that the minimum slip rate is at least 0.3–0.6 mm/yr and may be substantially higher (Grant et al., 1997). A Holocene slip rate of �1 mm/yr has been assumed for seismic hazard assessment (SCECWG, 1995). Seismically active strands of the NIFZ have been mapped along the west- ern margin of the Los Angeles basin between the cities of Beverly Hills and Newport Beach (Bryant, 1988; Grant et al., 1997) where the fault steps over and continues offshore parallel to the coast (Morton and Miller, 1981). The subsurface structure and tectonic history of the RCF zone have not been studied as thoroughly as the NIFZ be- cause it lacks petroleum reserves. The Holocene sense of movement and slip rate of the RCF have been investigated for seismic hazard studies. Lindvall and Rockwell (1995) Short Notes 749 Figure 2. Map shows approximate location of major strands in
  • 43. the Coastal fault zone and dates of most recent rupture. The Coastal fault zone includes the northern NIFZ near Beverly Hills (BH) (dashed), southern NIFZ (bold) near Newport Beach (NB), the ONI-RC fault zone (gray) offshore of the San Joaquin Hills (SJH) and city of Ocean- side (O), the RCF zone (bold line) between La Jolla (LJ) and San Diego, the Coronado Bank fault zone (CBF), and the Agua Blanca fault zone (ABFZ, bold). Modified from Grant and Rockwell (2002); after Grant et al. (1997), Lindvall and Rockwell (1995), and Rockwell and Murbach (1999). and Rockwell and Murbach (1999) reported that it is pri- marily a strike-slip fault zone with a slip rate of 1–2 mm/yr, although individual strands display varying amounts of dip- slip motion in combination with strike slip. Location and Structural Models of the ONI-RC Fault Zone The location of the ONI-RC fault zone has been mapped by seismic reflection profiling in shallow water along the
  • 44. inner continental margin between Newport Beach and La Jolla, north of San Diego. Fischer and Mills (1991) sum- marized the results of eight investigations between 1972 and 1988, including unpublished mapping for the nuclear gen- erating station at San Onofre. Interpretations of Fischer and Mills (1991) and prior studies disagree about the location and number of traces, but all reveal a fairly continuous zone of faulting within a few kilometers of the coastline. Fischer and Mills (1991) presented several interpretive cross sec- tions with a steeply dipping fault and flower structure sug- gestive of strike-slip motion. They described an inner and outer “thrust fault-fold complex” consisting of multiple thrust faults and thrust-generated folds associated with a positive flower structure, and they described an offshore ex- tension of the San Joaquin Hills as being dextrally offset by the ONI-RC fault zone. Grant and others (1999, 2000, 2002) reported late Quaternary and Holocene uplift of the San Joa- quin Hills inboard of the ONI-RC fault zone and suggested that seismic activity of the San Joaquin Hills blind thrust and ONI-RC fault zone are linked. Recent offshore investigations have focused on the structure and potential activity of a low-angle fault, the Oceanside thrust, and its relationship to the ONI-RC fault zone (Bohannon and Geist, 1998; Rivero et al., 2000). Riv-
  • 45. ero et al. (2000) proposed that the San Joaquin Hills blind thrust is a backthrust soling into the larger Oceanside thrust. In this model, Quaternary uplift of the San Joaquin Hills and coastline south to San Diego is associated with movement of the Oceanside thrust. They presented four potential con- figurations for thrust interaction with strike-slip faults in the ONI-RC fault zone, each leading to a different maximum magnitude estimate, based on the activity and depth of the strike-slip system. Our analysis of microseismicity helps constrain the most viable model for interaction between the Oceanside thrust and ONI-RC fault zone. Seismicity and Event Location Method No significant historic earthquakes have occurred on the ONI-RC fault zone. Scattered seismicity has been recorded along the ONI-RC fault zone (Fig. 3), although events are difficult to locate accurately due to poor station coverage (Fischer and Mills, 1991; Astiz and Shearer, 2000). With the exception of the energetic 1986 ML 5.3 Oceanside earth- quake sequence, rates of microseismicity have been low since digital waveform data became available in 1981 (Astiz and Shearer, 2000). Fischer and Mills (1991) reported that the rate of seismicity along the ONI-RC fault zone is ap-
  • 46. proximately 10 times lower than along the onshore NIFZ. Rivero et al. (2000) interpreted the 1986 Oceanside earth- quake sequence as generated by the Thirtymile Bank thrust fault, a reactivated low-angle detachment fault. Figure 3 shows microseismicity of the inner Continental Borderland between 1981 and February 2003. The earth- quake locations were computed from the archived P and S picks using the source-specific station term method of Richards-Dinger and Shearer (2000). This method improves the relative location of events within compact clusters by solving for custom station terms for subsets of the events, thus removing the biasing effects of unmodeled three- 750 Short Notes -118.0 -117.5 33.2 33.4 33.6
  • 47. 33.8 Oceanside Newport Beach A B Elsinore San Clemente Newport-Inglewood P alos Verdes 0 10 km Figure 3. Earthquakes (black dots) near the coastal cities (circles) of Newport Beach, San Cle- mente, and Oceanside, California, recorded from
  • 48. 1981 to February 2003. Black boxes indicate clusters of similar events near the ONI-RC fault zone. A 1981 cluster near Oceanside (box A) is shown in Figure 4, and a 2000 cluster near Newport Beach (box B) is shown in Figure 5. The approximate locations of the Elsinore, Newport–Inglewood, and Palos Verdes faults are also shown. -117.52 -117.51 33.26 33.27 A A' 0.0 0.4 0.8 12.0 12.5 13.0
  • 49. 13.5 Distance (km) D e p th ( km ) A A' 0.5 km0 Figure 4. The 1981 Oceanside cluster (from box A on Fig. 3) is plotted at higher resolution in map view and cross section, after relocation using differential times computed using waveform cross- correlation.
  • 50. dimensional velocity and the varying station coverage among the events. In general, this results in sharper and better-defined seismicity alignments. The method does not, however, necessarily yield improvements in the absolute lo- cations of the clusters. We obtained waveforms for these events and performed waveform cross-correlation between each event and 100 neighboring events (Shearer, 1997; Astiz et al., 2000). We then identified clusters of similar events and relocated the microearthquakes within similar event clusters using the method of Shearer (1998, 2002). On Fig- ure 3, each cluster is so compact that these appear mostly as single dots. Two of these clusters, in boxes labeled A and B in Figure 3, are associated with the ONI-RC fault zone and are the focus of this article. Results The Oceanside Cluster The most interesting cluster is from a 1981 swarm of 19 M �3.0 earthquakes approximately 10 km northwest of Oceanside. This cluster should not be confused with the more energetic 1986 ML 5.3 Oceanside earthquake sequence located much further offshore. As shown in Figure 4, the events align along a north-northwest trend about 0.5 km
  • 51. long. In cross section, the events define a nearly vertical plane between 12.5 and 13.0 km depth. The strike, dip, and location of a plane fit by these events are consistent with active strike-slip faulting on the ONI-RC fault zone. Fischer and Mills (1991) reported that the 1981 cluster represents “a direct correlation of seismicity” (p. 30) with the ONI-RC fault zone because they located the earthquakes within 0.5 km of where they mapped the Oceanside segment of the fault zone. Our relocation results support this inter- pretation by showing that the events within the cluster form a linear trend that is approximately parallel to the fault zone. Fischer and Mills (1991) also calculated a strike-slip single event first motion focal mechanism solution for an earth- quake in the 1981 cluster. We are doubtful that unique focal mechanisms can be computed for the 1981 events, given the sparse distribution of seismic stations. However, we did ex- amine composite waveform polarities from the 1981 cluster using the method of Shearer et al. (2003) and found that the polarities are consistent with a right-lateral strike-slip focal mechanism solution, aligned with the trend of the ONI-RC
  • 52. Short Notes 751 -117.870 -117.860 33.545 33.550 33.555 B B' 0.0 0.5 1.0 1.5 6 7 Distance (km) D e
  • 53. p th ( km ) B B' 0.5 km0 Figure 5. The 2000 Newport Beach cluster (from box B on Fig. 3) is plotted at higher resolution in map view and cross section, after relocation using differential times computed using waveform cross- correlation. fault zone. We cannot, however, entirely eliminate other possible focal mechanisms. The Newport Beach Cluster A cluster of seven similar microearthquakes occurred offshore of Newport Beach in 2000 at a depth of approxi-
  • 54. mately 6.5–7.0 km. The cluster is near the offshore NIFZ as mapped by Morton and Miller (1981) and compiled by Fischer and Mills (1991). In map view and cross section (Fig. 5), five of the seven events are aligned in a pattern consistent with a shallow (7 km), north-northwest-striking, vertical or steeply dipping active fault. Observed polarities for this cluster are too sparse to provide any meaningful constraint on the focal mechanisms. The location of the 2000 cluster is southwest of an area of active faulting reported by Fischer and Mills (1991) from mapping offshore of Newport Beach and the San Joaquin Hills. Fischer and Mills (1991) analyzed microseismicity from 1982 to 1990 along this zone and reported strike-slip and reverse-fault first motion solutions from a cluster of epi- centers between 2 and 2.5 km on either side of the mapped fault zone. Discussion The mean locations of each cluster are determined using a standard 1D velocity model for all of southern California and are probably not very accurate, particularly in depth. We estimate uncertainties on the absolute cluster locations as roughly �2 km in horizontal position and �5 km in depth.
  • 55. However, the relative location accuracy among events within each cluster is much better constrained, so the trends defined by the seismicity alignments should be reliable. The estimated relative location accuracy is generally less than 50 m for the events in the Oceanside cluster and less than 150 m for the aligned events in the Newport Beach cluster. The two outlying events in the Newport Beach cluster have standard errors of about 500 m; thus it is entirely possible that their true locations lie within the linear trend of the other events. The location, alignment, and apparent dip of the Ocean- side and Newport Beach clusters of microearthquakes are consistent with the presence of active, steeply dipping faults in the ONI-RC fault zone. Waveform polarities are also con- sistent with strike-slip motion, although other mechanisms cannot be ruled out. For hazard estimation of offshore faults, it is not as im- portant to precisely locate active traces as it is for onshore faults in populated areas. A more important consideration is the potential for a through-going rupture and an estimate of the maximum magnitude earthquake. Our relocated micro- seismicity is too sparse to reveal whether or not there is a through-going strike-slip fault zone. The structure of the
  • 56. ONI-RC fault zone may be similar to that of the onshore NIFZ, which contains multiple strike-slip traces. Others have mapped a fairly continuous structurally complex zone of faulting �110 km long, subparallel to and within 10 km of the coast (Fischer and Mills, 1991). The maximum magni- tude of an ONI-RC fault rupture can be estimated from the length of the fault zone. Assuming a 110-km surface rupture length of a strike-slip fault zone yields an estimated M 7.4 earthquake (Wells and Coppersmith, 1994). If strike-slip faults do not terminate the Oceanside thrust, Rivero et al. (2000) estimate an Mw 7.5 maximum magnitude earthquake could result from rupture of the entire thrust fault. The �6.5-km depth of the Newport Beach seis- micity cluster does not provide information on the geometry or interaction between the strike-slip ONI-RC fault zone and the Oceanside thrust. However, the location and �13 km depth of the Oceanside cluster suggests that the Oceanside thrust is terminated by active strike-slip faults. According to Rivero et al. (2000), this geometry would lead to an Mw 7.3 maximum magnitude earthquake on the Oceanside thrust. The maximum magnitude estimate is at the upper range of magnitude estimated for an earthquake that uplifted the San Joaquin Hills circa A.D. 1635–1769 (Grant et al., 2002).
  • 57. 752 Short Notes Acknowledgments This research was supported by the Southern California Earthquake Center. SCEC is funded by NSF Cooperative Agreement EAR- 0106924 and USGS Cooperative Agreement 02HQAG0008. The SCEC Contribution Number for this article is 746. References Anderson, J. G., T. K. Rockwell, and D. C. Agnew (1989). Past and possible future earthquakes of significance to the San Diego region, Earth- quake Spectra 5, 299–335. Astiz, L., and P. M. Shearer (2000). Earthquake locations in the inner Con-
  • 58. tinental Borderland, offshore southern California, Bull. Seism. Soc. Am. 90, 425–449. Astiz, L., P. M. Shearer, and D. C. Agnew (2000). Precise relocations and stress-change calculations for the Upland earthquake sequence in southern California, J. Geophys. Res. 105, 2937–2953. Barrows, A. G. (1974). A review of the geology and earthquake history of the Newport–Inglewood structural zone, Calif. Div. Mines Geol. Spe- cial Report 114, 115 pp. Bohannon, R. G., and E. Geist (1998). Upper crustal structure and Neogene tectonic development of the California continental borderland, Geol. Soc. Am. Bull. 110, no. 6, 779–800. Bryant, W. A. (1988). Recently active traces of the Newport– Inglewood fault zone, Los Angeles and Orange Counties, California,
  • 59. California Division of Mines and Geology, DMG OFR 88-14. Crouch, J. K., and J. Suppe (1993). Late Cenozoic tectonic evolution of the Los Angeles basin and inner California borderland: a model for core complex-like crustal extension, Geol. Soc. Am. Bull. 105, 1415–1434. Fischer, P. J., and Mills, G. I. (1991). The offshore Newport– Inglewood– Rose Canyon fault zone, California: structure, segmentation and tec- tonics, in Environmental Perils San Diego Region, P. L. Abbott and W. J. Elliot (Editors), San Diego Association of Geologists, San Di- ego, Geological Society of America Annual Meeting, 17–36. Freeman, S. T., E. G. Heath, P. D. Guptil, and J. T. Waggoner (1992). Seismic hazard assessment, Newport–Inglewood fault zone, in En- gineering Geology Practice in Southern California, B. W. Pipkin
  • 60. and R. J. Proctor (Editors), Star, Belmont, California, 211–231. Grant, L. B., and T. K. Rockwell (2002). A northward- propagating earth- quake sequence in coastal southern California? Seism. Res. Lett. 73, no. 4, 461–469. Grant, L. B., J. T. Waggoner, C. von Stein, and T. K. Rockwell (1997). Paleoseismicity of the north branch of the Newport–Inglewood fault zone in Huntington Beach, California, from cone penetrometer test data, Bull. Seism. Soc. Am. 87, 277–293. Grant, L. B., K. J. Mueller, E. M. Gath, H. Cheng, R. L. Edwards, R. Munro, and G. L. Kennedy (1999). Late Quaternary uplift and earthquake potential of the San Joaquin Hills, southern Los Angeles basin, Cali- fornia, Geology 27, 1031–1034.
  • 61. Grant, L. B., K. J. Mueller, E. M. Gath, and R. Munro (2000). Late Qua- ternary uplift and earthquake potential of the San Joaquin Hills, south- ern Los Angeles basin, California—Reply, Geology 28, 384. Grant, L. B., L. J. Ballenger, and E. E. Runnerstrom (2002). Coastal uplift of the San Joaquin Hills, southern Los Angeles Basin, California, by a large earthquake since 1635 A.D., Bull. Seism. Soc. Am. 92, no. 2, 590–599. Harding, T. P. (1973). Newport–Inglewood Trend, California: an example of wrenching style of deformation, Am. Assoc. Petrol. Geol. Bull. 57, no. 1, 97–116. Hauksson, E., and S. Gross (1991). Source parameters of the 1933 Long Beach earthquake, Bull. Seism. Soc. Am. 81, 81–98. Hill, M. L. (1971). Newport–Inglewood zone and Mesozoic
  • 62. subduction, California, Geol. Soc. Am. Bull. 82, 2957–2962. Legg, M. R. (1991). Sea Beam evidence of recent tectonic activity in the California Continental Borderland, in The Gulf and Peninsular Prov- ince of the Californias, P. Dauphin and G. Ness (Editors), American Association of Petroleum Geologists Memoir 47, 179–196. Lindvall, S. C., and T. K. Rockwell (1995). Holocene activity of the Rose Canyon fault zone in San Diego, California, J. Geophys. Res. 100, no. B12, 24,121–24,132. Morton, P. K., and R. V. Miller (1981). Geologic map of Orange County California, showing mines and mineral deposits, Calif. Div. Mines Geol. Bull. 204, plate 1, 1:48,000 scale. Richards-Dinger, K. B., and P. M. Shearer (2000). Earthquake
  • 63. locations in southern California obtained using source-specific station terms, J. Geophys Res. 105, 10,939–10,960. Rivero, C., J. H. Shaw, and K. Mueller (2000). Oceanside and Thirty-Mile Bank blind thrusts: implications for earthquake hazards in coastal southern California, Geology 28, 891–894. Rockwell, T., and M. Murbach (1999). Holocene earthquake history of the Rose Canyon fault zone: final technical report submitted for USGS Grant No. 1434-95-G-2613, 37 pp. Shearer, P. M. (1997). Improving local earthquake locations using the L1- norm and waveform cross-correlation: application to the Whittier Nar- rows, California, aftershock sequence, J. Geophys. Res. 102, 8269– 8283.
  • 64. Shearer, P. M. (1998). Evidence from a cluster of small earthquakes for a fault at 18 km depth beneath Oak Ridge, southern California, Bull. Seism. Soc. Am. 88, 1327–1336. Shearer, P. M. (2002). Parallel faults strands at 9-km depth resolved on the Imperial Fault, southern California, Geophys. Res. Lett. 29, no. 14, 1674. Shearer, P. M., J. L. Hardebeck, L. Astiz, and K. B. Richards- Dinger (2003). Analysis of similar event clusters in aftershocks of the 1994 Northridge, California, earthquake, J. Geophys Res. 108, no. B1, 2035, doi 10.1029/2001JB000685. Southern California Earthquake Center Working Group on the Probabilities of Future Large Earthquakes in Southern California (SCECWG) (1995). Seismic hazards in southern California: probable earthquakes,
  • 65. 1994–2024, Bull. Seism. Soc. Am. 85, 379–439. Walls, C., T. Rockwell, K. Mueller, Y. Bock, S. Williams, J. Pfanner, J. Dolan, and P. Feng (1998). Escape tectonics in the Los Angeles met- ropolitan region and implications for seismic risk, Nature 394, 356– 360. Wells, D. L., and K. J. Coppersmith (1994). New empirical relationships among magnitude, rupture length, rupture area, and surface displace- ment, Bull. Seism. Soc. Am. 84, 974–1002. Wilcox, R. E., T. P. Harding, and D. R. Seely (1973). Basic wrench tec- tonics, Am. Assoc. Petrol. Geol. Bull. 57, no. 1, 74–96. Wright, T. L. (1991). Structural geology and tectonic evolution of the Los Angeles basin, In Active Margin Basins, K. T. Biddle (Editor), Amer- ican Association of Petroleum Geologists Memoir 52, 35–134.
  • 66. Yeats, R. S. (1973). Newport–Inglewood fault zone, Los Angeles basin, California, Am. Assoc. Petrol. Geol. Bull. 57, no. 1, 117–135. Yeats, R. S. (2001). Living with Earthquakes in California, Oregon State University Press, Corvallis, 406 pp. Department of Environmental Health, Science, and Policy University of California Irvine, California 92697-7070 [email protected] (L.B.G.) Institute of Geophysics and Planetary Physics Scripps Institution of Oceanography University of California, San Diego La Jolla, California 92093-0225 [email protected] (P.M.S.) Manuscript received 23 July 2003.
  • 67. Student Name: Bud Benneman Geology 105 Spring 2020 Paper Outline The Newport–Inglewood fault zone (NIFZ) of southern California. I. The Newport–Inglewood fault zone (NIFZ) was first identified as a significant threat to southern California residents in 1933 when it generated the Magnitude 6.3 Long Beach Earthquake, killing 115 people. A. The Newport Inglewood fault is located in southern Los Angeles County in the city of Inglewood and transverses south to Newport Beach in Orange County where it becomes an off shore fault. B. The NIFZ then connects to the Rose Canyon Fault none, becomes a landward fault in San Diego County. C. This is a stress reliever Strike-Slip Fault Zone associated with the San Andréas Fault Zone. D. Ground water basins in Los Angeles County may be used as predictors of fault movement due to sudden changes in ground water level.
  • 68. E. In southern California, tectonic deformation between the Pacific and North American plates is accommodated primarily by a zone of strike-slip faults, II. This fault is important to the exploration of Oil. A. The NIFZ has been studied extensively in the Los Angeles basin by petroleum geologists. B. The NIFZ overlies a major tectonic boundary separating eastern continental basement rocks of granitic and associated metamorphic rocks of Santa Catalina Island schist. C. The NIFZ follows along a former Mesozoic subduction zone. D. This fault is associated with several oil basins including Newport Beach, Huntington Beach, Seal Beach, Long Beach, and Signal Hill. III. Earthquake Potential for Los Angeles, Orange and San Diego Counties. A. The epicenter for the 1933 Long Beach Quake was located in Newport Beach just south of the Santa Ana River discharge into the Pacific Ocean. B. Orange County in 1933 consisted of small farm-towns, cattle
  • 69. ranching and agricultural fields. C. The closest city of significant development was Lang Beach, which was devastated by the 1933 6,3 quake. D. Today cities of Newport Beach, Huntington Beach, Costa Mesa, are large population centers, which have replaced agriculture as the primary economic sector. E. The rate of ground water basin contraction is important in determining possible earthquake releases in the Los Angeles Basin. F. Many Orange and Los Angeles county buildings are located along high risk development zones during earthquakes. IV. Earthquake Monitoring and Prediction a. The location of the 2000 cluster is southwest of an area of active faulting from 1982 to 1990 along this zone and reported strike-slip offshore fault between Newport Beach and the San Joaquin Hills was traced from seismic activity. b. Analyzed microseismicity from a cluster of epicenters between 2 and 2.5 km along the fault zone suggest potential earthquakes of higher magnitude are possible. c. A possible 7.5 magnitude earthquake could result from rupture of the entire fault. The 6.5-km depth of the Newport
  • 70. Beach seismicity cluster does not provide information on the geometry or interaction between the strike-fault zone and Oceanside thrust faults. d. Los Angeles groundwater basin contraction could cause faults such as the Whittier E. Oil companies and water basin studies using seismic studies and human induced micro-seismic studies have identified several fault structures such as blind thrust faults in the Los Angeles basin. Blind thrust along with strike slip fault structures suggest potential earthquakes of higher magnitude are possible for the Los Angeles and Orange County basins. IV. Conclusion a. The Newport Inglewood Fault is a major stress reliever for the San Andreas Fault Zone. b. This fault zone is tied in between the North American Plate and Pacific Plates Strike Slip Zones and follows a Mesozoic Subduction zone. c. The location of the NIFZ has potential for a large magnitude earthquake due to it being sandwiched between the eastern San Andreas and Pacific Margin plate Boundary.
  • 71. Paper Outline Due Thursday April 23 Posted on GWC Blackboard 3-5-20 Announced in class and illustrated on Thursday March 5, 2020 Required: 1. Two (2) reviewed articles with a person or persons as the author. The U.S.G.S or the EPA is not a person. The last pages of your article must have a reference page. No reference page or named person or multiple authors are not acceptable. 2. Two but not more than five pages of text double or 1.5 spaced with normal margins like those in the sample outline.
  • 72. 3. Sources that are good various reviewed journals Science, Nature, Scientific American. These publications will have sources at the end with references within the text of the paper. 4. Sources to stay away from Science Direct, Geology.com, National Geographic, Newspapers, Magazines. If the article you chose has advertisements then stay away from these sources, or any with advertising ads. What to hand in. 1. Your outline as a hard copy. 2. Complete printed out copies of your sources all clipped together. 3. Must be clipped together with the outline. No folded corners on the papers as an attempt to keep them together. Use a clip.
  • 73. Failure to provide a copy of your sources along with the outline will result in a failing grade for this outline. No late assignments will be accepted. No electronic files accepted. Colton City of COMPREHENSIVE ANNUAL FINANCIAL REPORT Fiscal Year Ended June 30, 2019 City of Colton, California 650 N. La Cadena Drive, Colton, California 92324
  • 74. THIS PAGE INTENTIONALLY LEFT BLANK CITY OF COLTON, CALIFORNIA COMPREHENSIVE ANNUAL FINANCIAL REPORT WITH REPORT ON AUDIT BY INDEPENDENT CERTIFIED PUBLIC ACCOUNTANTS FOR THE YEAR ENDED JUNE 30, 2019 Prepared By: Finance Department Finance Administration Division
  • 75. THIS PAGE INTENTIONALLY LEFT BLANK CITY OF COLTON, CALIFORNIA Comprehensive Annual Financial Report For the Fiscal Year Ended June 30, 2019 Table of Contents Page Number INTRODUCTORY SECTION: Letter of Transmittal i Municipal Officials v Organization Chart vi Government Finance Officers Association Certificate vii FINANCIAL SECTION:
  • 76. Independent Auditors’ Report 1 Managements’ Discussion and Analysis (Required Supplementary Information) 5 Basic Financial Statements: Government-Wide Financial Statements: Statement of Net Position 17 Statement of Activities 18 Fund Financial Statements: Governmental Funds: Balance Sheet 20 Reconciliation of the Governmental Funds Balance Sheet to the Statement of Net Position 21 Statement of Revenues, Expenditures and Changes in Fund Balances 22 Reconciliation of the Governmental Funds Statement of Revenues, Expenditures and Changes in Fund Balances to the Statement of Activities 23 Budgetary Comparison Statement by Department - General Fund 25 Proprietary Funds:
  • 77. Statement of Net Position 26 Statement of Revenues, Expenses and Changes in Net Position 30 Statement of Cash Flows 32 Fiduciary Funds: Statement of Net Position 36 Statement of Changes in Net Position 37 Notes to Financial Statements 39 CITY OF COLTON, CALIFORNIA Comprehensive Annual Financial Report For the Fiscal Year Ended June 30, 2019 Table of Contents Page Number
  • 78. Required Supplementary Information: 87 CalPERS Pension Plans: Safety Plans: Schedule of Proportionate Share of the Net Pension Liability 88 Schedule of Contributions 89 Miscellaneous Plan: Schedule of Changes in the Net Pension Liability and Related Ratios 90 Schedule of Contributions 91 Other Post-Employment Benefits Plan: Schedule of Changes in the Total OPEB Liability and Related Ratios 92 Supplementary Information: Combining and Individual Fund Statements and Schedules: Other Governmental Funds: 93 Combining Balance Sheet 96 Combining Statement of Revenues, Expenditures and Changes in Fund Balances 102 Schedules of Revenues, Expenditures and Changes in Fund Balance - Budget and Actual:
  • 79. Gas Tax Special Revenue Fund 108 Community Child Care Special Revenue Fund 109 Library Grant Special Revenue Fund 110 Community Development Block Grant Special Revenue Fund 111 State Traffic Relief Special Revenue Fund 112 Asset Seizure Special Revenue Fund 113 Air Quality Special Revenue Fund 114 Drug/Gang Intervention Special Revenue Fund 115 Host City Fees Special Revenue Fund 116 Storm Water Special Revenue Fund 117 Local Transportation Special Revenue Fund 118 New Facilities Special Revenue Fund 119 Civic Center Development Fee Special Revenue Fund 120 Fire Facility Development Fee Special Revenue Fund 121 Police Facility Development Fee Special Revenue Fund 122 ViTep Special Revenue Fund 123 Miscellaneous Grants Special Revenue Fund 124 Housing Authority Special Revenue Fund 125 CITY OF COLTON, CALIFORNIA
  • 80. Comprehensive Annual Financial Report For the Fiscal Year Ended June 30, 2019 Table of Contents Page Number Supplementary Information (Continued): Other Governmental Funds (Continued): Schedules of Revenues, Expenditures and Changes in Fund Balance - Budget and Actual (Continued): Public Financing Authority Debt Service Fund 126 Taxable Pension Funding Bonds Debt Service Fund 127 Capital Improvements Capital Projects Fund 128 Development Fees Capital Projects Fund 129 Colton Crossing Capital Projects Fund 130 Internal Service Funds: 131 Combining Statement of Net Position 132 Combining Statement of Revenues, Expenses and Changes in Net Position 133 Combining Statement of Cash Flows 134
  • 81. Agency Funds: 135 Combining Statement of Assets and Liabilities 136 Combining Statement of Changes in Assets and Liabilities 137 Private-Purpose Trust Funds: 139 Combining Statement of Net Position 140 Combining Statement of Changes in Net Position 141 STATISTICAL SECTION: Description of Statistical Section Contents 143 Financial Trends: Net Position by Component - Last Ten Fiscal Years 145 Changes in Net Position - Last Ten Fiscal Years 146 Fund Balances of Governmental Funds - Last Ten Fiscal Years 148 Changes in Fund Balances of Governmental Funds - Last Ten Fiscal Years 150
  • 82. CITY OF COLTON, CALIFORNIA Comprehensive Annual Financial Report For the Fiscal Year Ended June 30, 2019 Table of Contents Page Number STATISTICAL SECTION (CONTINUED): Revenue Capacity: Assessed Value and Estimated Actual Value of Taxable Property - Last Ten Fiscal Years 152 Property Tax Rates - All Overlapping Governments - Last Ten Fiscal Years 153 Principal Property Tax Payers - Current and Nine Years Ago 154 Property Tax Levies and Collections - Last Ten Fiscal Years 155 Taxable Sales by Category - Last Ten Calendar Years 156 Direct and Overlapping Sales Tax Rates - Last Ten Fiscal Years 157 Top 25 Principal Sales Tax Remitters - Identified by Category
  • 83. 158 Debt Capacity: Ratios of Outstanding Debt by Type - Last Ten Fiscal Years 159 Direct and Overlapping Governmental Activities Debt - As of June 30, 2017 160 Legal Debt Margin Information - Last Ten Fiscal Years 161 Pledged-Revenue Coverage - Last Ten Fiscal Years 162 Demographic and Economic Information: Demographic and Economic Statistics - Last Ten Calendar Years 163 Top 20 Principal Employers - Current Year and Nine Years Ago 164 Operating Information: Full-Time City Government Employees by Function/Program - Last Ten Fiscal Years 165 Operating Indicators by Function/Program - Last Ten Fiscal Years 166 Capital Asset Statistics by Function/Program - Last Ten Fiscal Years 167
  • 84. INTRODUCTORY SECTION THIS PAGE INTENTIONALLY LEFT BLANK i ii
  • 85. iii Colton City of City Council Dr. Luis S. González Frank J. Navarro Mayor District 2 Kenneth Koperski Council Member District 3 District 4 District 5
  • 86. Isaac T. Suchil Council Member District 6 David J. Toro Council Member District 1 Ernest R. Cisneros Mayor Pro Tem Council Member Jack R. Woods Council Member iv C it
  • 116. FINANCIAL SECTION THIS PAGE INTENTIONALLY LEFT BLANK 2875 Michelle Drive, Suite 300 | Irvine, California 92606 | WNDECPA.com | 714.978.1300 1 INDEPENDENT AUDITORS’ REPORT
  • 117. Honorable Mayor and Members of the City Council of the City of Colton Colton, California Report on the Financial Statements We have audited the accompanying financial statements of the governmental activities, the business-type activities, each major fund and the aggregate remaining fund information of the City of Colton, California (the City), as of and for the year ended June 30, 2019, and the related notes to the financial statements, which collectively comprise the City’s basic financial statements as listed in the table of contents. Management’s Responsibility for the Financial Statements Management is responsible for the preparation and fair presentation of these financial statements in accordance with accounting principles generally accepted in the United States of America; this includes the design, implementation and maintenance of internal control relevant to the preparation and fair presentation of financial statements that are free from material misstatement, whether
  • 118. due to fraud or error. Auditors’ Responsibility Our responsibility is to express opinions on these basic financial statements based on our audit. We conducted our audit in accordance with auditing standards generally accepted in the United States of America and the standards applicable to financial audits contained in Government Auditing Standards, issued by the Comptroller General of the United States. Those standards require that we plan and perform the audit to obtain reasonable assurance about whether the basic financial statements are free from material misstatement. An audit involves performing procedures to obtain audit evidence about the amounts and disclosures in the basic financial statements. The procedures selected depend on the auditors’ judgment, including the assessment of the risks of material misstatement of the financial statements, whether due to fraud or error. In making those risk assessments, the auditors consider internal control relevant to the City’s preparation and fair presentation of the financial statements in order to design audit procedures that are appropriate in the circumstances, but not for the
  • 119. purpose of expressing an opinion on the effectiveness of the City’s internal control. Accordingly, we express no such opinion. An audit also includes evaluating the appropriateness of accounting policies used and the reasonableness of significant accounting estimates made by management, as well as evaluating the overall presentation of the financial statements. We believe that the audit evidence we have obtained is sufficient and appropriate to provide a basis for our audit opinions. 2 Opinions In our opinion, the financial statements referred to above present fairly, in all material respects, the respective financial position of the governmental activities, the business- type activities, each major fund and the aggregate remaining fund information of the City, as of June 30, 2019, and the respective changes in financial position and,
  • 120. where applicable, cash flows thereof and the budgetary comparison information for the General Fund for the year then ended in accordance with accounting principles generally accepted in the United States of America. Other Matters Required Supplementary Information Accounting principles generally accepted in the United States of America require that the management’s discussion and analysis, the CalPERS pension plans - schedule of proportionate share of the net pension liability and the schedule of contributions - safety plans, the schedule of changes in the net pension liability and related ratios and the schedule of contributions - miscellaneous plan and the other post-employment benefit plan - schedule of changes in the OPEB liability and related ratios, identified as Required Supplementary Information (RSI) in the accompanying table of contents, be presented to supplement the basic financial statements. Such information, although not a part of the basic financial statements, is required by the Governmental Accounting Standards Board, who considers it to be an essential part of financial reporting for
  • 121. placing the basic financial statements in an appropriate operational, economic, or historical context. We have applied certain limited procedures to the RSI in accordance with auditing standards generally accepted in the United States of America, which consisted of inquiries of management about the methods of preparing the information and comparing the information for consistency with management’s responses to our inquiries, the basic financial statements and other knowledge we obtained during the audit of the basic financial statements. We do not express an opinion or provide any assurance on the RSI because the limited procedures do not provide us with sufficient evidence to express an opinion or provide any assurance. Other Information Our audit was conducted for the purpose of forming opinions on the financial statements that collectively comprise the City’s basic financial statements. The introductory section, the combining and individual fund statements and schedules (supplementary information) and statistical section are presented for purposes of additional analysis and are not a required part of the basic financial statements.
  • 122. The supplementary information, as listed in the table of contents, is the responsibility of management and was derived from and relates directly to the underlying accounting and other records used to prepare the basic financial statements. Such information has been subjected to the auditing procedures applied in the audit of the basic financial statements and certain additional procedures, including comparing and reconciling such information directly to the underlying accounting and other records used to prepare the basic financial statements or to the basic financial statements themselves and other additional procedures in accordance with auditing standards generally accepted in the United States of America. In our opinion, the supplementary information is fairly stated in all material respects in relation to the basic financial statements as a whole. 3 Other Information (Continued)
  • 123. The introductory section and statistical section have not been subjected to the auditing procedures applied in the audit of the basic financial statements and, accordingly, we do not express an opinion or provide any assurance on them. Other Reporting Required by Government Auditing Standards In accordance with Government Auditing Standards, we have also issued our report dated December 19, 2019, on our consideration of the City’s internal control over financial reporting and on our tests of its compliance with certain provisions of laws, regulations, contracts and grant agreements and other matters. The purpose of that report is to describe the scope of our testing of internal control over financial reporting and compliance and the results of that testing, and not to provide an opinion on internal control over financial reporting or on compliance. That report is an integral part of an audit performed in accordance with Government Auditing Standards in considering the City’s internal control over financial reporting and compliance.
  • 124. Irvine, California December 19, 2019 4 THIS PAGE INTENTIONALLY LEFT BLANK 5 Management’s Discussion and Analysis As management of the City of Colton, California (“City”) we offer readers of the City’s financial statements this narrative
  • 125. overview and analysis of the financial activities of the City of Colton for the fiscal year ended June 30, 2019. To obtain a complete picture of the City’s financial condition, this document should be read in conjunction with the accompanying letter of transmittal and financial statements. Financial Highlights All changes in financial conditions in the following discussion are expressed relative to fiscal year 2017-18. Please note that each of these changes will be discussed in detail in the appropriate sections of this analysis. exceeded its liabilities and deferred inflows of resources at the close of the fiscal year by $120,880,240 (net position). The two components of this total are: ($6,867,489) in
  • 126. governmental activities and $127,747,729 in business-type activities. $21,604,303, or 21.7%. balance for the general fund was $6,290,763 and balances committed for the City’s pension and OPEB liabilities total $10,150,871 and $4,558,102 respectively. -term liabilities related to Governmental Activities decreased by $1,109,975 or 2.65%, while long-term liabilities related to Business-type activities decreased $4,974,049, or 7.51%, over the prior year. activities reported combined ending net position of ($6,867,489), an increase of $11,955,819 over the prior year. -term liabilities of the governmental activities and business-type activities include net
  • 127. pension liabilities of $78,046,285 and $18,883,836 respectively, which represents increases of $1,382,613, or 1.8%, and $458,846, or 2.5%, respectively. As of June 30, 2019, total long-term liabilities of the governmental activities and business-type activities include net OPEB liabilities of $25,039,289 and $5,891,597 respectively, which represents increases of $400,770, or 1.6%, and $93,403, or 1.6%, respectively. Overview of the Financial Statements This discussion and analysis is intended to serve as an introduction to the City’s basic financial statements. The City’s basic financial statements contain three components: government- wide financial statements; fund financial statements; and notes to the basic financial statements
  • 128. This report also contains supplementary information in addition to the basic financial statements. Government-wide Financial Statements. The government-wide financial statements are designed to provide readers with a broad overview of the City’s finances in a manner similar to a private sector business. These statements include all assets, deferred outflows of resources, liabilities, and deferred inflows of resources of the City using the accrual basis of accounting, which is similar to the accounting used by most private-sector companies. All of the current year’s revenues and expenses are taken into account regardless of when cash is received or paid. The statement of net position presents information on all City assets deferred outflows of resources, liabilities, and deferred inflows of resources, with the difference reported as net
  • 129. position. Over time, increases or decreases in net position may serve as a useful indicator of whether the financial position of the City is improving or deteriorating. 6 The statement of activities presents information showing how the government’s net position changed during the most recent fiscal year. All changes in net position are reported as soon as the underlying event giving rise to the change occurs regardless of the timing of related cash flows. Thus, some of the revenues and expenses reported in this statement will have no effect on cash until some future fiscal period.
  • 130. Both government-wide financial statements distinguish functions of the City that are principally supported by taxes and intergovernmental revenues (governmental activities) from functions that are intended to recover some or all of their costs through user fees and charges (business-type activities). Governmental activities. Most of the City’s basic services are reported in this category, including general administration (city manager, city clerk, finance, etc.), police and fire protection, public works and community development. Property taxes, sales tax, transient occupancy tax, user fees, interest income, franchise fees, state and federal grants, contributions from other agencies, and other revenues finance these activities. Business-type activities. The City charges a fee to customers to cover all or most of the cost of certain services it provides.
  • 131. The City’s Electric, Water and Wastewater utilities are reported in this category. The government-wide financial statements are available on pages 17-19 of this report. Fund Financial Statements. The fund financial statements provide detailed information about the individual funds, not the City as a whole. A fund is a fiscal and accounting entity with a self-balancing set of accounts that is used to keep track of specific sources of funding and spending for a particular purpose. Certain funds are required by state law and bond covenants. However, additional funds have been established to assist with controlling and managing money for particular purposes or to show that legal responsibilities for using certain taxes, grants, and other resources are being met. All of the funds of the City can be divided into three categories: governmental funds,
  • 132. proprietary funds, and fiduciary funds. Governmental funds. Most of the City’s basic services are reported in governmental funds, which focus on how money flows in and out of those funds and year-end balances that are available for spending. These funds are reported using an accounting method called modified accrual accounting, which measures cash and all other financial assets that can readily be converted to cash. The governmental fund statements provide a detailed short-term view of the City’s general government operations and the basic services it provides. Governmental fund information helps determine whether there are more or fewer financial resources that can be spent in the near future to finance the City’s programs. The differences between the results in the governmental fund financial statements to those in the government-wide financial statements are explained in a reconciliation following each governmental fund financial
  • 133. statement. In addition to the major funds reported separately on the governmental fund balance sheet and in the governmental fund statement of revenues, expenditures, and changes in fund balances, the City also maintains 18 special revenue funds, 3 capital project funds, and 2 debt service funds. Data from these funds are combined into a single, aggregated presentation referred to as other governmental funds. Individual fund data for each of these non-major governmental funds is provided in the form of combining statements after the notes section of the report. The City adopts an annual appropriated budget for all of its governmental and proprietary funds. Budgetary comparison statements have been provided for the General Fund to demonstrate compliance with this budget. This comparison is available on page 25 of this report.
  • 134. The basic governmental fund financial statements are available on pages 20-23 of this report. 7 Proprietary funds. When the City charges customers for the services it provides, these services are generally reported in proprietary funds. The City maintains two different types of proprietary funds: enterprise funds and internal service funds. Enterprise funds are used to report the same functions presented as business-type activities in the government-wide financial statements. The City uses enterprise funds to account for its Electric, Water and Wastewater activities. Internal service funds are an accounting device used to accumulate and allocate costs
  • 135. internally among the City’s various functions. The City uses an internal service fund to account for its insurance programs, information services department and facilities/equipment maintenance activities. Because these services predominantly benefit governmental rather than business-type functions, these funds have been included within governmental activities in the government-wide financial statement. Proprietary funds provide the same type of information as the government-wide financial statements with more detail. The proprietary fund financial statements provide separate information for the Electric, Water and Wastewater operations, all of which are considered major funds of the City. The City’s internal service funds combined are shown separately under the heading Governmental Activities – Internal Service Funds.
  • 136. The basic proprietary fund financial statements are available on pages 26-35 of this report. Fiduciary Funds. Fiduciary funds are used to account for resources held for the benefit of parties outside the government. Fiduciary funds are not reflected in the government-wide financial statements because the resources of these funds are not available to support the City’s programs. The accounting used for fiduciary funds is much like that used for proprietary funds. The City’s fiduciary activities are reported in a separate Statement of Fiduciary Net Position. Individual fund data for each of these fiduciary funds is provided in the form of combining statements after the notes section of the report. The City currently has two agency funds and two private-purpose trust funds. The Successor Agency of the former Redevelopment Agency (RDA) is accounted for as a private-purpose trust fund.
  • 137. The basic fiduciary fund financial statements are available on pages 36-37 of this report. Notes to the financial statements. The notes provide additional information that is essential to a full understanding of the data provided in the government-wide and fund financial statements. The Notes to the financial statements are available on pages 39-87 of this report. Required Supplementary Information. Required actuarial valuation schedules and underlying assumptions for Safety and Miscellaneous CalPERS Pension Plans and the schedule of progress for the Other Post-Employment Benefits (OPEB) Plan are contained in this section. Required Supplementary Information is available on pages 89-94 of this report.
  • 138. Other information. In addition, the combining statements referred to earlier in connection with non-major governmental funds, internal service funds and fiduciary funds are presented immediately following the notes to the financial statements. Combining and individual fund statements and schedules are available on pages 95-143 of this report. 8 GOVERNMENT-WIDE FINANCIAL ANALYSIS As referenced earlier, net position may serve over time as a useful indicator of a government’s financial position. At the end of the current year, total City assets and deferred outflows of resources exceeded liabilities and deferred inflows of resources
  • 139. by $120,880,240, an increase of $21,604,303 over the prior year. Of this net increase, governmental activities net position increased by $11,955,891 and business-type activities increased by $9,648,484. The underlying reasons for major changes in each of these components will be discussed in the following sections. Governmental Activities In the case of the City, governmental activities increased the City of Colton’s net position by $11,955,819 a 63.5% increase over the prior year. By far, the largest portion of the City’s net position is its investment in capital assets. Total assets and deferred outflows of resources for governmental activities increased $11,842,551, or 8.9%. Total assets government-wide increased by $21,943,009 as a result of increases in revenues that were complemented by a
  • 140. decrease in expenses. Total revenues increased by $2,331,673, which is attributed to increases in the property taxes, sales taxes, franchises, transient occupancy taxes, investment income, and capital gains and contributions. Declines were realized in the operating grants and contributions category for general government and transfers. Overall, the increase in revenues is a positive indicator showing stabilizing growth in the City. The City’s governmental expenses were $2,268,760 lower in comparison to the prior year. Year-over-year reductions in General Government, Public Works, and Interest on long-term debt expenditure categories offset increases in expenditures related to Public Safety and Community Services. 2019 2018 2019 2018 2019 2018 Current and Other Assets 58,008,713$ 44,190,218$ 102,264,369$ 98,515,685$ 160,273,082$ 142,705,903$
  • 141. Capital Assets 70,112,845 67,464,024 114,234,032 112,507,023 184,346,877$ 179,971,047$ Total Assets 128,121,558 111,654,242 216,498,401 211,022,708 …