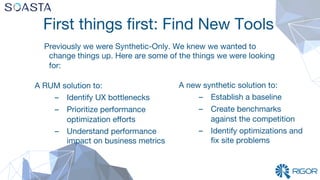
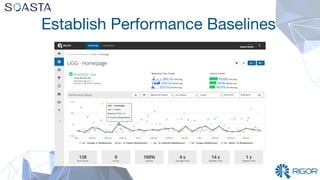
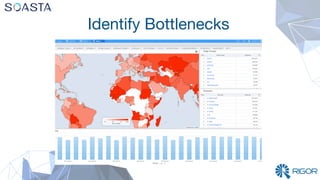
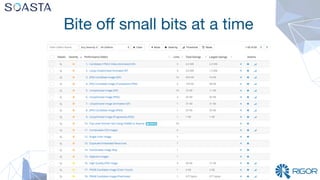
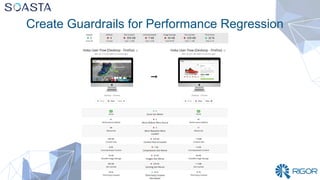
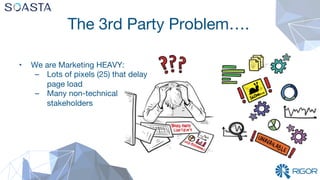
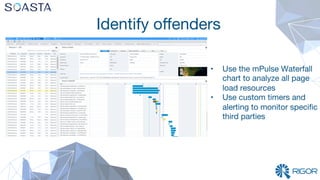
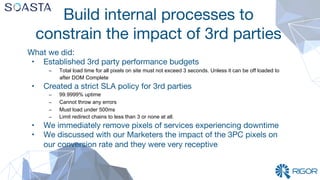
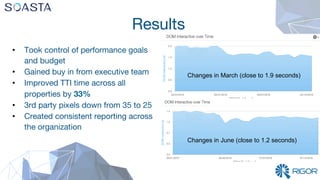
With Deckers
Proactive Strategies for Finding
and Fixing Performance Issues
Who are we?
Billy Hoffman
Director of Product at Rigor


Ryan Vila
System Engineer at SOASTA
Why are we here?
•  Performance is $$$
–  Most businesses tackle performance when
it’s too late
•  We want to teach you how to:
–  Build budgets for performance
–  Find & fix your biggest problems first
–  Enable cross-functional buy-in for
performance
–  Create processes that will prevent
performance defects from impacting your
users in the future
The real star of the show
Nick Smotek
Digital Technology Manager at
Deckers
Fun Facts:
•  13 years w/ Deckers
•  Has served as the lead dev
•  Founded the UX department
which manages performance
monitoring and optimization
The Deckers Performance Story
•  This all started with a mandate from
Management for sites to be “Faster”

•  We weren’t making much progress for a
variety of reasons…..
Legacy monitoring tools
•  Our existing toolset was:
–  Complex
–  Expensive (required consultation)
–  Had poor UX 
–  Difficult for us to gain insights
Lots of brands
With cross-functional teams
Also, what is “Faster”?
We didn’t know:
•  How fast we were
•  How fast we should be 
•  How to build performance goals that
were concrete and actionable
First things first: Find New Tools
Previously we were Synthetic-Only. We knew we wanted to
change things up. Here are some of the things we were looking
for:
A RUM solution to:
–  Identify UX bottlenecks
–  Prioritize performance
optimization efforts
–  Understand performance
impact on business metrics
A new synthetic solution to:
–  Establish a baseline
–  Create benchmarks
against the competition
–  Identify optimizations and
fix site problems
Establish Performance Baselines
Identify Bottlenecks
Then understand your 
load time distribution
Benchmark Your Competitors
Find your performance sweetspot
Use the data to create
performance budgets and goals
●  Media size budget under 700k
●  Rigor Optimization Performance
Score Goal 90 or better
●  TTI (Time to interactive)
○  Goal 1 second
●  Limit requests to under 80
●  Create goals for your synthetic
data using:
○  Synthetic Baselines
○  Competitive Benchmarks
○  RUM what-if Analysis
●  Make SMART goals:
○  Specific
○  Measurable
○  Achievable/Realistic
○  Time-bound
●  Tie real dollars to your goals
Bite off small bits at a time
Create Guardrails for Performance Regression
The 3rd Party Problem….
•  We are Marketing HEAVY:
–  Lots of pixels (25) that delay
page load 
–  Many non-technical
stakeholders
Identify offenders 
•  Use the mPulse Waterfall
chart to analyze all page
load resources
•  Use custom timers and
alerting to monitor specific
third parties
Build internal processes to 
constrain the impact of 3rd parties
What we did:
•  Established 3rd party performance budgets
–  Total load time for all pixels on site must not exceed 3 seconds. Unless it can be off loaded to
after DOM Complete
•  Created a strict SLA policy for 3rd parties
–  99.9999% uptime
–  Cannot throw any errors
–  Must load under 500ms
–  Limit redirect chains to less than 3 or none at all.
•  We immediately remove pixels of services experiencing downtime
•  We discussed with our Marketers the impact of the 3PC pixels on
our conversion rate and they were very receptive
Ensure effective communication
•  Build reports that summarize your key KPIs 
–  Send out to website stakeholders at consistent
intervals
•  Be very intentional about how you configure alerts:
–  Alerts should be meaningful, not noise
–  People quickly ignore alerts if they are constant
•  Constantly share successes!
Make web performance fun!
Create time to consistently
evaluate your progress 

We take time every month to
compile reports from Rigor
Monitoring, Rigor Optimization, and
SOASTA’s mPulse to make
recommendations to our different
teams about performance
prioritization.
What’s Next?
•  Test Earlier
•  Configure more advanced
alerting with our RUM data
•  Deep analysis of data using
SOASTA Data Science
Workbench
•  Hook performance testing into
our deployment process
Results 
Changes in March (close to 1.9 seconds)
Changes in June (close to 1.2 seconds)
•  Took control of performance goals
and budget
•  Gained buy in from executive team
•  Improved TTI time across all
properties by 33% 
•  3rd party pixels down from 35 to 25
•  Created consistent reporting across
the organization
Takeaways 
•  Performance improvement is not optional
•  Justify site improvements with ROI / What-If analysis
•  Take control of your performance budgets
•  Performance is a process
•  Set S.M.A.R.T. performance objectives
•  Take control of 3rd party SLA’s
•  Set alerts consciously
Q&A 
Download the RUM+Synthetic data sheet here:

https://www.soasta.com/wp-content/uploads/2016/07/mP-
and-rigor-data-sheet_screen3.pdf

Webinar: Proactive Strategies for Finding and Fixing Performance Issues

  • 1.
    With Deckers Proactive Strategiesfor Finding and Fixing Performance Issues
  • 2.
    Who are we? BillyHoffman Director of Product at Rigor Ryan Vila System Engineer at SOASTA
  • 3.
    Why are wehere? •  Performance is $$$ –  Most businesses tackle performance when it’s too late •  We want to teach you how to: –  Build budgets for performance –  Find & fix your biggest problems first –  Enable cross-functional buy-in for performance –  Create processes that will prevent performance defects from impacting your users in the future
  • 4.
    The real starof the show Nick Smotek Digital Technology Manager at Deckers Fun Facts: •  13 years w/ Deckers •  Has served as the lead dev •  Founded the UX department which manages performance monitoring and optimization
  • 5.
    The Deckers PerformanceStory •  This all started with a mandate from Management for sites to be “Faster” •  We weren’t making much progress for a variety of reasons…..
  • 6.
    Legacy monitoring tools • Our existing toolset was: –  Complex –  Expensive (required consultation) –  Had poor UX –  Difficult for us to gain insights
  • 7.
  • 8.
  • 9.
    Also, what is“Faster”? We didn’t know: •  How fast we were •  How fast we should be •  How to build performance goals that were concrete and actionable
  • 10.
    First things first:Find New Tools Previously we were Synthetic-Only. We knew we wanted to change things up. Here are some of the things we were looking for: A RUM solution to: –  Identify UX bottlenecks –  Prioritize performance optimization efforts –  Understand performance impact on business metrics A new synthetic solution to: –  Establish a baseline –  Create benchmarks against the competition –  Identify optimizations and fix site problems
  • 11.
  • 12.
  • 13.
    Then understand your load time distribution
  • 14.
  • 15.
  • 16.
    Use the datato create performance budgets and goals ●  Media size budget under 700k ●  Rigor Optimization Performance Score Goal 90 or better ●  TTI (Time to interactive) ○  Goal 1 second ●  Limit requests to under 80 ●  Create goals for your synthetic data using: ○  Synthetic Baselines ○  Competitive Benchmarks ○  RUM what-if Analysis ●  Make SMART goals: ○  Specific ○  Measurable ○  Achievable/Realistic ○  Time-bound ●  Tie real dollars to your goals
  • 17.
    Bite off smallbits at a time
  • 18.
    Create Guardrails forPerformance Regression
  • 19.
    The 3rd PartyProblem…. •  We are Marketing HEAVY: –  Lots of pixels (25) that delay page load –  Many non-technical stakeholders
  • 20.
    Identify offenders • Use the mPulse Waterfall chart to analyze all page load resources •  Use custom timers and alerting to monitor specific third parties
  • 21.
    Build internal processesto constrain the impact of 3rd parties What we did: •  Established 3rd party performance budgets –  Total load time for all pixels on site must not exceed 3 seconds. Unless it can be off loaded to after DOM Complete •  Created a strict SLA policy for 3rd parties –  99.9999% uptime –  Cannot throw any errors –  Must load under 500ms –  Limit redirect chains to less than 3 or none at all. •  We immediately remove pixels of services experiencing downtime •  We discussed with our Marketers the impact of the 3PC pixels on our conversion rate and they were very receptive
  • 22.
    Ensure effective communication • Build reports that summarize your key KPIs –  Send out to website stakeholders at consistent intervals •  Be very intentional about how you configure alerts: –  Alerts should be meaningful, not noise –  People quickly ignore alerts if they are constant •  Constantly share successes!
  • 23.
  • 24.
    Create time toconsistently evaluate your progress We take time every month to compile reports from Rigor Monitoring, Rigor Optimization, and SOASTA’s mPulse to make recommendations to our different teams about performance prioritization.
  • 25.
    What’s Next? •  TestEarlier •  Configure more advanced alerting with our RUM data •  Deep analysis of data using SOASTA Data Science Workbench •  Hook performance testing into our deployment process
  • 26.
    Results Changes inMarch (close to 1.9 seconds) Changes in June (close to 1.2 seconds) •  Took control of performance goals and budget •  Gained buy in from executive team •  Improved TTI time across all properties by 33% •  3rd party pixels down from 35 to 25 •  Created consistent reporting across the organization
  • 27.
    Takeaways •  Performanceimprovement is not optional •  Justify site improvements with ROI / What-If analysis •  Take control of your performance budgets •  Performance is a process •  Set S.M.A.R.T. performance objectives •  Take control of 3rd party SLA’s •  Set alerts consciously
  • 28.
    Q&A Download theRUM+Synthetic data sheet here: https://www.soasta.com/wp-content/uploads/2016/07/mP- and-rigor-data-sheet_screen3.pdf