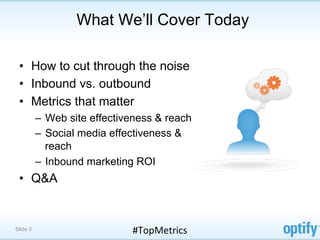
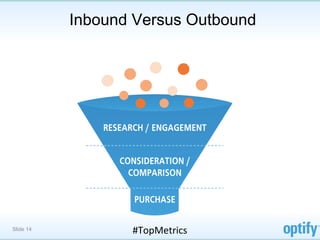
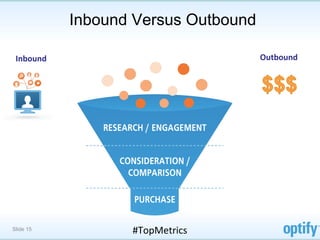
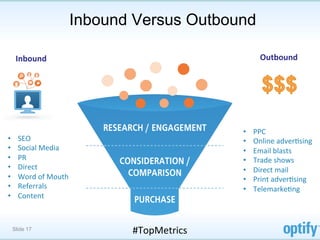
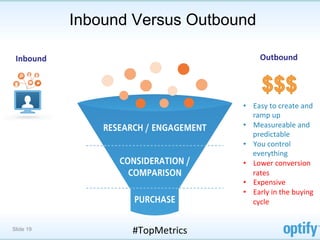
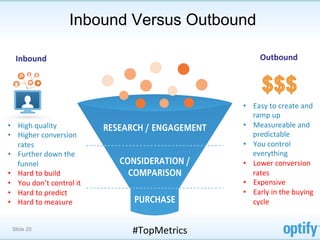
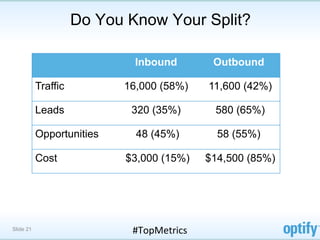
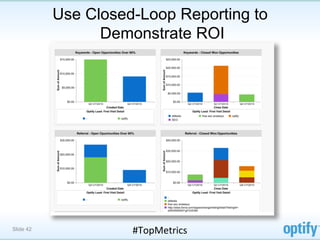
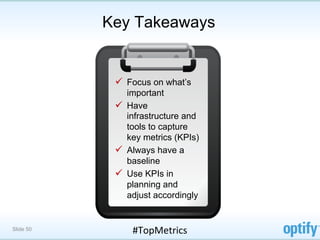
Top Inbound Metrics for B2B
         Marketers
            Speaker:

            Uri	
  Bar-­‐Joseph	
  
            Director	
  of	
  MarkeFng,	
  OpFfy	
  

            Wednesday	
  	
  August	
  22,	
  2012	
  
            1pm	
  ET	
  (10am	
  PT)	
  

            Follow	
  on	
  Twi)er:	
  #TopMetrics	


          #TopMetrics	
  
Uri Bar-Joseph

  Uri	
  Bar-­‐Joseph	
  is	
  Director	
  of	
  MarkeFng	
  at	
  OpFfy,	
  
  with	
  deep	
  experFze	
  in	
  tracking	
  and	
  analyzing	
  the	
  
  inbound	
  markeFng	
  metrics	
  that	
  maMer	
  most	
  to	
  B2B	
  
  marketers.	


  As	
  well	
  as	
  being	
  responsible	
  for	
  reporFng	
  on	
  OpFfy’s	
  
  internal	
  markeFng	
  metrics,	
  Uri	
  works	
  closely	
  with	
  
  the	
  product	
  development	
  team	
  to	
  ensure	
  that	
  the	
  
  OpFfy	
  product	
  meets	
  the	
  closed-­‐loop	
  reporFng	
  
  needs	
  of	
  professional	
  B2B	
  marketers.	


  Follow	
  Uri	
  on	
  TwiMer:	
  @uribarjoseph	


Slide 2                                         #TopMetrics	
  
What We’ll Cover Today

 •  How to cut through the noise
 •  Inbound vs. outbound
 •  Metrics that matter
          –  Web site effectiveness & reach
          –  Social media effectiveness &
             reach
          –  Inbound marketing ROI
 •  Q&A


Slide 3                       #TopMetrics	
  
What’s The Next Number in the Sequence?


     •  49, 36, 25, 16, 9, 4, ?


Slide 4                  #TopMetrics	
  
100 Ways To Measure Social Media
by David Berkowitz, 360i
1.     Volume of consumer-created buzz 28.            Subscriptions (RSS, podcasts, video 49.       Time spent with distributed content 75.      Customers assisted
       for a brand based on number of                 series)                                50.    Time spent on site through social       76.  Savings per customer assisted
       posts                                   29.    Pageviews (for blogs, microsites,             media referrals                              through direct social media
2.     Amount of buzz based on number of              etc)                                   51.    Method of content discovery (search,         interactions compared to other
       impressions                             30.    Effective CPM based on spend per              pass-along, discovery engines, etc)          channels (e.g., call centers, in-store)
3.     Shift in buzz over time                        impressions received                   52.    Clicks                                  77.  Savings generated by enabling
4.     Buzz by time of day / daypart           31.    Change in search engine rankings 53.          Percentage of traffic generated from         customers to connect with each
5.     Seasonality of buzz                            for the site linked to through social                                                      other
                                                                                                    earned media
6.     Competitive buzz                               media                                  54.    View-throughs                           78.  Impact on first contact resolution
                                               32.    Change in search engine share of 55.                                                       (FCR) (hat tip to Forrester Research
7.     Buzz by category / topic                                                                     Number of interactions                       for that one)
                                                      voice for all social sites promoting
8.     Buzz by social channel (forums,                the brand                              56.    Interaction/engagement rate             79.  Customer satisfaction
       social networks, blogs, Twitter, etc) 33.      Increase in searches due to social 57.        Frequency of social interactions per 80.     Volume of customer feedback
9.     Buzz by stage in purchase funnel               activity                                      consumer                                     generated
       (e.g., researching vs. completing       34.    Percentage of buzz containing links 58.       Percentage of videos viewed             81.  Research & development time saved
       transaction vs. post-purchase)                                                        59.    Polls taken / votes received                 based on feedback from social
10.    Asset popularity (e.g., if several      35.    Links ranked by influence of
                                                      publishers                             60.    Brand association                            media
       videos are available to embed, which                                                                                                 82.  Suggestions implemented from
       is used more)                           36.    Percentage of buzz containing          61.    Purchase consideration
                                                      multimedia (images, video, audio) 62.         Number of user-generated                     social feedback
11.    Mainstream media mentions
                                               37.    Share of voice on social sites when           submissions received                    83.  Costs saved from not spending on
12.    Fans                                                                                                                                      traditional research
                                                      running earned and paid media in       63.    Exposures of virtual gifts
13.    Followers                                      same environment                                                                      84.  Impact on online sales
14.    Friends                                                                               64.    Number of virtual gifts given
                                               38.    Influence of consumers reached         65.    Relative popularity of content          85.  Impact on offline sales
15.    Growth rate of fans, followers, and 39.        Influence of publishers reached (e.g.,66.                                             86.  Discount redemption rate
       friends                                                                                      Tags added
                                                      blogs)
16.    Rate of virality / pass-along           40.    Influence of brands participating in 67.      Attributes of tags (e.g., how well they 87.  Impact on other offline behavior
                                                                                                                                                 (e.g., TV tune-in)
17.    Change in virality rates over time             social channels                               match the brand's perception of
                                                                                                    itself)                                 88.  Leads generated
18.    Second-degree reach (connections 41.           Demographics of target audience        68.    Registrations from third-party social 89.    Products sampled
       to fans, followers, and friends                engaged with social channels                  logins (e.g., Facebook Connect,         90.  Visits to store locator pages
       exposed - by people or impressions) 42.        Demographics of audience reached              Twitter OAuth)                          91.  Conversion change due to user
19.    Embeds / Installs                              through social media                   69.    Registrations by channel (e.g., Web,         ratings, reviews
20.    Downloads                               43.    Social media habits/interests of              desktop application, mobile             92.  Rate of customer/visitor retention
21.    Uploads                                        target audience                               application, SMS, etc)                  93.  Impact on customer lifetime value
22.    User-initiated views (e.g., for videos) 44.    Geography of participating             70.    Contest entries                         94.  Customer acquisition / retention
23.    Ratio of embeds or favoriting to               consumers                              71.    Number of chat room participants
                                               45.    Sentiment by volume of posts                                                               costs through social media
       views                                                                                 72.    Wiki contributors                       95.  Change in market share
24.    Likes / favorites                       46.    Sentiment by volume of impressions
                                                                                             73.    Impact of offline marketing/events on 96.    Earned media's impact on results
25.    Comments                                47.    Shift in sentiment before, during, and        social marketing programs or buzz
                                                      after social marketing programs                                                            from paid media
26.    Ratings                                                                               74.    User-generated content created that 97.      Responses to socially posted events

                                                                             #TopMetrics	
  
27.    Social bookmarks                        48.    Languages spoken by participating             can be used by the marketer in other 98. 
      Slide 5                                         consumers                                     channels                                     Attendance generated at in-person
                                                                                                                                                 events
                                                                                                                                            99.  Employees reached (for internal
Slide 6   #TopMetrics	
  
Slide 7   #TopMetrics	
  
Slide 8   #TopMetrics	
  
Slide 9   #TopMetrics	
  
What’s the Next Number in the Sequence?


      •  849, 856, 863, 870, ?


Slide 10                 #TopMetrics	
  
Marketing-Sales Funnel


Slide 11          #TopMetrics	
  
Marketing-Sales Funnel


                                    Effec5veness	


Slide 12          #TopMetrics	
  
Marketing-Sales Funnel

                                     Reach	


                                    Effec5veness	


Slide 13          #TopMetrics	
  
Inbound Versus Outbound


Slide 14          #TopMetrics	
  
Inbound Versus Outbound

 Inbound	
                               Outbound	


Slide 15              #TopMetrics	
  
Inbound Versus Outbound

      Inbound	
                                        Outbound	


•      SEO	
  
•      Social	
  Media	
  
•      PR	
  
•      Direct	
  
•      Word	
  of	
  Mouth	
  
•      Referrals	
  
•      Content	


     Slide 16                       #TopMetrics	
  
Inbound Versus Outbound

      Inbound	
                                              Outbound	


                                                      •    PPC	
  
•      SEO	
                                          •    Online	
  adverFsing	
  
•      Social	
  Media	
                              •    Email	
  blasts	
  
•      PR	
                                           •    Trade	
  shows	
  
•      Direct	
                                       •    Direct	
  mail	
  
•      Word	
  of	
  Mouth	
                          •    Print	
  adverFsing	
  
•      Referrals	
                                    •    TelemarkeFng	
  
•      Content	


     Slide 17                       #TopMetrics	
  
Inbound Versus Outbound

 Inbound	
                               Outbound	


Slide 18              #TopMetrics	
  
Inbound Versus Outbound

 Inbound	
                                      Outbound	


                                        •  Easy	
  to	
  create	
  and	
  
                                           ramp	
  up	
  
                                        •  Measureable	
  and	
  
                                           predictable	
  
                                        •  You	
  control	
  
                                           everything	
  
                                        •  Lower	
  conversion	
  
                                           rates	
  
                                        •  Expensive	
  
                                        •  Early	
  in	
  the	
  buying	
  
                                           cycle	


Slide 19              #TopMetrics	
  
Inbound Versus Outbound

   Inbound	
                                                     Outbound	


                                                         •  Easy	
  to	
  create	
  and	
  
                                                            ramp	
  up	
  
•  High	
  quality	
                                     •  Measureable	
  and	
  
•  Higher	
  conversion	
                                   predictable	
  
   rates	
                                               •  You	
  control	
  
•  Further	
  down	
  the	
                                 everything	
  
   funnel	
                                              •  Lower	
  conversion	
  
•  Hard	
  to	
  build	
                                    rates	
  
•  You	
  don’t	
  control	
  it	
                       •  Expensive	
  
•  Hard	
  to	
  predict	
                               •  Early	
  in	
  the	
  buying	
  
•  Hard	
  to	
  measure	
                                  cycle	


  Slide 20                             #TopMetrics	
  
Do You Know Your Split?

                             Inbound            Outbound

           Traffic         16,000 (58%)        11,600 (42%)

           Leads             320 (35%)          580 (65%)

           Opportunities     48 (45%)            58 (55%)

           Cost             $3,000 (15%)       $14,500 (85%)


Slide 21                     #TopMetrics	
  
Effectiveness


Slide 22     #TopMetrics	
  
Your Website Has to be Great


Slide 23            #TopMetrics	
  
Top Website Effectiveness Metrics
  Conversion rate

           Leads

    Opportunities

      (and visits)

     By Channel


Slide 24               #TopMetrics	
  
Top Social Media Effectiveness Metrics
   Conversion rate

           Leads

     Opportunities

       (and visits)

  By Social Channel

     By Campaign


Slide 25              #TopMetrics	
  
Important Website Effectiveness Indicators

 Lead conversion
   rate trends
     Time on site

     Page views

     Bounce rate

 Returning visitors


Slide 26              #TopMetrics	
  
Write the Next Number in its Original Form


      •  1, 2, 4, 8, 16, 32, ?


Slide 27                   #TopMetrics	
  
Reach
      “the total number of different people or households
      exposed, at least once, to a medium during a given
      period.”


Slide 28                    #TopMetrics	
  
Top Website Reach Metrics
Visits by referring keywords

           Total visits

      Visits per keyword

     Number of keywords


 Visits by referring domains

Media / blogs – driven by PR
           efforts

 Directories / listing services

            Partners


Slide 29                          #TopMetrics	
  
Website Reach Indicators
  # inbound links and
       domains

Brand mentions (Google
       alerts)

     Keyword ranking


Slide 30                 #TopMetrics	
  
WHAT ABOUT SOCIAL MEDIA?


Slide 31           #TopMetrics	
  
Marketers Have Embraced Social Media


Slide 32                #TopMetrics	
  
And the Majority Use it to Drive
              Awareness & Exposure


Slide 33               #TopMetrics	
  
But They Still Struggle to Track Things
         Important to Management


Slide 34          #TopMetrics	
  
Social Media Reach Metrics


# followers / fans / members

 # tweets, re-tweets, mentions

             # likes

           # comments


Slide 35                         #TopMetrics	
  
What To Track and Measure
             Effectiveness                              Reach

     How well you get potential         how far you your message travels
     prospects to become customers      to get to your potential prospects

             Conversion rates                     Visits from referrals

               Opportunities                        Inbound Links

                  Leads                             Keyword ranks

                 Visitors
                                             # followers / fans / members

                                             # tweets, re-tweets, mentions


Slide 36                        #TopMetrics	
  
Slide 37   #TopMetrics	
  
What’s the Next Number in the Sequence?


      •  0, 1, 3, 6, 10, 15, 21, 28, 36, 45, 55, 66, ?


Slide 38                  #TopMetrics	
  
INBOUND MARKETING ROI

Slide 39           #TopMetrics	
  
(Gain	
  from	
  Investment	
  –	
  Cost	
  of	
  Investment)	
  

                             Cost	
  of	
  Investment	


Slide 40           #TopMetrics	
  
What Cost Items Should You Include?

•  PR firm fees
•  Content
   development
   costs –
   employees and
   contractors
•  SEO costs –
   employees and
   contractors
•  Don’t forget time


Slide 41               #TopMetrics	
  
Use Closed-Loop Reporting to
                 Demonstrate ROI


Slide 42             #TopMetrics	
  
Start With Your Goal
     September Plan            Opportunities


Slide 43               #TopMetrics	
  
Work Your Way Back
     September   Visitors   Conversion   Leads   Conversion   Opportunities
     Plan                   rate                 Rate


Slide 44                       #TopMetrics	
  
Identify the Drivers
     September   Visitors   Conversion   Leads     Conversion   Opportunities
     Plan                   rate                   Rate
     Organic
     Social
     Media
     Referrals
     Direct
     Total


Slide 45                         #TopMetrics	
  
Add the KPI’s
 September   Budget   Visitors   Conversion   Leads   Conversion   Opportunities   Cost per
 Plan                            rate                 Rate                         Opportunity
 Organic
 Social
 Media
 Referrals
 Direct
 Total


Slide 46                               #TopMetrics	
  
Fill In the Gaps
September   Budget    Visitors    Conversion    Leads      Conversion   Opp’s   Cost per
Plan                              rate                     Rate                 Opportunity
Organic     $8,000    10,000      7%            700        15%          105     $76.19
Social
Media       $4,000    20,000      5%            1,000      7%           70      $57.14
Referrals   N/A       5,000       3%            150        5%           8       N/A
Direct      N/A       25,000      1%            250        13%          32      N/A
Total       $12,000   60,000      3.5%          2,100      10.3%        215     $55.18


Slide 47                                 #TopMetrics	
  
Make Decisions
September   Budget    Visitors    Conversion    Leads      Conversion   Opp’s   Cost per
Plan                              rate                     Rate                 Opportunity
Organic     $8,000    10,000      7%            700        15%          105     $76.19
Social
Media       $4,000    20,000      5%            1,000      7%           70      $57.14
Referrals   N/A       5,000       3%            150        5%           8       N/A
Direct      N/A       25,000      1%            250        13%          32      N/A
Total       $12,000   60,000      3.5%          2,100      10.3%        215     $55.18


        •  Double down on Social Media
        •  See if possible to increase visits from Organic
        •  Fix conversion rates from referrals


Slide 48                                 #TopMetrics	
  
What’s the Next Number in the Sequence?


      •  2, 3, 5…401, 409, 419, 421, 431, 433, ?


Slide 49                #TopMetrics	
  
Key Takeaways


            ü  Focus on what’s
                important
            ü  Have
                infrastructure and
                tools to capture
                key metrics (KPIs)
            ü  Always have a
                baseline
            ü  Use KPIs in
                planning and
                adjust accordingly


Slide 50        #TopMetrics	
  
Put all the Numbers from the Previous Questions
                    in Order
      •  49, 36, 25, 16, 9, 4, 1
         7 2, 6 2, 5 2, 4 2, 3 2, 2 2, 1 2
      •  849, 856, 863, 870, 800
             +7 +7 +7 +7
      •  1, 2, 4, 8, 16, 32, 64 = 26
         2 0, 2 1, 2 2, 2 3, 2 4, 2 5, 2 6
      •  0, 1, 3, 6, 10, 15, 21, 28, 36, 45, 55, 66, 78
         +1 +2 +3 +4 +5 +6 +7 +8 +9 +10 +11 +12
      •  2, 3, 5…401, 409, 419, 421, 431, 433, 439
         Prime numbers
      •  1 800 26 78 439 = 1-877-2-OPTIFY

Slide 51                     #TopMetrics	
  
About Optify


Slide 52     #TopMetrics	
  
www.op5fy.net	
  
           1	
  (206)	
  388-­‐4234	
  (phone)	
  
           1	
  (877)	
  2-­‐OPTIFY	
  (toll-­‐free)	


           Uri	
  Bar-­‐Joseph,	
  Director	
  of	
  Marke5ng,	
  Op5fy	


  @uribarjoseph	


  www.linkedin.com/in/uribarjoseph	


Slide 53          #TopMetrics	
  

How to Measure Inbound Markerting

  • 1.
    Top Inbound Metricsfor B2B Marketers Speaker: Uri  Bar-­‐Joseph   Director  of  MarkeFng,  OpFfy   Wednesday    August  22,  2012   1pm  ET  (10am  PT)   Follow  on  Twi)er:  #TopMetrics   #TopMetrics  
  • 2.
    Uri Bar-Joseph Uri  Bar-­‐Joseph  is  Director  of  MarkeFng  at  OpFfy,   with  deep  experFze  in  tracking  and  analyzing  the   inbound  markeFng  metrics  that  maMer  most  to  B2B   marketers.       As  well  as  being  responsible  for  reporFng  on  OpFfy’s   internal  markeFng  metrics,  Uri  works  closely  with   the  product  development  team  to  ensure  that  the   OpFfy  product  meets  the  closed-­‐loop  reporFng   needs  of  professional  B2B  marketers.         Follow  Uri  on  TwiMer:  @uribarjoseph   Slide 2 #TopMetrics  
  • 3.
    What We’ll CoverToday •  How to cut through the noise •  Inbound vs. outbound •  Metrics that matter –  Web site effectiveness & reach –  Social media effectiveness & reach –  Inbound marketing ROI •  Q&A Slide 3 #TopMetrics  
  • 4.
    What’s The NextNumber in the Sequence? •  49, 36, 25, 16, 9, 4, ? Slide 4 #TopMetrics  
  • 5.
    100 Ways ToMeasure Social Media by David Berkowitz, 360i 1.  Volume of consumer-created buzz 28.  Subscriptions (RSS, podcasts, video 49.  Time spent with distributed content 75.  Customers assisted for a brand based on number of series) 50.  Time spent on site through social 76.  Savings per customer assisted posts 29.  Pageviews (for blogs, microsites, media referrals through direct social media 2.  Amount of buzz based on number of etc) 51.  Method of content discovery (search, interactions compared to other impressions 30.  Effective CPM based on spend per pass-along, discovery engines, etc) channels (e.g., call centers, in-store) 3.  Shift in buzz over time impressions received 52.  Clicks 77.  Savings generated by enabling 4.  Buzz by time of day / daypart 31.  Change in search engine rankings 53.  Percentage of traffic generated from customers to connect with each 5.  Seasonality of buzz for the site linked to through social other earned media 6.  Competitive buzz media 54.  View-throughs 78.  Impact on first contact resolution 32.  Change in search engine share of 55.  (FCR) (hat tip to Forrester Research 7.  Buzz by category / topic Number of interactions for that one) voice for all social sites promoting 8.  Buzz by social channel (forums, the brand 56.  Interaction/engagement rate 79.  Customer satisfaction social networks, blogs, Twitter, etc) 33.  Increase in searches due to social 57.  Frequency of social interactions per 80.  Volume of customer feedback 9.  Buzz by stage in purchase funnel activity consumer generated (e.g., researching vs. completing 34.  Percentage of buzz containing links 58.  Percentage of videos viewed 81.  Research & development time saved transaction vs. post-purchase) 59.  Polls taken / votes received based on feedback from social 10.  Asset popularity (e.g., if several 35.  Links ranked by influence of publishers 60.  Brand association media videos are available to embed, which 82.  Suggestions implemented from is used more) 36.  Percentage of buzz containing 61.  Purchase consideration multimedia (images, video, audio) 62.  Number of user-generated social feedback 11.  Mainstream media mentions 37.  Share of voice on social sites when submissions received 83.  Costs saved from not spending on 12.  Fans traditional research running earned and paid media in 63.  Exposures of virtual gifts 13.  Followers same environment 84.  Impact on online sales 14.  Friends 64.  Number of virtual gifts given 38.  Influence of consumers reached 65.  Relative popularity of content 85.  Impact on offline sales 15.  Growth rate of fans, followers, and 39.  Influence of publishers reached (e.g.,66.  86.  Discount redemption rate friends Tags added blogs) 16.  Rate of virality / pass-along 40.  Influence of brands participating in 67.  Attributes of tags (e.g., how well they 87.  Impact on other offline behavior (e.g., TV tune-in) 17.  Change in virality rates over time social channels match the brand's perception of itself) 88.  Leads generated 18.  Second-degree reach (connections 41.  Demographics of target audience 68.  Registrations from third-party social 89.  Products sampled to fans, followers, and friends engaged with social channels logins (e.g., Facebook Connect, 90.  Visits to store locator pages exposed - by people or impressions) 42.  Demographics of audience reached Twitter OAuth) 91.  Conversion change due to user 19.  Embeds / Installs through social media 69.  Registrations by channel (e.g., Web, ratings, reviews 20.  Downloads 43.  Social media habits/interests of desktop application, mobile 92.  Rate of customer/visitor retention 21.  Uploads target audience application, SMS, etc) 93.  Impact on customer lifetime value 22.  User-initiated views (e.g., for videos) 44.  Geography of participating 70.  Contest entries 94.  Customer acquisition / retention 23.  Ratio of embeds or favoriting to consumers 71.  Number of chat room participants 45.  Sentiment by volume of posts costs through social media views 72.  Wiki contributors 95.  Change in market share 24.  Likes / favorites 46.  Sentiment by volume of impressions 73.  Impact of offline marketing/events on 96.  Earned media's impact on results 25.  Comments 47.  Shift in sentiment before, during, and social marketing programs or buzz after social marketing programs from paid media 26.  Ratings 74.  User-generated content created that 97.  Responses to socially posted events #TopMetrics   27.  Social bookmarks 48.  Languages spoken by participating can be used by the marketer in other 98.  Slide 5 consumers channels Attendance generated at in-person events 99.  Employees reached (for internal
  • 6.
    Slide 6 #TopMetrics  
  • 7.
    Slide 7 #TopMetrics  
  • 8.
    Slide 8 #TopMetrics  
  • 9.
    Slide 9 #TopMetrics  
  • 10.
    What’s the NextNumber in the Sequence? •  849, 856, 863, 870, ? Slide 10 #TopMetrics  
  • 11.
  • 12.
    Marketing-Sales Funnel Effec5veness   Slide 12 #TopMetrics  
  • 13.
    Marketing-Sales Funnel Reach   Effec5veness   Slide 13 #TopMetrics  
  • 14.
  • 15.
    Inbound Versus Outbound Inbound   Outbound   Slide 15 #TopMetrics  
  • 16.
    Inbound Versus Outbound Inbound   Outbound   •  SEO   •  Social  Media   •  PR   •  Direct   •  Word  of  Mouth   •  Referrals   •  Content   Slide 16 #TopMetrics  
  • 17.
    Inbound Versus Outbound Inbound   Outbound   •  PPC   •  SEO   •  Online  adverFsing   •  Social  Media   •  Email  blasts   •  PR   •  Trade  shows   •  Direct   •  Direct  mail   •  Word  of  Mouth   •  Print  adverFsing   •  Referrals   •  TelemarkeFng   •  Content   Slide 17 #TopMetrics  
  • 18.
    Inbound Versus Outbound Inbound   Outbound   Slide 18 #TopMetrics  
  • 19.
    Inbound Versus Outbound Inbound   Outbound   •  Easy  to  create  and   ramp  up   •  Measureable  and   predictable   •  You  control   everything   •  Lower  conversion   rates   •  Expensive   •  Early  in  the  buying   cycle   Slide 19 #TopMetrics  
  • 20.
    Inbound Versus Outbound Inbound   Outbound   •  Easy  to  create  and   ramp  up   •  High  quality   •  Measureable  and   •  Higher  conversion   predictable   rates   •  You  control   •  Further  down  the   everything   funnel   •  Lower  conversion   •  Hard  to  build   rates   •  You  don’t  control  it   •  Expensive   •  Hard  to  predict   •  Early  in  the  buying   •  Hard  to  measure   cycle   Slide 20 #TopMetrics  
  • 21.
    Do You KnowYour Split? Inbound Outbound Traffic 16,000 (58%) 11,600 (42%) Leads 320 (35%) 580 (65%) Opportunities 48 (45%) 58 (55%) Cost $3,000 (15%) $14,500 (85%) Slide 21 #TopMetrics  
  • 22.
  • 23.
    Your Website Hasto be Great Slide 23 #TopMetrics  
  • 24.
    Top Website EffectivenessMetrics Conversion rate Leads Opportunities (and visits) By Channel Slide 24 #TopMetrics  
  • 25.
    Top Social MediaEffectiveness Metrics Conversion rate Leads Opportunities (and visits) By Social Channel By Campaign Slide 25 #TopMetrics  
  • 26.
    Important Website EffectivenessIndicators Lead conversion rate trends Time on site Page views Bounce rate Returning visitors Slide 26 #TopMetrics  
  • 27.
    Write the NextNumber in its Original Form •  1, 2, 4, 8, 16, 32, ? Slide 27 #TopMetrics  
  • 28.
    Reach “the total number of different people or households exposed, at least once, to a medium during a given period.” Slide 28 #TopMetrics  
  • 29.
    Top Website ReachMetrics Visits by referring keywords Total visits Visits per keyword Number of keywords Visits by referring domains Media / blogs – driven by PR efforts Directories / listing services Partners Slide 29 #TopMetrics  
  • 30.
    Website Reach Indicators # inbound links and domains Brand mentions (Google alerts) Keyword ranking Slide 30 #TopMetrics  
  • 31.
    WHAT ABOUT SOCIALMEDIA? Slide 31 #TopMetrics  
  • 32.
    Marketers Have EmbracedSocial Media Slide 32 #TopMetrics  
  • 33.
    And the MajorityUse it to Drive Awareness & Exposure Slide 33 #TopMetrics  
  • 34.
    But They StillStruggle to Track Things Important to Management Slide 34 #TopMetrics  
  • 35.
    Social Media ReachMetrics # followers / fans / members # tweets, re-tweets, mentions # likes # comments Slide 35 #TopMetrics  
  • 36.
    What To Trackand Measure Effectiveness Reach How well you get potential how far you your message travels prospects to become customers to get to your potential prospects Conversion rates Visits from referrals Opportunities Inbound Links Leads Keyword ranks Visitors # followers / fans / members # tweets, re-tweets, mentions Slide 36 #TopMetrics  
  • 37.
    Slide 37 #TopMetrics  
  • 38.
    What’s the NextNumber in the Sequence? •  0, 1, 3, 6, 10, 15, 21, 28, 36, 45, 55, 66, ? Slide 38 #TopMetrics  
  • 39.
    INBOUND MARKETING ROI Slide39 #TopMetrics  
  • 40.
    (Gain  from  Investment  –  Cost  of  Investment)   Cost  of  Investment   Slide 40 #TopMetrics  
  • 41.
    What Cost ItemsShould You Include? •  PR firm fees •  Content development costs – employees and contractors •  SEO costs – employees and contractors •  Don’t forget time Slide 41 #TopMetrics  
  • 42.
    Use Closed-Loop Reportingto Demonstrate ROI Slide 42 #TopMetrics  
  • 43.
    Start With YourGoal September Plan Opportunities Slide 43 #TopMetrics  
  • 44.
    Work Your WayBack September Visitors Conversion Leads Conversion Opportunities Plan rate Rate Slide 44 #TopMetrics  
  • 45.
    Identify the Drivers September Visitors Conversion Leads Conversion Opportunities Plan rate Rate Organic Social Media Referrals Direct Total Slide 45 #TopMetrics  
  • 46.
    Add the KPI’s September Budget Visitors Conversion Leads Conversion Opportunities Cost per Plan rate Rate Opportunity Organic Social Media Referrals Direct Total Slide 46 #TopMetrics  
  • 47.
    Fill In theGaps September Budget Visitors Conversion Leads Conversion Opp’s Cost per Plan rate Rate Opportunity Organic $8,000 10,000 7% 700 15% 105 $76.19 Social Media $4,000 20,000 5% 1,000 7% 70 $57.14 Referrals N/A 5,000 3% 150 5% 8 N/A Direct N/A 25,000 1% 250 13% 32 N/A Total $12,000 60,000 3.5% 2,100 10.3% 215 $55.18 Slide 47 #TopMetrics  
  • 48.
    Make Decisions September Budget Visitors Conversion Leads Conversion Opp’s Cost per Plan rate Rate Opportunity Organic $8,000 10,000 7% 700 15% 105 $76.19 Social Media $4,000 20,000 5% 1,000 7% 70 $57.14 Referrals N/A 5,000 3% 150 5% 8 N/A Direct N/A 25,000 1% 250 13% 32 N/A Total $12,000 60,000 3.5% 2,100 10.3% 215 $55.18 •  Double down on Social Media •  See if possible to increase visits from Organic •  Fix conversion rates from referrals Slide 48 #TopMetrics  
  • 49.
    What’s the NextNumber in the Sequence? •  2, 3, 5…401, 409, 419, 421, 431, 433, ? Slide 49 #TopMetrics  
  • 50.
    Key Takeaways ü  Focus on what’s important ü  Have infrastructure and tools to capture key metrics (KPIs) ü  Always have a baseline ü  Use KPIs in planning and adjust accordingly Slide 50 #TopMetrics  
  • 51.
    Put all theNumbers from the Previous Questions in Order •  49, 36, 25, 16, 9, 4, 1 7 2, 6 2, 5 2, 4 2, 3 2, 2 2, 1 2 •  849, 856, 863, 870, 800 +7 +7 +7 +7 •  1, 2, 4, 8, 16, 32, 64 = 26 2 0, 2 1, 2 2, 2 3, 2 4, 2 5, 2 6 •  0, 1, 3, 6, 10, 15, 21, 28, 36, 45, 55, 66, 78 +1 +2 +3 +4 +5 +6 +7 +8 +9 +10 +11 +12 •  2, 3, 5…401, 409, 419, 421, 431, 433, 439 Prime numbers •  1 800 26 78 439 = 1-877-2-OPTIFY Slide 51 #TopMetrics  
  • 52.
    About Optify Slide 52 #TopMetrics  
  • 53.
    www.op5fy.net   1  (206)  388-­‐4234  (phone)   1  (877)  2-­‐OPTIFY  (toll-­‐free)     Uri  Bar-­‐Joseph,  Director  of  Marke5ng,  Op5fy                    @uribarjoseph                      www.linkedin.com/in/uribarjoseph   Slide 53 #TopMetrics