Future climate scenarios for kenyan tea farmers presentation
•
2 likes•1,469 views


Recommended
Recommended
More Related Content
Similar to Future climate scenarios for kenyan tea farmers presentation
Similar to Future climate scenarios for kenyan tea farmers presentation (20)
More from Decision and Policy Analysis Program
More from Decision and Policy Analysis Program (20)
Recently uploaded
Recently uploaded (20)
Future climate scenarios for kenyan tea farmers presentation
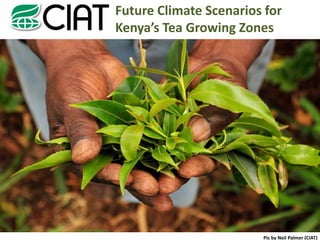
- 1. Future Climate Scenarios for Kenya’s Tea Growing Zones Pic by Neil Palmer (CIAT)
- 2. International Center for Tropical Agriculture • CIAT: Part of Consultative Group on International Agriculture Research • Mission: To reduce hunger and poverty, and improve human health in the tropics through research aimed at increasing the eco-efficiency of agriculture. What we do: Site-Specific-Management, Impact monitoring, Market research, Ecosystem services (DAPA), climate change (CCAFS), Plant breeding (CIAT), … Project-Team: Dr. Peter Laderach, A. Eitzinger, A. Quiroga, J. Gordon, A. Pantoja
- 3. Content • A: Project background • B: Research questions • C: Methodology • D: Results of analysis in Kenya – Climate change summary of tea production sites – Suitability maps of tea production areas – Environmental factors driving change in suitability – Potential diversification strategies • E: Conclusions
- 4. Project background A The objectives of this study is to develop future climate scenarios indicating the adaptability/suitability of tea under changing climatic conditions for Kenya’s tea growing zones, and indicating potentials for alternative crops suitable under predicted climate change scenarios. ETP and GIZ aim to increase Kenyan tea producers’ resilience to climate change to secure their future livelihoods and make these livelihoods more environmentally and economically sustainable. In order to achieve this, the two partners have formed a 3-year Public Private Partnership which will train approximately 10,000 vulnerable Kenyan farmers on the most appropriate adaptation techniques
- 5. Research questions B • Where will tea grow in the future? • Where will tea not grow any more? • Where can tea still grow with adapted mgt? • What are the decisive factors to manage? Pics by Neil Palmer (CIAT)
- 6. Methodology C • Current climate from historical climate generation Global circulation models as future climate Suitability prediction
- 7. Current climate C WorldClim (www.worldclim.org) database (Hijmans et al, 2005) • Base line for climate change calculations • Meteorological Stations with data of: • Worldwide: precipitation: 47,554 Mean temp.: 24,542 Min/max temp: 14,835 • For Kenya: Precipitation: 736 Mean temp.: 708 Min/max temp: 61
- 8. Current climate: Bioclimatic variables C • Bio1 = Annual mean temperature • Bio2 = Mean diurnal range (Mean of monthly (max temp - min temp)) • Bio3 = Isothermality (Bio2/Bio7) (* 100) • Bio4 = Temperature seasonality (standard deviation *100) • Bio5 = Maximum temperature of warmest month • Bio6 = Minimum temperature of coldest month • Bio7 = Temperature Annual Range (Bio5 – Bi06) • Bio8 = Mean Temperature of Wettest Quarter • Bio9 = Mean Temperature of Driest Quarter • Bio10 = Mean Temperature of Warmest Quarter • Bio11 = Mean Temperature of Coldest Quarter • Bio12 = Annual Precipitation • Bio13 = Precipitation of Wettest Month • Bio14 = Precipitation of Driest Month • Bio15 = Precipitation Seasonality (Coefficient of Variation) • Bio16 = Precipitation of Wettest Quarter • Bio17 = Precipitation of Driest Quarter • Bio18 = Precipitation of Warmest Quarter • Bio19 = Precipitation of Coldest Quarter
- 9. Future climate C • Global circulation models (GCM) Calibrated in the past (using time-series) and projected to the future >> UNCERTAINTY Emission scenarios = Political uncertainty Global Circulation Models = Scientific uncertainty • Intergovernmental Panel on Climate Change - IPCC (http://www.ipcc.ch/) Fourth Assessment Report, based on the results of 21 global climate models (GCMs)
- 10. Future climate: Global circulation models (GCM) C Model Country Atmosphere Ocean BCCR-BCM2.0 Norway T63, L31 1.5x0.5, L35 CCCMA-CGCM3.1 (T47) Canada T47 (3.75x3.75), L31 1.85x1.85, L29 CCCMA-CGCM3.1 (T63) Canada T63 (2.8x2.8), L31 1.4x0.94, L29 CNRM-CM3 France T63 (2.8x2.8), L45 1.875x(0.5-2), L31 CSIRO-Mk3.0 Australia T63, L18 1.875x0.84, L31 CSIRO-Mk3.5 Australia T63, L18 1.875x0.84, L31 GFDL-CM2.0 USA 2.5x2.0, L24 1.0x(1/3-1), L50 GFDL-CM2.1 USA 2.5x2.0, L24 1.0x(1/3-1), L50 GISS-AOM USA 4x3, L12 4x3, L16 GISS-MODEL-EH USA 5x4, L20 5x4, L13 GISS-MODEL-ER USA 5x4, L20 5x4, L13 IAP-FGOALS1.0-G China 2.8x2.8, L26 1x1, L16 INGV-ECHAM4 Italy T42, L19 2x(0.5-2), L31 INM-CM3.0 Russia 5x4, L21 2.5x2, L33 IPSL-CM4 France 2.5x3.75, L19 2x(1-2), L30 MIROC3.2-HIRES Japan T106, L56 0.28x0.19, L47 MIROC3.2-MEDRES Japan T42, L20 1.4x(0.5-1.4), L43 MIUB-ECHO-G Germany/Korea T30, L19 T42, L20 MPI-ECHAM5 Germany T63, L32 1x1, L41 MRI-CGCM2.3.2A Japan T42, L30 2.5x(0.5-2.0) NCAR-CCSM3.0 USA T85L26, 1.4x1.4 1x(0.27-1), L40 NCAR-PCM1 USA T42 (2.8x2.8), L18 1x(0.27-1), L40 UKMO-HADCM3 UK 3.75x2.5, L19 1.25x1.25, L20 UKMO-HADGEM1 UK 1.875x1.25, L38 1.25x1.25, L20
- 11. Future climate: Downscaling of GCM C • Delta (Hay et al. 2007) – Base climate: WORLDCLIM, Used in most studies of CC. – Take original GCM surfaces (time series) – Calculate averages for baseline & specific periods – Calculate anomalies – Interpolate anomalies – Add anomalies to WORLDCLIM
- 12. Suitability prediction: tea C • Finding the probability distribution of maximum entropy (MAXENT) Current climate Future climate Key of investigation 19 bioclim variables Prediction of MAXENT is generally considered to Future be the most accurate model (Elith et Evidence data of evidence of al. 2006) and was selected for the Tea cultivation tea cultivation analyses of the present study after an initial iteration of analysis in the study region using all four models.
- 13. Suitability prediction: alternative crops C • A mechanistic model to spatially predict crop suitability (ECOCROP) Current Suitability Future Suitability 2050 Change in Suitability to Future Climate (2050) Ecocrop Database (FAO) Precipitation (Food and Agriculture Organization of the UN) Ranges: Temperature and precipitation Calibration with optimal points Calibrated • Samples (GPS points) Temperature and • Altitude range Precipitación • Current Production Areas Ranges! • Soil types WorldClim Climate Data http://worldclim.org More than 47,000 stations worldwide Temperature
- 14. The process C • Compilation of evidence data (by partner) • Generation of future climates • MaxEnt / Ecocrop: Future suitability predictions for each model – 3 measurements of uncertainty to exclude outliers: • agreement among models as percentage of models predicting changes in the same direction • mean suitability: upper and lower 95% confidence intervals (C.I.) • the coefficient of variation (CV) among models. – Final run with confirming models • Prediction of future tea/crop distribution. • Identification of decisive growth factors. – Stepwise regression of suitability-shift per data point
- 15. Climate change summary of all study sites D • The annual rainfall increases from 1658 millimeters to 1732 millimeters in 2050 • Temperatures increase and the average increase is 2.3 ºC passing through an increment of 1.0 ºC in 2020 • The maximum temperature of the year increases from 26.6°C to 29°C in 2050 • The minimum temperature of the year increases from 8.9°C to 11.1°C in 2050
- 16. Regional changes in the mean annual precipitation D • In 2020 the municipalities Meru and Nithi will have larger increase in precipitation • In 2050 Kisii and Nyamira will have the largest increase in precipitation
- 17. Regional changes in the mean annual temperature D • The increase by 2020 is between 0.7 and 0.9 ºC • The increase by 2050 is between 2.1 and 2.2 ºC The mean annual temperature will increase progressively
- 18. Current suitability of tea production areas D According to the MAXENT model, the most suitable of them are concentrated in the higher areas of districts: Meru, Embu, Kirinyaga, Nyeri, Murangá, Kiambu, Kisii, Nyamira, Kericho, Bomet, Narok, Migori and Homa Bay
- 19. Future suitability of tea production areas: 2020 D In 2020 suitable areas start shifting but the average suitability in all districts remain nearly constant
- 20. Future suitability of tea production areas: 2050 D In 2050 tea production according to its climate-suitability is predicted to be more concentrated in Central Kenya
- 21. Suitability change of tea production areas D • Areas near Nandi suitability of tea shows a slight decrease by 2020 • Some areas, especially in Central region and some parts of Rift valley are gaining suitability • In 2050 tea growing areas decreases quite seriously in the western parts • Areas around Mount Kenya still remain on high suitability to climate in 2050 • General shift to higher altitudes • Most significant loss of suitability (up to -40%) can be observed in Nandi district
- 22. Relation of suitability & altitude D • With progressive climate change, areas at higher altitudes benefit on tea-suitability • Optimum tea-producing zone is currently at an altitude between 1500 and 2100 masl • By 2050: – suitability will increase to an altitude between 2000 and 2300 masl – areas at altitudes between 1400 and 2000 masl will suffer the highest decrease in suitability – areas around 2300 masl the highest increase in suitability
- 23. Measure of agreement of models D Measure of agreement of models predicting changes in the same direction as the average of all models at a given location Measure of agreement of models predicting changes in the same direction as the average of all models at a given location
- 24. Coefficient of variance of bioclimatic variables D CV for 2020 and 2050 bioclimatic variables ranges between 0 and 15%, even lower for tea-growing areas and may therefore be accepted as reliable
- 25. Suitability driving environmental factors D • Stepwise regression for 2050 suitability-decreasing sites
- 26. Suitability driving environmental factors D • Stepwise regression for 2050 suitability-increasing sites
- 27. Identification of potential diversification strategies D Coffee performs similar (even worse) to tea and would not be a good alternative crop to tea. While on 42% of all tea factory sites suitability of tea is predicted to be much less for 2050, on 97% of these sites suitability of coffee will be also much less, for more than 90% of these sites maize and cabbage will remain constant and pea will be much more suitable on 97% of this sites. Passion- fruit will be much more suitable on 51% of this sites and banana on 14% of these sites more suitable for 2050.
- 28. 2050 Change of suitability of diversification crops D Coffee Maize Pea Cabbage Banana Passion-fruit
- 29. Conclusions E • In Kenya the yearly and monthly rainfall will increase and the yearly and monthly minimum and maximum temperatures will increase by 2020 and progressively increase by 2050. • The implications are that the distribution of suitability’s within the current tea-growing areas in Kenya for tea production in general will decrease quite seriously by 2050. • The optimum tea-producing zone is currently at an altitude between 1500 and 2100 masl and will by 2050 increase to an altitude between 2000 and 2300 masl. • Compared with today, by 2050 areas at altitudes between 1400 and 2000 masl will suffer the highest decrease in suitability and the areas around 2300 masl the highest increase in suitability. • A comparison of potential diversification crops recommended by the project show that coffee perform similar to tea and would not be a good alternative crop. For more than 90% of these sites maize and cabbage will remain constant and pea will be much more suitable on 97% of this sites. Passion fruit will be much more suitable on 51% of this sites and banana on 14% of these sites more suitable for 2050.
- 30. Future Climate Scenarios for Kenya’s Tea Growing Zones Thank you!