SlideShare a Scribd company logo
How to Calculate Product Costs for a
Manufacturer
Businesses that manufacture products must determine how to calculate
their product costs. Because most businesses produce multiple products,
their accounting systems must be very complex and detailed to keep
accurate track of all direct and indirect (allocated) manufacturing costs.
The basic equation for calculating product cost is as follows (using the
example of the manufacturer given in the figure below):
$91,200,000 total manufacturing costs ÷ 120,000 units production
output
= $760 product cost per unit
The equation shown above looks pretty straightforward, doesn’t it? Well,
the equation itself may be simple, but the accuracy of the results depends
directly on the accuracy of your manufacturing cost numbers. The business
example shown in the image manufactures one product. Even so, a single
manufacturing process can be fairly complex, with hundreds or thousands
of steps and operations.
Example for determining the product cost of a manufacturer.
In the example, the business manufactured 120,000 units and sold 110,000
units during the year, and its product cost per unit is $760. The 110,000
total units sold during the year is multiplied by the $760 product cost to
compute the $83.6 million cost of goods sold expense, which is deducted
against the company’s revenue from selling 110,000 units during the year.
The company’s total manufacturing costs for the year were $91.2 million,
which is $7.6 million more than the cost of goods sold expense. The
remainder of the total annual manufacturing costs is recorded as an
increase in the company’s inventory asset account, to recognize that
10,000 units manufactured this year are awaiting sale in the future
. In the figure, note that the $760 product cost per unit is applied both to the
110,000 units sold and to the 10,000 units added to inventory.
The product cost per unit for the example business is determined for the
entire year. In actual practice, manufacturers calculate their product costs
monthly or quarterly. The computation process is the same, but the
frequency of doing the computation varies from business to business.
Product costs likely will vary each successive period the costs are
determined. Because the product costs vary from period to period, the
business must choose which cost of goods sold and inventory cost method
to use. (If product cost happened to remain absolutely flat and constant
period to period, the different methods would yield the same results.)
To reduce and eliminate costs in a business, you need to know the
formulas that are most often used in cost accounting. When you
understand and use these foundational formulas, you’ll be able to analyze
a product’s price and increase profits.
Breakeven Formula
Profit ($0) = sales – variable costs – fixed costs
Target Net Income
Target net income = sales – variable costs – fixed costs
Gross Margin
Gross margin = sale price – cost of sales (material and labor)
Contribution Margin
Contribution margin = sales – variable costs
Pre-Tax Dollars Needed for Purchase
Pre-tax dollars needed for purchase = cost of item ÷ (1 - tax rate)
Price Variance
Price variance = (actual price - budgeted price) × (actual units sold)
Efficiency Variance
Efficiency variance = (Actual quantity – budgeted quantity) × (standard
price or rate)
Variable Overhead Variance
Variable overhead variance = spending variance + efficiency variance
Ending Inventory
Ending inventory = beginning inventory + purchases – cost of sales
Important Terms and Principles Cost Accountants Should Know
Many accountants will tell you that cost accounting is the most difficult
accounting subject to learn. That's because cost accounting has many
terms that are not used in other areas of accounting (financial accounting
and management accounting, to name a few). If you're looking for an
overview of the most important terms and principles for this subject, you've
found it! These concepts provide a foundation for learning cost accounting.
Reviewing accounting basics
Accountants use many principles to guide their decision-making process,
such as the matching principle and the principle of conservatism.
• Matching principle: This principle states that your company’s
revenue should be matched with the expenses that relate to that
revenue. If you sell lamps in May, you create revenue for that month. The
May revenue should be matched with the expenses you incurred for the
lamps sold in May. So, the cost of the lamp is matched with the sales
proceeds for the lamp’s sale.
• Principle of conservatism: Accountants often need to make
judgments.Conservatism means that the decision should generate the
least attractive financial result. If there’s a decision about revenue, the
conservative choice is to delay recognizing revenue in the financial
statements. Expenses should be posted to the financial statements
sooner rather than later. These choices generate financial statements
that are less optimistic, which is why the approach is called conservative.
There are four basic types of cost that accountants need to keep in mind —
direct, indirect, fixed, and variable costs. They are defined as follows:
• Direct costs: Direct costs can be directly traced to the product.
Material and labor costs are good examples.
• Indirect costs: These can’t be directly traced to the product; instead,
these costs are allocated, based on some level of activity. For example,
overhead costs are considered indirect costs.
• Fixed costs: Fixed costs don’t vary with the level of production. A
good example is a lease on a building.
• Variable costs: Unlike fixed costs, variable costs change with the
level of production. For example, material used in production is a variable
cost.
Every cost can be defined with two of these four costs. For example, the
cost to repair machinery is an indirect variable cost. You decide if the cost
is direct or indirect, and if the cost is fixed or variable.
Checking out cost accounting basics
Just like in any discipline, you use specific cost accounting terms and ideas
to communicate meaning and understand procedures. Understanding basic
concepts in crucial, so to start using cost accounting analysis, you should
be familiar with these terms:
• Contribution margin: This term is defined as sales minus variable
cost. When you subtract your fixed costs from contribution margin, the
amount left over is your profit.
• Breakeven point formula: The breakeven point is the level of sales
where your profit is zero. The breakeven formula is sales minus variable
cost minus fixed cost. You multiply your sales per unit by units sold. You
also multiply the variable cost per unit by the same units sold. The sales
level that makes the formula equal to zero is the breakeven point.
• Relevant range: Relevant range is a term that relates to machinery,
equipment, or vehicles in your business. Think of relevant range as the
maximum level of use for the item you operate in your business. Say you
use a sewing machine. As long as you operate the machine at or below
the relevant range, it should operate normally. The machine’s cost should
come in at the level you expect. If you operate above the relevant range,
the machine won’t operate as you expect. You need to invest in a second
machine to operate above the relevant range.
Digging deeper into cost accounting analysis
As you further your study, you use more complex cost analysis tools. From
job costing to variances, the more involved the job, the more involved your
cost accounting tools become. Here are some important tools you’ll use:
• Job costing: This method of costing assumes that every customer
job is different. Plumbers and carpenters are good examples of
businesses that use cost accounting. Because every job is different, each
customer job is assigned material, labor, and overhead costs.
• Process costing: Companies use process costing when partially
completed units are moved from one production area to another. Process
costing assumes that the products you produce are similar or even
identical.
• Activity-based costing (ABC): ABC costing can be used for both
job costing and process costing analysis. You use ABC costing to assign
costs to your product more specifically. ABC costing analyzes
the activities that cause you to incur costs; you then connect the cost to
the activity.
• Variance: A variance is a difference between your planned or
budgeted cost and your actual results. A favorable variance occurs when
your actual costs are less than your budgeted or planned cost. An
unfavorable variance is when actual costs are higher than planned.
• Inventoriable costs: These are costs that are directly related to the
product. Production costs are inventoriable costs for a manufacturer. If
you are a retailer, your cost to purchase inventory is also an
inventoriable. Other costs you incur for goods are included, such as
shipping and storage costs.
Avoiding Pitfalls on Cost Accounting Exams
Cost accounting is a great tool to improve the profitability in any business.
It’s a critical subject that accounting students need to learn to be successful
in their careers. However, some cost accounting concepts are easily
misunderstood and therefore difficult to address correctly on exams. These
test-taking strategies will help you succeed on a cost accounting exam by
clarifying what is truly being asked in each question.
Read the last sentence first. Cost accounting questions often provide lots of
data, but not all of that information is needed to answer the question. Test
item writers refer to that data asdistractors. If you start at the top and read
down, you read a lot of unneeded data. Read the last sentence first. That
strategy gets you to what the question is truly asking. Then you can read
the rest of the question — and pull out only the data you need to answer
the question.
• Absorption costing vs. variable costing: The only difference
between these two costing methods is how they address fixed
manufacturing costs. A typical question on this topic lists variable
manufacturing costs, or fixed selling and administrative costs. Don’t be
fooled! Absorption and variable costing treat these other costs in the
same way, so ignore them.
• Favorable vs. unfavorable variances: Of course, the
word favorablemeans better or preferred. However, in cost accounting,
favorable has a different meaning, depending on whether you’re talking
about a cost or revenue. Less actual costs than budgeted is a favorable
variance. However,more actual revenue than planned is a favorable
variance. In both cases, your actual profit is more than planned.
Unfavorable variances are the reverse: More actual costs and less actual
revenue is unfavorable.
• Production costs: Many cost accounting questions relate to
production of a physical product (rather than a service). Make sure you’re
clear on whether the question is asking about units of a product, or an
amount of material needed per unit. For example, one bicycle (one unit)
requires two wheels. Be clear on which item (units or wheels) you’re
using when you calculate costs.
• Total fixed costs vs. fixed costs per unit: Some cost accounting
questions provide you with a fixed cost per unit. If you determine that you
need fixed costs to answer the question, pause for a minute. Try to
find totalfixed costs in the question and use that number. Fixed costs per
unit should be avoided. That’s because, at some point, you sell enough
to cover your costs. As a result, the additional units you produce don’t
have any fixed costs attached to them. Fixed cost per unit is misleading.
• Process costing: Process costing questions often address how
costs move from one production department to another. Keep in mind
that, almost always, material costs are put into production before labor
costs. If you’re making leather baseball gloves, you need material
(leather) in production before you can do anything to it (cut, sew, treat the
leather, and so on). If you keep that in mind, computing material and
labor costs may be easier.
How to Determine Cost of Goods Manufactured
By Mark P. Holtzman from Managerial Accounting For Dummies
Cost of goods manufactured is based on the amount of work-in-process
completed. This work-in-process includes costs of direct materials put into
production, plus direct labor and overhead.
To determine work-in-process, you enter the number of units or costs into
the same outputs formula that you use to calculate direct materials put into
production.
Number of units manufactured
Knowing how many units of direct materials each finished product requires
helps you figure out how many units you manufacture and how much those
units cost. For example, to make one gallon of chocolate milk, you need
0.950 gallons of whole milk and 0.05 gallons of chocolate syrup.
To compute the number of units manufactured, start with the number of
units of work-in-process in beginning inventory (Beginning). Add the
number of units of direct materials put into production (Inputs) and then
subtract the number of units of work-in-process in ending inventory
(Outputs).
Suppose that your chocolate milk factory started the year with 200 gallons
of unmixed ingredients in the blenders. During the year, another 4,000
gallons of ingredients were taken out of storage and poured into the
blenders. At the end of the year, 300 gallons of unmixed ingredients were
still in the blenders (planned for production next year). Plug these numbers
into the outputs formula:
The factory completed 3,900 gallons of chocolate milk during the period.
From here, you’re ready to figure out the total cost of chocolate milk
manufactured and its cost per unit.
Cost of goods manufactured
Direct materials, direct labor, and overhead all get input into the production
process. Therefore, to compute the cost of goods manufactured, think
about all product costs, including not only direct materials but also direct
labor and overhead.
Consider the cost of goods manufactured for the chocolate milk factory.
Your beginning inventory cost $2,000. The factory put $10,000 worth of
direct materials into production and spent $5,000 on direct labor and
another $4,000 on overhead. At the end of the year, you counted $3,000
worth of ending inventory. Feeling overwhelmed? Hang in there! To
compute cost of goods manufactured, just apply the outputs formula:
This result tells you that the factory’s output of chocolate milk during the
year cost $18,000.
How to Compute Direct Materials Put into
Production
By Mark P. Holtzman from Managerial Accounting For Dummies
Although some purchased direct materials are put into production, some
are stored for future use. Therefore, the amount of direct materials
purchased is probably different from the amount of direct materials actually
put into production.
Your simple outputs formula helps explain this relationship:
In this case, Beginning equals beginning inventory on the first day of the
time period. Inputs refers to purchases or transfers from other parts of the
company. Ending is ending inventory at the end of the last day of the time
period.
Finally, the Outputs value indicates what completed the production process
— the stuff that’s ready for the next stage of production (or for sale to
customers). You can apply this formula to the quantity of units in inventory
and put into production, and also to the costs of those same units.
For example, suppose that a convenience store started the year with ten
cans of coffee. During the year, it bought another 200 cans of coffee. At the
end of the year, it counted seven cans of coffee in stock. How many cans
did the store sell?
You can think of direct material storage in the same way: A factory keeps
direct materials (or cans of coffee) on hand so that they’re ready to be put
into production (or be sold to customers).
Units of direct materials put into production
For direct materials, you can use the outputs formula; just set your
Beginning value as the number of units of beginning inventory, Inputs as
the number of new units purchased, Ending as the number of units of
ending inventory, and Outputs as the number of units put into production.
Suppose your factory makes chocolate milk. You started with 500 gallons
of chocolate syrup and then purchased another 2,000 gallons during the
year. At the end of the year, you counted 400 gallons of chocolate syrup in
stock. This formula computes the number of gallons of chocolate syrup put
into production:
During the year, 2,100 gallons were moved out of storage and put into
production (to blend chocolate milk).
Cost of direct materials put into production
Naturally, factories need to keep track of both the quantity and the total
costs of different items at each stage of the production process. To figure
out total costs, you can apply the outputs formula to the total cost of direct
materials.
Suppose that your chocolate milk factory pays $2 for each gallon of
chocolate syrup. To compute the cost of direct materials put into
production, just multiply the quantities for Beginning, Inputs, and Ending by
the $2 cost per unit:
Your calculation reveals that you put 2,100 gallons into production, for a
total cost of $4,200.
How to Compute Equivalent Units in Cost
Accounting
By Kenneth Boyd from Cost Accounting For Dummies
In cost accounting, equivalent units are the units in production multiplied by
the percentage of those units that are complete (100 percent) or those that
are in process. That covers everything.
If a unit is completed and transferred out, it’s 100 percent complete. Now,
that may seem obvious, but it’s a point that gets lost when accountants
start this analysis. Your approach to complex analysis should be to account
for the easy stuff first. The completed and transferred out units are easier to
address than work in process.
Say you’ve mixed enough sugar to make 600,000 units of candy. Assume
that ending work in process is 25 percent complete for all components of
production (material, labor, and overhead). The table below shows the
computation of equivalent units.
Equivalent Units of
Production
Units Complete Equivalent Units
Completed and transferred 600,000 100 percent 600,000
Work in process, ending 600,000 25 percent 150,000
Equivalent units 750,000
Although 25 percent of the units are unfinished, in “equivalent unit talk” you
can treat them as 150,000 completed units. Add them to the really
completed units to get 750,000 units, which represents the number of
equivalent whole units you have produced. It’s a lot easier to talk about a
whole unit than some whole units and some partially completed units.
The next step is to compute the cost per equivalent unit. Take the total
costs of $101,800, and divide by the number of units. Remember that the
total costs are the sum of the beginning inventory cost ($48,000) and the
costs added during production ($53,800):
Cost per equivalent unit = total costs ÷ number of
units
Cost per equivalent unit = $101,800 ÷ 750,000
Cost per equivalent unit = $0.1357
The calculation goes to four decimal places, because when you’re making
candy that sells for 20 cents per unit, and you’re producing hundreds of
thousands of units, every tiny fraction of a dollar counts.
Now assign the cost per equivalent unit to the completed work and the
WIP. The table below shows the calculation (costs are rounded).
Assignment of Costs
Units Cost/Unit Cost Assigned
Completed and transferred 600,000 $0.1357 $81,440
Work in process, ending 150,000 $0.1357 $20,360
Equivalent units $101,800
You’ve assigned costs to both completed work and WIP. Congratulations!
Maybe you should eat a pound or two of candy to celebrate.
Compare Process Costing and Job Order
Costing
By Mark P. Holtzman from Managerial Accounting For Dummies
Process costing handles the same types of manufacturing costs as job
order costing. Both systems deal with tracking how manufacturing costs
such as direct materials, direct labor, and overhead flow through work-in-
process to finished goods and finally, when the goods are sold, to cost of
goods sold.
Some manufacturers make unique products, such as aircraft, made-to-
order suits, or custom teddy bears. Others mass-produce large numbers of
similar or identical items, such as soft drinks, sheets of paper, and boxes of
cereal. To mass-produce products at a minimal cost, assembly lines move
materials and partially finished goods from one station or department to the
next until they get completed into finished goods.
Job order costing accumulates costs by job, using job order cost sheets
that stay with the inventory as it flows through the production process.
Process costing, on the other hand, accumulates costs by department.
Process costing gives each department its own separate work-in-process
(WIP) account for accumulating costs and tallies costs at the end of each
fiscal period; job order costing uses only a single WIP account for all
unfinished jobs and tallies the cost of a job when it’s finished.
Although job order costing measures the cost of each individual job,
process costing measures the cost of work actually done on WIP during a
period.
Unlike job order costing, which sends costs directly to individual jobs,
process costing uses a two-step method:
1. Sending direct materials, direct labor, and overhead costs to
departments
2. Sending the department costs to the units produced
How to Calculate Overhead Allocation
By Mark P. Holtzman from Managerial Accounting For Dummies
Not all companies manufacture products that require the same amount of
overhead, and as a managerial account, you need to be able to calculate
the overhead allocation. The following example is relatively simple because
each product gets an equal amount of overhead.
Suppose a simple factory makes two products — call them Product A and
Product B. The factory needs no direct materials (yes, that means it makes
products out of thin air; please suspend your disbelief). It paid $1,600 in
direct labor to its workers and $400 for overhead, knowing that each
product required half of the direct labor costs — $800 each.
The $400 in overhead also gets divided equally — $200 to each product.
As shown in this figure, the total cost you need to apply (in this case,
$2,000) equals the total cost that you apply to your products (again,
$2,000).
But not all companies manufacture products that require the same amount
of overhead, and in those cases, the calculations aren’t quite as simple.
For example, suppose a similar company plans to make two products,
Product J and Product K. It plans to pay $1,600 in direct labor to its
workers. Product J requires 120 hours of that direct labor, while Product K
requires 40 hours. The company also expects to pay $200 for rent, $150 for
maintenance, and $50 for coffee.
To help you keep uneven allocations straight, remember that overhead
allocation entails three steps:
1. Add up total overhead.
This step requires adding indirect materials, indirect labor, and all other
product costs not included in direct materials and direct labor. Here,
overhead is estimated to include indirect materials ($50 worth of
coffee), indirect labor ($150 worth of maintenance), and other product
costs ($200 worth of rent), for a total of $400.
2. Compute the overhead allocation rate by dividing total overhead
by the number of direct labor hours.
You know that total overhead is expected to come to $400. Add up the
direct labor hours associated with each product (120 hours for Product
J + 40 hours for Product K = 160 total hours). Now plug these numbers
into the following equation:
For every hour needed to make a product, you need to apply $2.50
worth of overhead to that product.
Some accountants and managers refer to the overhead allocation rate
as the predetermined overhead allocation rate because it needs to be
estimated at the beginning of a period.
3. Apply overhead by multiplying the overhead allocation rate by
the number of direct labor hours needed to make each product.
Because Product J requires 120 hours, apply $300 worth of overhead
($120 hours x $2.50) to this product. Product K requires 40 hours, so
apply $100 to that product.
How to Allocate Fixed Overhead Costs in Cost
Accounting
By Kenneth Boyd from Cost Accounting For Dummies
When cost accounting, the more accurately you allocate fixed overhead
costs, the more accurately your product’s total costs are reflected. If total
cost is accurate, you can add a profit and calculate an accurate sale price.
To more accurately allocate fixed overhead you use cost pools and cost
allocations to compute a cost allocation rate.
Compute a cost allocation rate in cost accounting
Say you make car tires. Your cost pool for fixed overhead includes machine
depreciation, utility costs, and salary costs for your security guard. The
annual budgeted costs total $120,000, and you have 20,000 total machine
hours budgeted. Use these formulas and these numbers to compute your
cost allocation rate:
Budgeted cost allocation rate = $120,000 cost ÷ 20,000
machine hours
Budgeted cost allocation rate = $6 per machine hour
You determine that a budgeted quantity per unit (per tire) is 30 minutes.
Here is your budgeted fixed manufacturing overhead cost per unit:
Fixed overhead cost per unit = .5 hours per tire x $6
cost allocation rate per machine hour
Fixed overhead cost per unit = $3
Each tire has direct costs (steel belts, tread) and $3 in fixed overhead built
into it.
Next, apply actual costs and the static budget. Take the total cost pool of
$120,000 and simply divide it over 12 months. Your monthly static budget
is $120,000 ÷ 12 months. That’s $10,000 per month.
Calculate flexible budget variances rate in cost accounting
You can now calculate a fixed overhead flexible-budget variance
(sometimes referred to as a spending variance). A flexible budget changes
as activity levels (sales, production) change. Because fixed costs do not
change within a relevant range, there is no adjustment of budgeted fixed
costs from a static to a flexible budget. This holds true as long as actual
costs are within the relevant range.
Bad news. The static budget simply took the annual cost pool amount of
$120,000 and divided by 12 months. But say total actual costs for April are
$11,000. You have a variance, and it is not favorable. Here’s the formula:
Fixed overhead flexible budget variance = actual cost –
static budget
Fixed overhead flexible-budget variance = $11,000 -
$10,000
Fixed overhead flexible-budget variance = $1,000
unfavorable variance
The variance is unfavorable because your actual spending ($11,000) was
more than the static budget ($10,000). If you’re dealing with a spending
variance, a positive number is an unfavorable variance. You spent more
than planned.
Use production volume variances rate in cost accounting
An efficiency variance means that you used either more or less of the input
(material, labor) than you planned. The variance reflects how efficiently you
used your inputs to create a product or service.
For fixed overhead, there isn’t an efficiency variance. The fixed cost is what
it is. You incur the same amount of fixed costs regardless of how efficiently
you produce your goods. If your actual production is higher or lower than
planned, it doesn’t change your flexible budget total for fixed overhead
variance.
Whatcha gonna do? Instead of efficiency variance, fixed overhead variance
uses something called a production-volume variance. Because fixed costs
are fixed, the production volume variance measures how much output you
got for the fixed costs you put in. The focus is on the output, not the amount
of costs you put in (the input). This variance reveals how efficient you were
at producing goods using a fixed level of budgeted costs.
This variance compares budgeted fixed overhead and allocated fixed
overhead, based on actual output. (That’s a mouthful.) Here’s another way
of saying it: You take the budgeted fixed overhead and apply it to actual
output.
For fixed overhead analysis only, budgeted fixed overhead, flexible budget,
and static budget all mean the same thing. This is because fixed costs
don’t changes as the level of volume changes. That relationship is true
when you operate within the relevant range.
Assume actual tire production for April is 3,500. The table shows budgeted
fixed overhead applied to actual output.
Budgeted Fixed Overhead — Applied to Actual Output
Budgeted cost allocation rate (A) $6 per unit
Budgeted machine hours per tire (B) 0.5 (30 minutes)
Actual tires produced (C) 5,000
Budgeted overhead applied (A x B x C) $15,000
Now that you have the budgeted fixed overhead applied, you can compute
production volume variance:
Production volume variance = budgeted fixed overhead -
budgeted fixed overhead applied
Production volume variance = $10,000 - $15,000
Production volume variance = ($5,000) favorable
variance
The negative variance is favorable because this is a cost variance.
Spending less is what you want to do.
What this variance tells you is that even though you planned to spend only
$10,000 in fixed costs, you were able to produce more tires for the same
budgeted amount of money. In theory, producing 5,000 tires should have
cost you $15,000 in budgeted fixed costs. However, you made them within
the $10,000 budget. This saved you $5,000, because you were more
efficient at producing your goods than you planned.
What you saw for fixed overhead analysis were two variances: the flexible
budget variance and the production volume variance.
How to Determine the Standard Cost Per Unit
By Kenneth Boyd, Lita Epstein, Mark P. Holtzman, Frimette Kass-
Shraibman, Maire Loughran, Vijay S. Sampath, John A. Tracy, Tage C.
Tracy, and Jill Gilbert Welytok from Accounting All-in-One For
Dummies
To find the standard cost, you first compute the cost of direct materials,
direct labor, and overhead per unit. Then you add up these amounts.
The figure applies this approach to Band Book Company. To calculate the
standard cost of direct materials, multiply the direct materials standard
price of $10.35 by the direct materials standard quantity of 28 pounds per
unit.
The result is a direct materials standard cost of $289.80 per case. To
compute direct labor standard cost per unit, multiply the direct labor
standard rate of $12 per unit by the direct labor standard hours per unit of 4
hours. The standard cost per unit is $48 for direct labor.
Now multiply the overhead allocation rate of $10 per hour by the direct
labor standard hours of 4 hours per unit to come to a standard cost of
overhead per unit of $40.
Add together direct materials, direct labor, and overhead to arrive at the
standard cost per unit of $289.80 + $48 + $40 = $377.80. Making a single
case of books costs Band Book $377.80.
Understanding Activity-Based Costing
By Stephen L. Nelson from QuickBooks 2011 All-in-One For Dummies
To create an activity-based costing (ABC) product line income statement,
you attempt to trace the overhead cost directly to products or services. For
example, suppose that in the case of an imaginary hot dog stand business,
the rent expense is necessary because you need an electrical hookup to
keep the pot of chili heated. Perhaps you also need an electrical hookup to
run the can opener that you use (surreptitiously) to open the cans of chili
needed to refill the pot. This means, then, that the rent expense really can’t
be split between regular hot dogs and chilidogs. It needs to be allocated to
chilidogs.
You can treat the supplies expense in a very similar way. Suppose also
that, based on your observations, a regular hot dog customer grabs two
napkins for his hot dog, whereas a chilidog customer grabs eight napkins
for his chilidog. In this case, you can use this information to better allocate
the supplies expense.
Using this napkin usage information, you can calculate which percentage of
the supplies expense is used by regular hot dog customers and chilidog
customers. If regular hot dog customers use 4,000 out of a total of 20,000
napkins, 20 percent of the napkins are going to regular hot dog customers.
So you can allocate $200 of the $1,000 supplies expense to regular hot
dogs, and the remaining $800 of supplies expense should be allocated, or
traced, to the chilidog product line.
All you’re trying to do is trace overhead costs, or operating expenses, to
product lines.
The wages expense of $4,000 probably works in a very similar fashion.
Suppose that all the $4,000 of wages expense goes to serving customers
hot dogs. Furthermore, suppose that the process of serving a regular hot
dog to a customer requires two steps.
These steps are known as cost drivers. The term cost drivers simply
suggests that the number of steps an employee takes to serve a customer
is a good base on which to allocate the wages expense that comprises the
activity of serving.
By looking at the total number of steps required to serve regular hot dogs
and the total number of steps required to serve chilidogs, you can trace the
wages expense to the individual product lines. For example, if you sell
2,000 regular hot dogs and each hot dog requires two steps, regular hot
dogs require 4,000 steps in total. If you sell 2,000 chilidogs and each
chilidog requires five steps, the chilidog product line requires 10,000 steps.
To calculate the percentage of the wages expense that goes into preparing
regular hot dogs, you make the following calculation:
4,000 (the number of steps required for regular hot
dogs) / 14,000 (the total number of steps) x $4,000
This calculation returns the value $1,143.00.
In a similar fashion, you can use the steps information to allocate wages
expense to the chilidog product line.
10,000 (the number of steps to prepare chilidogs) /
14,000 (the total steps) x $4,000
This calculation returns the value $2,857.00.
An ABC approach to product-line profitability often produces surprising
results.
ABC Income Statement by Product Line
$2.50 Hot Dogs $4.00 Chilidogs Total
Sales revenue
(2,000 sold in each product line) 5,000 8,000 13,000
Cost of goods sold
$.15 buns 300 300 600
$.40 hot dogs 800 800 1,600
$.40 of chili for each chilidog 0 800 800
Total cost of goods sold 1,100 1,900 3,000
Gross margin 3,900 6,100 10,000
Operating expenses
Rent 0 1,000 1,000
Wages 1,143 2,857 4,000
Supplies 200 800 1,000
Total operating expenses 1,343 4,657 6,000
Net profit 2,557 1,443 4,000
Separable Cost Reduction in Cost Accounting
By Kenneth Boyd from Cost Accounting For Dummies
In cost accounting, the cost of goods available for sale represents the
product’s total costs. Total costs have two components — joint costs and
separable costs. When possible, you want to reduce separable costs, but
first take a look at your company’s joint costs.
Assume you manufacture leaf blowers. Your two products are heavy-duty
blowers and yardwork blowers. The separable costs are $1,200,000 for the
heavy-duty blower and $912,000 for the yardwork blower. If you know the
separable costs and the cost of goods available for sale, you can compute
the joint cost allocation. This table shows the process.
Joint Cost Allocation
Heavy-Duty Yardwork Total
Cost of goods available for sale $1,751,163 $1,260,837 $3,012,000
Less separable costs $1,200,000 $912,000 $2,112,000
Equals joint cost allocation $551,163 $348,837 $900,000
Each company division provides the separable costs. So altogether, this
table gives you a joint cost allocation.
Now assume that the heavy-duty blower division is able to sharply reduce
its separable costs to an amazingly low $500,000. The first table listed
heavy-duty separable costs of $1,200,000. Consider what now happens to
heavy-duty’s joint cost allocation. Take a look at the next table.
Cost Allocation — Less Heavy Duty Separable Costs
Heavy-Duty Yardwork Total
Cost of goods available for sale $1,751,163 $1,260,837 $3,012,000
Less separable costs $500,000 $912,000 $1,412,000
Equals joint cost allocation $1,251,163 $348,837 $1,600,000
Heavy-duty’s joint cost allocation increases to $1,251,163 (from $551,163).
That doesn’t seem right. The goal is to analyze costs to reduce or eliminate
them. If you do, supposedly you increase your profits.
In this case, the heavy-duty division’s reducing separable
costs increased its joint cost allocation. There doesn’t seem to be a benefit
to operating more efficiently.
Here’s an explanation: The gross margin percentage method (calculated as
gross margin ÷ total sales value x 100) locks in total costs as a percentage
of sales value. If the gross margin is about 12.5 percent of sales value, it
means that costs must be about 87.5 percent of sales value. For heavy-
duty, that 87.5 percent total cost number is $1,751,163. Those costs are
either separable or joint costs. If one increases, the other decreases.
The heavy-duty manager may have a problem with this process. The
manager works hard (using good old cost accounting) to lower the
separable costs. The manager’s “reward” is a higher joint cost allocation.
The heavy-duty division has lowered costs but doesn’t get any savings in
total costs.
The constant gross margin percentage method clarifies the revenue and
profit calculations company-wide. This method eliminates some of the
variation between company divisions. Although some managers may
complain, each division has the same gross margin percentage. The
process makes managing company profit easier.
This is one of those “Here’s why the chief financial officer (CFO) makes the
big bucks” moments. As CFO, you explain the gross margin percentage
method to the heavy-duty division manager. The goal is to allocate joint
costs so that each product maintains the same gross margin percentage of
about 12.5 percent. If a division reduces separable costs, it must get a
bigger joint cost allocation —otherwise, the gross margin percentage would
increase.
Now heavy-duty’s manager should be evaluated based on the successful
cost reduction. The manager had a success, and you want to encourage
more cost savings. Although the gross margin percentage process requires
a bigger joint cost allocation, that must not take away from the manager’s
good performance.
Cost Accounting: Joint Cost Allocation and
Gross Margin Percentage
By Kenneth Boyd from Cost Accounting For Dummies
In cost accounting, the cost of goods available for sale represents the
product’s total costs. Total costs have two components — joint costs and
separable costs.
Assume the cost of goods available for sale are $1,751,163 and
$1,260,837 for the heavy-duty blower and the yardwork blower. Say
the separable costsare $1,200,000 and $912,000. If you know the
separable costs and the cost of goods available for sale, you can compute
the joint cost allocation. The first table shows the process.
Joint Cost Allocation
Heavy-Duty Yardwork Total
Cost of goods available for sale $1,751,163 $1,260,837 $3,012,000
Less separable costs $1,200,000 $912,000 $2,112,000
Equals joint cost allocation $551,163 $348,837 $900,000
Each company division provides the separable costs. So altogether, the
table gives you a joint cost allocation.
Now calculate the gross margin percentage. Say your sales values are
$2,000,00 and $1,440,000 for heavy-duty and yardwork blowers. The total
cost is the cost of goods available for sale from the first table. The gross
margin percentage is the gross margin divided by the sales value. For each
product, the gross margin percentage is the same (12.442 percent) as the
company’s overall gross margin.
Verifying Gross Margin Percentage
Heavy-Duty Yardwork Total
Sales value (A) $2,000,000 $1,440,000 $3,440,000
Total cost (B) $1,751,163 $1,260,837 $3,012,000
Gross margin (A – B) $248,837 $179,163 $428,000
Gross margin percentage 12.442 12.442
Here’s the point of this table: it uses the traditional formula to compute
gross margin and gross margin percentage. The table verifies that the
calculations are correct.
If the heavy-duty product has the higher sales value, it ends up with a
higher gross margin in dollars than the yardwork product. However, both
sale values are multiplied by the same gross margin percentage. Both
products have a gross margin of about 12.5 percent (rounded). That means
that about 87.5 percent of sales value represents cost of goods available
for sale.
Variable and Absorption Costing in Cost
Accounting
By Kenneth Boyd from Cost Accounting For Dummies
Variable and absorption costing generate different levels of cost and net
income in cost accounting, so it’s important to understand the differences
so you can select a costing method to use internally for decision-making.
Say your business manufactures handsaws. Here is a summary of
production, sales, and costs in Year 1.
Year 1 Production — Sales and Costs
Production (units) 3,000
Sales (units) 2,500
Sales (at $25 per unit) $62,500
Fixed manufacturing costs $21,000
All other product costs $33,000
Because you didn’t sell all of your production, you created ending
inventory:
Ending inventory = units produced – units sold
Ending inventory = 3,000 – 2,500
Ending inventory = 500
Your fixed manufacturing costs are $7 per unit produced ($21,000 ÷ 3,000
units). Absorption costing requires you to assign $3,500 of fixed
manufacturing costs to ending inventory ($7 x 500 units). The next table
outlines the profit in Year 1, comparing variable and absorption costing.
Year 1 Profit — Variable Versus Absorption
Costing
Variable Costing Absorption Costing
Sales (at $25 per unit) $62,500 $62,500
Fixed manufacturing costs $21,000 $17,500
All other costs $27,500 $27,500
Total costs $48,500 $45,000
Profit $14,000 $17,500
Absorption costing deferred $3,500 of fixed manufacturing costs. The fixed
manufacturing costs are only $17,500. You see that absorption costing has
a $3,500 higher profit ($17,500 versus $14,000).
In Year 2, assume that your sales and sales price are the same. You also
sell all your production, plus the 500 units that were in ending inventory.
Your sales (2,500 units) are 500 units more than your production (2,000
units). Because you produced less in Year 2, the all-other-cost number
declines to $22,500. Less production means less cost. Check out this next
table.
Year 2 Production — Sales and Costs
Production (units) 2,000
Sales (units) 2,500
Sales (at $25 per unit) $62,500
Fixed manufacturing costs $21,000
All other costs $22,500
Variable and absorption costing are the same if you sell all of your
production. You don’t produce any ending inventory, so you don’t defer any
fixed manufacturing costs into inventory items. Here is the profit in Year 2.
Year 2 Profit — Variable Versus Absorption
Costing
Variable Costing Absorption Costing
Sales (at $25 per unit) $62,500 $62,500
Fixed manufacturing costs $21,000 $24,500
All other costs $27,500 $27,500
Total costs $48,500 $52,000
Profit $14,000 $10,500
Five hundred units from Year 1 ending inventory are sold in Year 2. In the
third table, production of 2,000 is 500 units less than sales of 2,500. You
had 500 units available for sale at the beginning of Year 2.
Fixed manufacturing costs for Year 2 are the same for both methods
($21,000). However, absorption costing added the $3,500 fixed
manufacturing cost that was deferred in Year 1. The fixed manufacturing
cost is $24,500 ($21,000 + $3,500).
The variable costing profit in Year 2 is $3,500 higher than the absorption
costing profit ($14,000 versus $10,500). In Year 1, variable costing profit
was $3,500 lower than the absorption costing. When Year 1 ending
inventory is sold in Year 2, absorption picks up the fixed manufacturing cost
that was deferred.
Over two years, all the production is sold. The total profit over two years is
the same for both costing methods.
You’re probably wondering about which method to use. Your
profit eventuallyis the same under either method. In the long run, there is
no advantage to using one method over another.
You should select a method and stick with it. By doing so, you’re applying
the principle of consistency. For a financial statement reader to compare
your results year by year, you need to use the same method. It’s the old
idea of an apples-to-apples comparison.
How to Implement Variance Analysis in Cost
Accounting
By Kenneth Boyd from Cost Accounting For Dummies
In cost accounting practice, a spending variance occurs when the rate or
price you pay different from your budget. An efficiency variance is incurred
when you use more or less than you plan.
You implement variance analysis to understand differences between
planned and actual costs. You hope to learn from the analysis and reduce
your costs moving forward.
Compare the use of the term flexible budget variance in cost accounting
Flexible budget variance is used in the fixed overhead costs section earlier
this chapter. However, flexible budget variance has a different meaning for
variable overhead. For variable overhead, the flexible budget variance is
the sum of two variances.
Flexible budget variance (also variable overhead
variance) = spending variance + efficiency variance
To keep this straight in your head, flexible budget variance refers to one
variance for fixed overhead. Flexible budget variance is the sum of two
variances for variable overhead.
Compute spending variance and efficiency variance in cost accounting
The formula for price variance is:
Price variance = (actual price - budgeted price) x
(actual units sold)
The price variance formula is similar to the variable overhead spending
variance. Instead of actual units sold, this variance uses actual units
produced. That’s because you’re applying overhead to production. You use
actual and budgeted costs instead of prices. All that being said, here’s the
formula:
Variable overhead spending variance = ($2.11 - $1.80) x
(18,000)
Variable overhead spending variance = $5,580
It’s an unfavorable variance, because you spent more than you planned.
Once again, if you get a positive number for a cost variance, it’s
unfavorable.
Now consider the variable overhead efficiency variance. If you have an
efficiency variance, you used more or less than you planned. You need two
calculations for this variance; then you compute the difference between the
two amounts.
Here’s the first calculation:
Actual quantity x budgeted price = 18,000 units x $1.80
Actual quantity x budgeted price = $32,400
The second calculation is budgeted variable overhead applied to actual
output.
Budgeted Variable Overhead — Applied to Actual Output
Flexible-budget machine hours per output (A) 4
Actual output (units) (B) 5,000
Flexible-budget overhead per machine hour (C) $1.80
Budgeted variable overhead applied (A x B x C) $36,000
The variable overhead efficiency variance is the difference between (actual
quantity x budgeted price) and (budgeted variable overhead applied to
actual output). Here’s the variance:
Variable overhead efficiency variance = $32,400 -
$36,000
Variable overhead efficiency variance = ($3,600).
Because this is a negative cost variance, it’s favorable.
The variable overhead variance is the sum of the spending variance and
the efficiency variance. Here’s your variance calculation:
Variable overhead variance = $5,580 + ($3,600)
Variable overhead variance = $1,980
Because the positive cost variance is unfavorable, that means your costs
for variable overhead were more than planned.
One point bears repeating: You have a variance because you spent more
or less than planned (the price or rate you paid had a variance), or you
used more or less than planned. You can apply that thought to just about
any variance in cost accounting.
Attach Costing Concepts to Variance Analysis
in Cost Accounting
By Kenneth Boyd from Cost Accounting For Dummies
When cost accounting, you can allocate costs at different levels: unit level,
batch level, and so forth. A batch is a group of units, just like a batch of
cookies you bake in the oven. You can analyze how you produce batches
(for example, batches of a simple, high-volume product compared to
batches of a complex, low-volume product) and possibly reduce your costs.
That’s better than spreading costs uniformly, which can result in distortions.
Say you make glass bottles. You’re in a great environment for cost
allocation by batch. A machine shapes the glass into bottles and imprints
your logo. Your static budget assumes that the cost of loading and
unloading bottles is allocated based on a batch of 50 bottles. Here is an
analysis of your loading costs.
Glass Bottles — Labor Cost Allocation by
Batch
Actual Static
Bottles produced (A) 10,000 12,000
Batch size (B) 50 48
Batches produced (A × B) 200 250
Labor hours per batch 3 2.5
Total labor hours (C) 600 625
Cost per labor hour (D) $22 $21
Total labor costs (C × D) $13,200 $13,125
You have just traced labor costs at a different level in cost hierarchy.
Instead of tracing costs to a unit, you’ve traced costs to a batch.
It’s not hard to apply flexible budget techniques to a batch. When you know
how to apply the per-unit static budget amount to actual production, it’s a
short step to applying the per-batch static budget amount to actual
production.
This table calculates flexible budget cost.
Glass Bottles — Flexible Budget Calculation
Actual units 10,000
Divide by static batch size 48
Equals number of batches 208
Multiply by static labor hours per batch 2.5
Equals flexible budget labor hours 521
Multiply by static labor rate per hour $21
Equals flexible budget labor costs $10,938
The best way to reduce costs is to analyze multiple variances (in fact,
analyze as much data as you can). You see labor price and efficiency
variances in tables earlier in the chapter. Now apply the concepts at the
batch level. These tables show a labor price variance calculation and a
labor efficiency variance.
Glass Bottles — Labor Price Variance
Actual Quantity × Actual Price Actual Quantity × Budgeted Price
600 hours 600 hours
Multiply by $22/hour Multiply by $21/hour
Equals $13,200 (A) Equals $12,600 (B)
Labor price variance (A – B) $600
Because the price variance relates to cost, the negative variance of $625 is
favorable. You spent less than planned in the static budget.
Glass Bottles — Labor Efficiency Variance
Actual Quantity × Budgeted Price Budgeted Quantity × Budgeted Price
600 hours 625 hours
Multiply by $21/hour Multiply by $21/hour
Equals $12,600 (A) Equals $13,125 (B)
Labor efficiency variance (A – B) -$525
Favorable
The negative labor cost variance is favorable. You spent less than planned.
Now calculate the flexible budget variance:
Flexible budget variance = price variance + efficiency
variance
Flexible budget variance = $600 + -$525
Flexible budget variance = $75
How to Determine Variances in Cost
Accounting
By Kenneth Boyd from Cost Accounting For Dummies
When cost accounting, if you think investigating a variance is tough, try
ignoring one sometime. Yes, following up takes time and may involve
phone calls, discussions with your staff, or additional research into supplier
relationships. But if the variance is relevant, you gotta do it.
In accounting, you see the term relevance used frequently. Relevance
refers to something that’s worth noticing. You need to decide what
variances are important to you. Here’s some simple advice: If a variance
amounts to a big percentage difference between actual results and plan, or
if it amounts to a big out-of-pocket cash difference, you should investigate.
Don’t waffle on the impact of defective products in cost accounting
If you produce defective products, you’re spending production costs on
goods that cannot be sold to customers. You may be able to repair the
product and sell it, but that will require more costs, too. So defective
products result in unfavorable cost variances. You spend more than you
planned.
You also may see a decline in sales, as unhappy customers stop buying
your product. The sales decline means an unfavorable sales variance. You
sell less than you planned.
A defective product will kill you ten ways to Sunday. Any defect in any
product qualifies. The impact won’t be good. The first thing you don’t need
is diminished sales, and the last thing you need is dozens of bad comments
on a consumer website.
This isn’t just a matter of a cost accounting variance. A defective product is
the core of ruined image, publicly aired complaints, and a general
undermining of confidence in your entire product line.
Simple advice is for you to look at the defect, find the cause, correct the
cause, and make things right with your customer base. And for that matter,
take what steps are necessary to reduce the chances of producing
defective products in the future. The time investment is worth the effort.
You don’t have to spend a lot of time on the Internet to find stories about
companies that were seriously damaged by making defective products and
failed to handle the problem.
Pick a guideline for variances in cost accounting
For variances other than serious product defects, pick a dollar amount or
percentage as a big red flare. That is, choose a guideline for investigating
variances.
Say you’re making watches. It doesn’t matter whether you put out costly
Rolex watches at $15,325 or inexpensive Casio watches at $6.95. Each
line suggests a guideline for concern.
You might decide that a variance of 10 percent or more from your standard
amount is an issue. If your standard direct materials cost (cost x quantity) is
$50,000, a variance, either favorable or unfavorable, of $5,000 or more
($50,000 x 10%) should be reviewed. The same is true if your standard
direct material cost is $5,000,000. It’s still 10 percent or more.
Big-ticket items can absorb a variance better than small-ticket items. An
affluent customer base is likely to accept price increases, which overcomes
variances. The economic law is that consumers buy more of a good when
its price is lower and less when its price is higher; however, that law doesn’t
seem to apply to luxury items.
Keep in mind that the standards you create in planning (costs, quantities,
and so forth) are only an estimate. You can expect some difference
between standard and actual amounts. You don’t have a crystal ball to get
the standards exactly right. Finally, your company should include the
guidelines for variance investigation in your written accounting procedures.
That way, everyone in your organization knows the ground rules for
variances.
Continuous improvement and benchmarking in cost accounting
Continuous improvement is the process of continually improving your
efficiency and thereby reducing costs over time. By reducing costs a small
amount each year, you increase your profit over time. You can find areas to
reduce costs by investigating variances.
Over time, it may be more difficult to find cost reductions. As with many
things in life, you try to do the easy fixes first; you make those changes that
are obvious. As time goes on, the changes make your production more
efficient. Finding new changes gets harder, but great companies stay at it.
They make the effort to find more ways to reduce costs without sacrificing
product quality.
If you want to compete, it’s a good idea to compare your performance to
other companies in your industry. Benchmarking is the process of
comparing your company’s performance to that of similar companies. That
performance could mean many things: how quickly you deliver a service or
how well you produce a product that minimizes defects. If you do
competitive benchmarking, you’re in good company. Some of the largest
corporations in the world have such programs.
The purpose of benchmarking is to suggest areas where you can make
improvements. If, for example, you can produce and deliver a product
faster or reduce costs without affecting product quality, your company can
be more profitable.
What you measure relates to what you do. If you’re in a service industry,
you might benchmark how quickly you do things: how long a customer
waits in line at your store or how quickly can you make a home delivery.
If you manufacture products, you might benchmark product quality. Quality
might mean tracking the number of product defects or the percentage of
sales that are returned by customers.

More Related Content

What's hot

Detial process description inter company stock transfer
Detial process description inter company stock transferDetial process description inter company stock transfer
Detial process description inter company stock transfer
Muhammad Zafar Firoz
 
Copa configuration
Copa configurationCopa configuration
Copa configuration
Mithun Roy
 

What's hot (20)

Install base
Install baseInstall base
Install base
 
Detial process description inter company stock transfer
Detial process description inter company stock transferDetial process description inter company stock transfer
Detial process description inter company stock transfer
 
SAP CO step by step config guide & user manual part 1
SAP CO step by step config guide & user manual part 1SAP CO step by step config guide & user manual part 1
SAP CO step by step config guide & user manual part 1
 
11 job costing
11 job costing11 job costing
11 job costing
 
20150202.pdf
20150202.pdf20150202.pdf
20150202.pdf
 
16.bill of material
16.bill of material16.bill of material
16.bill of material
 
Introduction to Bill Of Materials
Introduction to Bill Of MaterialsIntroduction to Bill Of Materials
Introduction to Bill Of Materials
 
Enhancement Packages 5 & 6 – Where to find the business functions that matter...
Enhancement Packages 5 & 6 – Where to find the business functions that matter...Enhancement Packages 5 & 6 – Where to find the business functions that matter...
Enhancement Packages 5 & 6 – Where to find the business functions that matter...
 
D kandampalayam shanmugam_ppt_1
D kandampalayam shanmugam_ppt_1D kandampalayam shanmugam_ppt_1
D kandampalayam shanmugam_ppt_1
 
1.what is bill of materials
1.what is bill of materials1.what is bill of materials
1.what is bill of materials
 
Copa implementation
Copa implementationCopa implementation
Copa implementation
 
What is bill of materials functionality
What is bill of materials functionalityWhat is bill of materials functionality
What is bill of materials functionality
 
Copa realignment
Copa realignmentCopa realignment
Copa realignment
 
Valuation & Split valuation in MM
Valuation & Split valuation in MMValuation & Split valuation in MM
Valuation & Split valuation in MM
 
105322956 advance-pricing-total-oracle-apps
105322956 advance-pricing-total-oracle-apps105322956 advance-pricing-total-oracle-apps
105322956 advance-pricing-total-oracle-apps
 
CO-PA SAP
CO-PA SAPCO-PA SAP
CO-PA SAP
 
Copa configuration
Copa configurationCopa configuration
Copa configuration
 
Maccounting midwestofficeproducts
Maccounting midwestofficeproductsMaccounting midwestofficeproducts
Maccounting midwestofficeproducts
 
Bom in sap
Bom in sapBom in sap
Bom in sap
 
Sap sd notes
Sap sd notesSap sd notes
Sap sd notes
 

Similar to How to Calculate Product Costs for a Manufacturer

Similar to How to Calculate Product Costs for a Manufacturer (20)

Basics of finance
Basics of financeBasics of finance
Basics of finance
 
break even analysis
break even analysisbreak even analysis
break even analysis
 
Break-even analysis.pptx
Break-even analysis.pptxBreak-even analysis.pptx
Break-even analysis.pptx
 
Cost analysis for entrepreneurs
Cost analysis for entrepreneurs Cost analysis for entrepreneurs
Cost analysis for entrepreneurs
 
Cost analysis for entrepreneurs
Cost analysis for entrepreneurs Cost analysis for entrepreneurs
Cost analysis for entrepreneurs
 
Pricing Strategy for the third year- Updated.pdf
Pricing Strategy for the third year- Updated.pdfPricing Strategy for the third year- Updated.pdf
Pricing Strategy for the third year- Updated.pdf
 
Cost accounting-ppt
Cost accounting-pptCost accounting-ppt
Cost accounting-ppt
 
Chapter 3 : Overhead Analysis
Chapter 3 : Overhead AnalysisChapter 3 : Overhead Analysis
Chapter 3 : Overhead Analysis
 
Management Accounting
Management AccountingManagement Accounting
Management Accounting
 
costing and pricing.pptx
costing and pricing.pptxcosting and pricing.pptx
costing and pricing.pptx
 
Cost management of kurukshetra university mtech
Cost management of kurukshetra university mtechCost management of kurukshetra university mtech
Cost management of kurukshetra university mtech
 
Sma techniques of costing
Sma  techniques of costingSma  techniques of costing
Sma techniques of costing
 
techniques to measure and enhance profitability and quality of a product or ...
 techniques to measure and enhance profitability and quality of a product or ... techniques to measure and enhance profitability and quality of a product or ...
techniques to measure and enhance profitability and quality of a product or ...
 
Production Cost Concepts (ppt)
Production Cost Concepts (ppt) Production Cost Concepts (ppt)
Production Cost Concepts (ppt)
 
Meeting 7- Financial Planning (Financial Management)
Meeting 7- Financial Planning (Financial Management)Meeting 7- Financial Planning (Financial Management)
Meeting 7- Financial Planning (Financial Management)
 
Advanced Cost Accountancy (Techniques of Costing)
Advanced Cost Accountancy (Techniques of Costing)Advanced Cost Accountancy (Techniques of Costing)
Advanced Cost Accountancy (Techniques of Costing)
 
Types of apparel costing
Types of apparel costingTypes of apparel costing
Types of apparel costing
 
COST OF GOODS MANUFACTURED & MIXED COST & Contribution Margin Income Statemen...
COST OF GOODS MANUFACTURED & MIXED COST & Contribution Margin Income Statemen...COST OF GOODS MANUFACTURED & MIXED COST & Contribution Margin Income Statemen...
COST OF GOODS MANUFACTURED & MIXED COST & Contribution Margin Income Statemen...
 
Cost acounting
Cost acountingCost acounting
Cost acounting
 
Marginal costing
Marginal costingMarginal costing
Marginal costing
 

More from Isah Nurdianah

More from Isah Nurdianah (20)

Sistem Nilai Bisnis Amerika
Sistem Nilai Bisnis AmerikaSistem Nilai Bisnis Amerika
Sistem Nilai Bisnis Amerika
 
Interpretasi Hasil Pada SPSS
Interpretasi Hasil Pada SPSSInterpretasi Hasil Pada SPSS
Interpretasi Hasil Pada SPSS
 
Strategi Porter (Studi pada Indofood)
Strategi Porter (Studi pada Indofood)Strategi Porter (Studi pada Indofood)
Strategi Porter (Studi pada Indofood)
 
Pengaruh Kualitas Produk, Citra Merek, dan Desain Produk terhadap Keputusan P...
Pengaruh Kualitas Produk, Citra Merek, dan Desain Produk terhadap Keputusan P...Pengaruh Kualitas Produk, Citra Merek, dan Desain Produk terhadap Keputusan P...
Pengaruh Kualitas Produk, Citra Merek, dan Desain Produk terhadap Keputusan P...
 
Analisis persoalan (AP) Apartement DPR
Analisis persoalan (AP) Apartement DPRAnalisis persoalan (AP) Apartement DPR
Analisis persoalan (AP) Apartement DPR
 
Analisis Kelayakan Franchise Apotik KImia Farma
Analisis Kelayakan Franchise Apotik KImia FarmaAnalisis Kelayakan Franchise Apotik KImia Farma
Analisis Kelayakan Franchise Apotik KImia Farma
 
Sistem informasi pemasaran PT Sido Muncul
Sistem informasi pemasaran PT Sido MunculSistem informasi pemasaran PT Sido Muncul
Sistem informasi pemasaran PT Sido Muncul
 
Cross cultural business comunication
Cross cultural business comunicationCross cultural business comunication
Cross cultural business comunication
 
Bisnis, lingkungan hidup, dan etika
Bisnis, lingkungan hidup, dan etikaBisnis, lingkungan hidup, dan etika
Bisnis, lingkungan hidup, dan etika
 
Bitcoin
BitcoinBitcoin
Bitcoin
 
Sistem Informasi Sumber Daya Manusia
Sistem Informasi Sumber Daya ManusiaSistem Informasi Sumber Daya Manusia
Sistem Informasi Sumber Daya Manusia
 
Geen Marketing
Geen MarketingGeen Marketing
Geen Marketing
 
Emerging Market
Emerging MarketEmerging Market
Emerging Market
 
TQM dan Alat-alat TQM
TQM dan Alat-alat TQMTQM dan Alat-alat TQM
TQM dan Alat-alat TQM
 
Geprek Brewok
Geprek BrewokGeprek Brewok
Geprek Brewok
 
Budaya Jepang
Budaya JepangBudaya Jepang
Budaya Jepang
 
Gaya komunikasi dalam praktek manajemen di indonesia
Gaya komunikasi dalam praktek manajemen di indonesiaGaya komunikasi dalam praktek manajemen di indonesia
Gaya komunikasi dalam praktek manajemen di indonesia
 
Utang jangka panjang, saham preferen dan saham biasa
Utang jangka panjang, saham preferen dan saham biasaUtang jangka panjang, saham preferen dan saham biasa
Utang jangka panjang, saham preferen dan saham biasa
 
Analisis promotion mix dalam iklan oppo f1s
Analisis promotion mix dalam iklan oppo f1sAnalisis promotion mix dalam iklan oppo f1s
Analisis promotion mix dalam iklan oppo f1s
 
Dasar dasar ekonomi manajerial
Dasar dasar ekonomi manajerialDasar dasar ekonomi manajerial
Dasar dasar ekonomi manajerial
 

Recently uploaded

Monthly Economic Monitoring of Ukraine No. 232, May 2024
Monthly Economic Monitoring of Ukraine No. 232, May 2024Monthly Economic Monitoring of Ukraine No. 232, May 2024
Introduction to Economics II Chapter 28 Unemployment (1).pdf
Introduction to Economics II Chapter 28 Unemployment (1).pdfIntroduction to Economics II Chapter 28 Unemployment (1).pdf
Introduction to Economics II Chapter 28 Unemployment (1).pdf
Safa444074
 
USDA Loans in California: A Comprehensive Overview.pptx
USDA Loans in California: A Comprehensive Overview.pptxUSDA Loans in California: A Comprehensive Overview.pptx
USDA Loans in California: A Comprehensive Overview.pptx
marketing367770
 
一比一原版UO毕业证渥太华大学毕业证成绩单如何办理
一比一原版UO毕业证渥太华大学毕业证成绩单如何办理一比一原版UO毕业证渥太华大学毕业证成绩单如何办理
一比一原版UO毕业证渥太华大学毕业证成绩单如何办理
yonemuk
 
PD ARRAY THEORY FOR INTERMEDIATE (1).pdf
PD ARRAY THEORY FOR INTERMEDIATE (1).pdfPD ARRAY THEORY FOR INTERMEDIATE (1).pdf
PD ARRAY THEORY FOR INTERMEDIATE (1).pdf
JerrySMaliki
 

Recently uploaded (20)

how can I sell/buy bulk pi coins securely
how can I sell/buy bulk pi coins securelyhow can I sell/buy bulk pi coins securely
how can I sell/buy bulk pi coins securely
 
how to sell pi coins in Canada, Uk and Australia
how to sell pi coins in Canada, Uk and Australiahow to sell pi coins in Canada, Uk and Australia
how to sell pi coins in Canada, Uk and Australia
 
how can I sell my pi coins in China 2024.
how can I sell my pi coins in China 2024.how can I sell my pi coins in China 2024.
how can I sell my pi coins in China 2024.
 
how to sell pi coins at high rate quickly.
how to sell pi coins at high rate quickly.how to sell pi coins at high rate quickly.
how to sell pi coins at high rate quickly.
 
Monthly Economic Monitoring of Ukraine No. 232, May 2024
Monthly Economic Monitoring of Ukraine No. 232, May 2024Monthly Economic Monitoring of Ukraine No. 232, May 2024
Monthly Economic Monitoring of Ukraine No. 232, May 2024
 
how can I sell pi coins after successfully completing KYC
how can I sell pi coins after successfully completing KYChow can I sell pi coins after successfully completing KYC
how can I sell pi coins after successfully completing KYC
 
how can I sell my locked pi coins safety.
how can I sell my locked pi coins safety.how can I sell my locked pi coins safety.
how can I sell my locked pi coins safety.
 
where can I purchase things with pi coins online
where can I purchase things with pi coins onlinewhere can I purchase things with pi coins online
where can I purchase things with pi coins online
 
Introduction to Economics II Chapter 28 Unemployment (1).pdf
Introduction to Economics II Chapter 28 Unemployment (1).pdfIntroduction to Economics II Chapter 28 Unemployment (1).pdf
Introduction to Economics II Chapter 28 Unemployment (1).pdf
 
Most Profitable Cryptocurrency to Invest in 2024.pdf
Most Profitable Cryptocurrency to Invest in 2024.pdfMost Profitable Cryptocurrency to Invest in 2024.pdf
Most Profitable Cryptocurrency to Invest in 2024.pdf
 
how can i use my minded pi coins I need some funds.
how can i use my minded pi coins I need some funds.how can i use my minded pi coins I need some funds.
how can i use my minded pi coins I need some funds.
 
USDA Loans in California: A Comprehensive Overview.pptx
USDA Loans in California: A Comprehensive Overview.pptxUSDA Loans in California: A Comprehensive Overview.pptx
USDA Loans in California: A Comprehensive Overview.pptx
 
Commercial Bank Economic Capsule - May 2024
Commercial Bank Economic Capsule - May 2024Commercial Bank Economic Capsule - May 2024
Commercial Bank Economic Capsule - May 2024
 
how to sell pi coins on Binance exchange
how to sell pi coins on Binance exchangehow to sell pi coins on Binance exchange
how to sell pi coins on Binance exchange
 
how can i make money selling pi coins in 2024
how can i make money selling pi coins in 2024how can i make money selling pi coins in 2024
how can i make money selling pi coins in 2024
 
Webinar Exploring DORA for Fintechs - Simont Braun
Webinar Exploring DORA for Fintechs - Simont BraunWebinar Exploring DORA for Fintechs - Simont Braun
Webinar Exploring DORA for Fintechs - Simont Braun
 
一比一原版UO毕业证渥太华大学毕业证成绩单如何办理
一比一原版UO毕业证渥太华大学毕业证成绩单如何办理一比一原版UO毕业证渥太华大学毕业证成绩单如何办理
一比一原版UO毕业证渥太华大学毕业证成绩单如何办理
 
Isios-2024-Professional-Independent-Trustee-Survey.pdf
Isios-2024-Professional-Independent-Trustee-Survey.pdfIsios-2024-Professional-Independent-Trustee-Survey.pdf
Isios-2024-Professional-Independent-Trustee-Survey.pdf
 
PD ARRAY THEORY FOR INTERMEDIATE (1).pdf
PD ARRAY THEORY FOR INTERMEDIATE (1).pdfPD ARRAY THEORY FOR INTERMEDIATE (1).pdf
PD ARRAY THEORY FOR INTERMEDIATE (1).pdf
 
9th issue of our inhouse magazine Ingenious May 2024.pdf
9th issue of our inhouse magazine Ingenious May 2024.pdf9th issue of our inhouse magazine Ingenious May 2024.pdf
9th issue of our inhouse magazine Ingenious May 2024.pdf
 

How to Calculate Product Costs for a Manufacturer

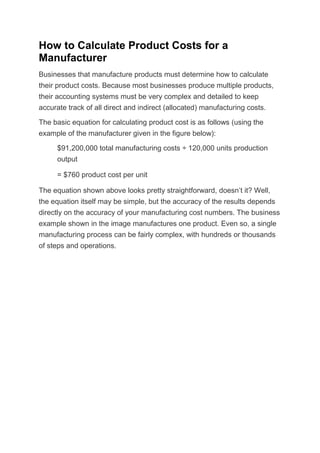
  • 1. How to Calculate Product Costs for a Manufacturer Businesses that manufacture products must determine how to calculate their product costs. Because most businesses produce multiple products, their accounting systems must be very complex and detailed to keep accurate track of all direct and indirect (allocated) manufacturing costs. The basic equation for calculating product cost is as follows (using the example of the manufacturer given in the figure below): $91,200,000 total manufacturing costs ÷ 120,000 units production output = $760 product cost per unit The equation shown above looks pretty straightforward, doesn’t it? Well, the equation itself may be simple, but the accuracy of the results depends directly on the accuracy of your manufacturing cost numbers. The business example shown in the image manufactures one product. Even so, a single manufacturing process can be fairly complex, with hundreds or thousands of steps and operations.
  • 2. Example for determining the product cost of a manufacturer. In the example, the business manufactured 120,000 units and sold 110,000 units during the year, and its product cost per unit is $760. The 110,000 total units sold during the year is multiplied by the $760 product cost to compute the $83.6 million cost of goods sold expense, which is deducted against the company’s revenue from selling 110,000 units during the year. The company’s total manufacturing costs for the year were $91.2 million, which is $7.6 million more than the cost of goods sold expense. The remainder of the total annual manufacturing costs is recorded as an increase in the company’s inventory asset account, to recognize that 10,000 units manufactured this year are awaiting sale in the future
  • 3. . In the figure, note that the $760 product cost per unit is applied both to the 110,000 units sold and to the 10,000 units added to inventory. The product cost per unit for the example business is determined for the entire year. In actual practice, manufacturers calculate their product costs monthly or quarterly. The computation process is the same, but the frequency of doing the computation varies from business to business. Product costs likely will vary each successive period the costs are determined. Because the product costs vary from period to period, the business must choose which cost of goods sold and inventory cost method to use. (If product cost happened to remain absolutely flat and constant period to period, the different methods would yield the same results.) To reduce and eliminate costs in a business, you need to know the formulas that are most often used in cost accounting. When you understand and use these foundational formulas, you’ll be able to analyze a product’s price and increase profits. Breakeven Formula Profit ($0) = sales – variable costs – fixed costs Target Net Income Target net income = sales – variable costs – fixed costs Gross Margin Gross margin = sale price – cost of sales (material and labor) Contribution Margin Contribution margin = sales – variable costs Pre-Tax Dollars Needed for Purchase Pre-tax dollars needed for purchase = cost of item ÷ (1 - tax rate) Price Variance Price variance = (actual price - budgeted price) × (actual units sold)
  • 4. Efficiency Variance Efficiency variance = (Actual quantity – budgeted quantity) × (standard price or rate) Variable Overhead Variance Variable overhead variance = spending variance + efficiency variance Ending Inventory Ending inventory = beginning inventory + purchases – cost of sales Important Terms and Principles Cost Accountants Should Know Many accountants will tell you that cost accounting is the most difficult accounting subject to learn. That's because cost accounting has many terms that are not used in other areas of accounting (financial accounting and management accounting, to name a few). If you're looking for an overview of the most important terms and principles for this subject, you've found it! These concepts provide a foundation for learning cost accounting. Reviewing accounting basics Accountants use many principles to guide their decision-making process, such as the matching principle and the principle of conservatism. • Matching principle: This principle states that your company’s revenue should be matched with the expenses that relate to that revenue. If you sell lamps in May, you create revenue for that month. The May revenue should be matched with the expenses you incurred for the lamps sold in May. So, the cost of the lamp is matched with the sales proceeds for the lamp’s sale. • Principle of conservatism: Accountants often need to make judgments.Conservatism means that the decision should generate the least attractive financial result. If there’s a decision about revenue, the conservative choice is to delay recognizing revenue in the financial statements. Expenses should be posted to the financial statements
  • 5. sooner rather than later. These choices generate financial statements that are less optimistic, which is why the approach is called conservative. There are four basic types of cost that accountants need to keep in mind — direct, indirect, fixed, and variable costs. They are defined as follows: • Direct costs: Direct costs can be directly traced to the product. Material and labor costs are good examples. • Indirect costs: These can’t be directly traced to the product; instead, these costs are allocated, based on some level of activity. For example, overhead costs are considered indirect costs. • Fixed costs: Fixed costs don’t vary with the level of production. A good example is a lease on a building. • Variable costs: Unlike fixed costs, variable costs change with the level of production. For example, material used in production is a variable cost. Every cost can be defined with two of these four costs. For example, the cost to repair machinery is an indirect variable cost. You decide if the cost is direct or indirect, and if the cost is fixed or variable. Checking out cost accounting basics Just like in any discipline, you use specific cost accounting terms and ideas to communicate meaning and understand procedures. Understanding basic concepts in crucial, so to start using cost accounting analysis, you should be familiar with these terms: • Contribution margin: This term is defined as sales minus variable cost. When you subtract your fixed costs from contribution margin, the amount left over is your profit. • Breakeven point formula: The breakeven point is the level of sales where your profit is zero. The breakeven formula is sales minus variable cost minus fixed cost. You multiply your sales per unit by units sold. You also multiply the variable cost per unit by the same units sold. The sales level that makes the formula equal to zero is the breakeven point.
  • 6. • Relevant range: Relevant range is a term that relates to machinery, equipment, or vehicles in your business. Think of relevant range as the maximum level of use for the item you operate in your business. Say you use a sewing machine. As long as you operate the machine at or below the relevant range, it should operate normally. The machine’s cost should come in at the level you expect. If you operate above the relevant range, the machine won’t operate as you expect. You need to invest in a second machine to operate above the relevant range. Digging deeper into cost accounting analysis As you further your study, you use more complex cost analysis tools. From job costing to variances, the more involved the job, the more involved your cost accounting tools become. Here are some important tools you’ll use: • Job costing: This method of costing assumes that every customer job is different. Plumbers and carpenters are good examples of businesses that use cost accounting. Because every job is different, each customer job is assigned material, labor, and overhead costs. • Process costing: Companies use process costing when partially completed units are moved from one production area to another. Process costing assumes that the products you produce are similar or even identical. • Activity-based costing (ABC): ABC costing can be used for both job costing and process costing analysis. You use ABC costing to assign costs to your product more specifically. ABC costing analyzes the activities that cause you to incur costs; you then connect the cost to the activity. • Variance: A variance is a difference between your planned or budgeted cost and your actual results. A favorable variance occurs when your actual costs are less than your budgeted or planned cost. An unfavorable variance is when actual costs are higher than planned. • Inventoriable costs: These are costs that are directly related to the product. Production costs are inventoriable costs for a manufacturer. If
  • 7. you are a retailer, your cost to purchase inventory is also an inventoriable. Other costs you incur for goods are included, such as shipping and storage costs. Avoiding Pitfalls on Cost Accounting Exams Cost accounting is a great tool to improve the profitability in any business. It’s a critical subject that accounting students need to learn to be successful in their careers. However, some cost accounting concepts are easily misunderstood and therefore difficult to address correctly on exams. These test-taking strategies will help you succeed on a cost accounting exam by clarifying what is truly being asked in each question. Read the last sentence first. Cost accounting questions often provide lots of data, but not all of that information is needed to answer the question. Test item writers refer to that data asdistractors. If you start at the top and read down, you read a lot of unneeded data. Read the last sentence first. That strategy gets you to what the question is truly asking. Then you can read the rest of the question — and pull out only the data you need to answer the question. • Absorption costing vs. variable costing: The only difference between these two costing methods is how they address fixed manufacturing costs. A typical question on this topic lists variable manufacturing costs, or fixed selling and administrative costs. Don’t be fooled! Absorption and variable costing treat these other costs in the same way, so ignore them. • Favorable vs. unfavorable variances: Of course, the word favorablemeans better or preferred. However, in cost accounting, favorable has a different meaning, depending on whether you’re talking about a cost or revenue. Less actual costs than budgeted is a favorable variance. However,more actual revenue than planned is a favorable variance. In both cases, your actual profit is more than planned. Unfavorable variances are the reverse: More actual costs and less actual revenue is unfavorable.
  • 8. • Production costs: Many cost accounting questions relate to production of a physical product (rather than a service). Make sure you’re clear on whether the question is asking about units of a product, or an amount of material needed per unit. For example, one bicycle (one unit) requires two wheels. Be clear on which item (units or wheels) you’re using when you calculate costs. • Total fixed costs vs. fixed costs per unit: Some cost accounting questions provide you with a fixed cost per unit. If you determine that you need fixed costs to answer the question, pause for a minute. Try to find totalfixed costs in the question and use that number. Fixed costs per unit should be avoided. That’s because, at some point, you sell enough to cover your costs. As a result, the additional units you produce don’t have any fixed costs attached to them. Fixed cost per unit is misleading. • Process costing: Process costing questions often address how costs move from one production department to another. Keep in mind that, almost always, material costs are put into production before labor costs. If you’re making leather baseball gloves, you need material (leather) in production before you can do anything to it (cut, sew, treat the leather, and so on). If you keep that in mind, computing material and labor costs may be easier.
  • 9. How to Determine Cost of Goods Manufactured By Mark P. Holtzman from Managerial Accounting For Dummies Cost of goods manufactured is based on the amount of work-in-process completed. This work-in-process includes costs of direct materials put into production, plus direct labor and overhead. To determine work-in-process, you enter the number of units or costs into the same outputs formula that you use to calculate direct materials put into production. Number of units manufactured Knowing how many units of direct materials each finished product requires helps you figure out how many units you manufacture and how much those units cost. For example, to make one gallon of chocolate milk, you need 0.950 gallons of whole milk and 0.05 gallons of chocolate syrup. To compute the number of units manufactured, start with the number of units of work-in-process in beginning inventory (Beginning). Add the number of units of direct materials put into production (Inputs) and then subtract the number of units of work-in-process in ending inventory (Outputs). Suppose that your chocolate milk factory started the year with 200 gallons of unmixed ingredients in the blenders. During the year, another 4,000 gallons of ingredients were taken out of storage and poured into the blenders. At the end of the year, 300 gallons of unmixed ingredients were still in the blenders (planned for production next year). Plug these numbers into the outputs formula:
  • 10. The factory completed 3,900 gallons of chocolate milk during the period. From here, you’re ready to figure out the total cost of chocolate milk manufactured and its cost per unit. Cost of goods manufactured Direct materials, direct labor, and overhead all get input into the production process. Therefore, to compute the cost of goods manufactured, think about all product costs, including not only direct materials but also direct labor and overhead. Consider the cost of goods manufactured for the chocolate milk factory. Your beginning inventory cost $2,000. The factory put $10,000 worth of direct materials into production and spent $5,000 on direct labor and another $4,000 on overhead. At the end of the year, you counted $3,000 worth of ending inventory. Feeling overwhelmed? Hang in there! To compute cost of goods manufactured, just apply the outputs formula: This result tells you that the factory’s output of chocolate milk during the year cost $18,000.
  • 11. How to Compute Direct Materials Put into Production By Mark P. Holtzman from Managerial Accounting For Dummies Although some purchased direct materials are put into production, some are stored for future use. Therefore, the amount of direct materials purchased is probably different from the amount of direct materials actually put into production. Your simple outputs formula helps explain this relationship: In this case, Beginning equals beginning inventory on the first day of the time period. Inputs refers to purchases or transfers from other parts of the company. Ending is ending inventory at the end of the last day of the time period. Finally, the Outputs value indicates what completed the production process — the stuff that’s ready for the next stage of production (or for sale to customers). You can apply this formula to the quantity of units in inventory and put into production, and also to the costs of those same units. For example, suppose that a convenience store started the year with ten cans of coffee. During the year, it bought another 200 cans of coffee. At the end of the year, it counted seven cans of coffee in stock. How many cans did the store sell? You can think of direct material storage in the same way: A factory keeps direct materials (or cans of coffee) on hand so that they’re ready to be put into production (or be sold to customers).
  • 12. Units of direct materials put into production For direct materials, you can use the outputs formula; just set your Beginning value as the number of units of beginning inventory, Inputs as the number of new units purchased, Ending as the number of units of ending inventory, and Outputs as the number of units put into production. Suppose your factory makes chocolate milk. You started with 500 gallons of chocolate syrup and then purchased another 2,000 gallons during the year. At the end of the year, you counted 400 gallons of chocolate syrup in stock. This formula computes the number of gallons of chocolate syrup put into production: During the year, 2,100 gallons were moved out of storage and put into production (to blend chocolate milk). Cost of direct materials put into production Naturally, factories need to keep track of both the quantity and the total costs of different items at each stage of the production process. To figure out total costs, you can apply the outputs formula to the total cost of direct materials. Suppose that your chocolate milk factory pays $2 for each gallon of chocolate syrup. To compute the cost of direct materials put into production, just multiply the quantities for Beginning, Inputs, and Ending by the $2 cost per unit: Your calculation reveals that you put 2,100 gallons into production, for a total cost of $4,200.
  • 13. How to Compute Equivalent Units in Cost Accounting By Kenneth Boyd from Cost Accounting For Dummies In cost accounting, equivalent units are the units in production multiplied by the percentage of those units that are complete (100 percent) or those that are in process. That covers everything. If a unit is completed and transferred out, it’s 100 percent complete. Now, that may seem obvious, but it’s a point that gets lost when accountants start this analysis. Your approach to complex analysis should be to account for the easy stuff first. The completed and transferred out units are easier to address than work in process. Say you’ve mixed enough sugar to make 600,000 units of candy. Assume that ending work in process is 25 percent complete for all components of production (material, labor, and overhead). The table below shows the computation of equivalent units. Equivalent Units of Production Units Complete Equivalent Units Completed and transferred 600,000 100 percent 600,000 Work in process, ending 600,000 25 percent 150,000 Equivalent units 750,000 Although 25 percent of the units are unfinished, in “equivalent unit talk” you can treat them as 150,000 completed units. Add them to the really completed units to get 750,000 units, which represents the number of equivalent whole units you have produced. It’s a lot easier to talk about a whole unit than some whole units and some partially completed units. The next step is to compute the cost per equivalent unit. Take the total costs of $101,800, and divide by the number of units. Remember that the
  • 14. total costs are the sum of the beginning inventory cost ($48,000) and the costs added during production ($53,800): Cost per equivalent unit = total costs ÷ number of units Cost per equivalent unit = $101,800 ÷ 750,000 Cost per equivalent unit = $0.1357 The calculation goes to four decimal places, because when you’re making candy that sells for 20 cents per unit, and you’re producing hundreds of thousands of units, every tiny fraction of a dollar counts. Now assign the cost per equivalent unit to the completed work and the WIP. The table below shows the calculation (costs are rounded). Assignment of Costs Units Cost/Unit Cost Assigned Completed and transferred 600,000 $0.1357 $81,440 Work in process, ending 150,000 $0.1357 $20,360 Equivalent units $101,800 You’ve assigned costs to both completed work and WIP. Congratulations! Maybe you should eat a pound or two of candy to celebrate. Compare Process Costing and Job Order Costing By Mark P. Holtzman from Managerial Accounting For Dummies Process costing handles the same types of manufacturing costs as job order costing. Both systems deal with tracking how manufacturing costs such as direct materials, direct labor, and overhead flow through work-in- process to finished goods and finally, when the goods are sold, to cost of goods sold. Some manufacturers make unique products, such as aircraft, made-to- order suits, or custom teddy bears. Others mass-produce large numbers of
  • 15. similar or identical items, such as soft drinks, sheets of paper, and boxes of cereal. To mass-produce products at a minimal cost, assembly lines move materials and partially finished goods from one station or department to the next until they get completed into finished goods. Job order costing accumulates costs by job, using job order cost sheets that stay with the inventory as it flows through the production process. Process costing, on the other hand, accumulates costs by department. Process costing gives each department its own separate work-in-process (WIP) account for accumulating costs and tallies costs at the end of each fiscal period; job order costing uses only a single WIP account for all unfinished jobs and tallies the cost of a job when it’s finished. Although job order costing measures the cost of each individual job, process costing measures the cost of work actually done on WIP during a period. Unlike job order costing, which sends costs directly to individual jobs, process costing uses a two-step method: 1. Sending direct materials, direct labor, and overhead costs to departments 2. Sending the department costs to the units produced
  • 16. How to Calculate Overhead Allocation By Mark P. Holtzman from Managerial Accounting For Dummies Not all companies manufacture products that require the same amount of overhead, and as a managerial account, you need to be able to calculate the overhead allocation. The following example is relatively simple because each product gets an equal amount of overhead. Suppose a simple factory makes two products — call them Product A and Product B. The factory needs no direct materials (yes, that means it makes products out of thin air; please suspend your disbelief). It paid $1,600 in direct labor to its workers and $400 for overhead, knowing that each product required half of the direct labor costs — $800 each. The $400 in overhead also gets divided equally — $200 to each product. As shown in this figure, the total cost you need to apply (in this case, $2,000) equals the total cost that you apply to your products (again, $2,000).
  • 17. But not all companies manufacture products that require the same amount of overhead, and in those cases, the calculations aren’t quite as simple. For example, suppose a similar company plans to make two products, Product J and Product K. It plans to pay $1,600 in direct labor to its workers. Product J requires 120 hours of that direct labor, while Product K requires 40 hours. The company also expects to pay $200 for rent, $150 for maintenance, and $50 for coffee. To help you keep uneven allocations straight, remember that overhead allocation entails three steps: 1. Add up total overhead. This step requires adding indirect materials, indirect labor, and all other product costs not included in direct materials and direct labor. Here, overhead is estimated to include indirect materials ($50 worth of coffee), indirect labor ($150 worth of maintenance), and other product costs ($200 worth of rent), for a total of $400. 2. Compute the overhead allocation rate by dividing total overhead by the number of direct labor hours. You know that total overhead is expected to come to $400. Add up the direct labor hours associated with each product (120 hours for Product
  • 18. J + 40 hours for Product K = 160 total hours). Now plug these numbers into the following equation: For every hour needed to make a product, you need to apply $2.50 worth of overhead to that product. Some accountants and managers refer to the overhead allocation rate as the predetermined overhead allocation rate because it needs to be estimated at the beginning of a period. 3. Apply overhead by multiplying the overhead allocation rate by the number of direct labor hours needed to make each product. Because Product J requires 120 hours, apply $300 worth of overhead ($120 hours x $2.50) to this product. Product K requires 40 hours, so apply $100 to that product.
  • 19. How to Allocate Fixed Overhead Costs in Cost Accounting By Kenneth Boyd from Cost Accounting For Dummies When cost accounting, the more accurately you allocate fixed overhead costs, the more accurately your product’s total costs are reflected. If total cost is accurate, you can add a profit and calculate an accurate sale price. To more accurately allocate fixed overhead you use cost pools and cost allocations to compute a cost allocation rate. Compute a cost allocation rate in cost accounting Say you make car tires. Your cost pool for fixed overhead includes machine depreciation, utility costs, and salary costs for your security guard. The annual budgeted costs total $120,000, and you have 20,000 total machine hours budgeted. Use these formulas and these numbers to compute your cost allocation rate: Budgeted cost allocation rate = $120,000 cost ÷ 20,000 machine hours Budgeted cost allocation rate = $6 per machine hour You determine that a budgeted quantity per unit (per tire) is 30 minutes. Here is your budgeted fixed manufacturing overhead cost per unit: Fixed overhead cost per unit = .5 hours per tire x $6 cost allocation rate per machine hour Fixed overhead cost per unit = $3
  • 20. Each tire has direct costs (steel belts, tread) and $3 in fixed overhead built into it. Next, apply actual costs and the static budget. Take the total cost pool of $120,000 and simply divide it over 12 months. Your monthly static budget is $120,000 ÷ 12 months. That’s $10,000 per month. Calculate flexible budget variances rate in cost accounting You can now calculate a fixed overhead flexible-budget variance (sometimes referred to as a spending variance). A flexible budget changes as activity levels (sales, production) change. Because fixed costs do not change within a relevant range, there is no adjustment of budgeted fixed costs from a static to a flexible budget. This holds true as long as actual costs are within the relevant range. Bad news. The static budget simply took the annual cost pool amount of $120,000 and divided by 12 months. But say total actual costs for April are $11,000. You have a variance, and it is not favorable. Here’s the formula: Fixed overhead flexible budget variance = actual cost – static budget Fixed overhead flexible-budget variance = $11,000 - $10,000 Fixed overhead flexible-budget variance = $1,000 unfavorable variance The variance is unfavorable because your actual spending ($11,000) was more than the static budget ($10,000). If you’re dealing with a spending variance, a positive number is an unfavorable variance. You spent more than planned. Use production volume variances rate in cost accounting An efficiency variance means that you used either more or less of the input (material, labor) than you planned. The variance reflects how efficiently you used your inputs to create a product or service.
  • 21. For fixed overhead, there isn’t an efficiency variance. The fixed cost is what it is. You incur the same amount of fixed costs regardless of how efficiently you produce your goods. If your actual production is higher or lower than planned, it doesn’t change your flexible budget total for fixed overhead variance. Whatcha gonna do? Instead of efficiency variance, fixed overhead variance uses something called a production-volume variance. Because fixed costs are fixed, the production volume variance measures how much output you got for the fixed costs you put in. The focus is on the output, not the amount of costs you put in (the input). This variance reveals how efficient you were at producing goods using a fixed level of budgeted costs. This variance compares budgeted fixed overhead and allocated fixed overhead, based on actual output. (That’s a mouthful.) Here’s another way of saying it: You take the budgeted fixed overhead and apply it to actual output. For fixed overhead analysis only, budgeted fixed overhead, flexible budget, and static budget all mean the same thing. This is because fixed costs don’t changes as the level of volume changes. That relationship is true when you operate within the relevant range. Assume actual tire production for April is 3,500. The table shows budgeted fixed overhead applied to actual output. Budgeted Fixed Overhead — Applied to Actual Output Budgeted cost allocation rate (A) $6 per unit Budgeted machine hours per tire (B) 0.5 (30 minutes) Actual tires produced (C) 5,000 Budgeted overhead applied (A x B x C) $15,000 Now that you have the budgeted fixed overhead applied, you can compute production volume variance:
  • 22. Production volume variance = budgeted fixed overhead - budgeted fixed overhead applied Production volume variance = $10,000 - $15,000 Production volume variance = ($5,000) favorable variance The negative variance is favorable because this is a cost variance. Spending less is what you want to do. What this variance tells you is that even though you planned to spend only $10,000 in fixed costs, you were able to produce more tires for the same budgeted amount of money. In theory, producing 5,000 tires should have cost you $15,000 in budgeted fixed costs. However, you made them within the $10,000 budget. This saved you $5,000, because you were more efficient at producing your goods than you planned. What you saw for fixed overhead analysis were two variances: the flexible budget variance and the production volume variance. How to Determine the Standard Cost Per Unit By Kenneth Boyd, Lita Epstein, Mark P. Holtzman, Frimette Kass- Shraibman, Maire Loughran, Vijay S. Sampath, John A. Tracy, Tage C. Tracy, and Jill Gilbert Welytok from Accounting All-in-One For Dummies To find the standard cost, you first compute the cost of direct materials, direct labor, and overhead per unit. Then you add up these amounts. The figure applies this approach to Band Book Company. To calculate the standard cost of direct materials, multiply the direct materials standard price of $10.35 by the direct materials standard quantity of 28 pounds per unit.
  • 23. The result is a direct materials standard cost of $289.80 per case. To compute direct labor standard cost per unit, multiply the direct labor standard rate of $12 per unit by the direct labor standard hours per unit of 4 hours. The standard cost per unit is $48 for direct labor. Now multiply the overhead allocation rate of $10 per hour by the direct labor standard hours of 4 hours per unit to come to a standard cost of overhead per unit of $40. Add together direct materials, direct labor, and overhead to arrive at the standard cost per unit of $289.80 + $48 + $40 = $377.80. Making a single case of books costs Band Book $377.80. Understanding Activity-Based Costing By Stephen L. Nelson from QuickBooks 2011 All-in-One For Dummies To create an activity-based costing (ABC) product line income statement, you attempt to trace the overhead cost directly to products or services. For example, suppose that in the case of an imaginary hot dog stand business, the rent expense is necessary because you need an electrical hookup to keep the pot of chili heated. Perhaps you also need an electrical hookup to run the can opener that you use (surreptitiously) to open the cans of chili needed to refill the pot. This means, then, that the rent expense really can’t be split between regular hot dogs and chilidogs. It needs to be allocated to chilidogs. You can treat the supplies expense in a very similar way. Suppose also that, based on your observations, a regular hot dog customer grabs two napkins for his hot dog, whereas a chilidog customer grabs eight napkins for his chilidog. In this case, you can use this information to better allocate the supplies expense. Using this napkin usage information, you can calculate which percentage of the supplies expense is used by regular hot dog customers and chilidog customers. If regular hot dog customers use 4,000 out of a total of 20,000 napkins, 20 percent of the napkins are going to regular hot dog customers. So you can allocate $200 of the $1,000 supplies expense to regular hot
  • 24. dogs, and the remaining $800 of supplies expense should be allocated, or traced, to the chilidog product line. All you’re trying to do is trace overhead costs, or operating expenses, to product lines. The wages expense of $4,000 probably works in a very similar fashion. Suppose that all the $4,000 of wages expense goes to serving customers hot dogs. Furthermore, suppose that the process of serving a regular hot dog to a customer requires two steps. These steps are known as cost drivers. The term cost drivers simply suggests that the number of steps an employee takes to serve a customer is a good base on which to allocate the wages expense that comprises the activity of serving. By looking at the total number of steps required to serve regular hot dogs and the total number of steps required to serve chilidogs, you can trace the wages expense to the individual product lines. For example, if you sell 2,000 regular hot dogs and each hot dog requires two steps, regular hot dogs require 4,000 steps in total. If you sell 2,000 chilidogs and each chilidog requires five steps, the chilidog product line requires 10,000 steps. To calculate the percentage of the wages expense that goes into preparing regular hot dogs, you make the following calculation: 4,000 (the number of steps required for regular hot dogs) / 14,000 (the total number of steps) x $4,000 This calculation returns the value $1,143.00. In a similar fashion, you can use the steps information to allocate wages expense to the chilidog product line. 10,000 (the number of steps to prepare chilidogs) / 14,000 (the total steps) x $4,000 This calculation returns the value $2,857.00. An ABC approach to product-line profitability often produces surprising results.
  • 25. ABC Income Statement by Product Line $2.50 Hot Dogs $4.00 Chilidogs Total Sales revenue (2,000 sold in each product line) 5,000 8,000 13,000 Cost of goods sold $.15 buns 300 300 600 $.40 hot dogs 800 800 1,600 $.40 of chili for each chilidog 0 800 800 Total cost of goods sold 1,100 1,900 3,000 Gross margin 3,900 6,100 10,000 Operating expenses Rent 0 1,000 1,000 Wages 1,143 2,857 4,000 Supplies 200 800 1,000 Total operating expenses 1,343 4,657 6,000 Net profit 2,557 1,443 4,000 Separable Cost Reduction in Cost Accounting By Kenneth Boyd from Cost Accounting For Dummies In cost accounting, the cost of goods available for sale represents the product’s total costs. Total costs have two components — joint costs and separable costs. When possible, you want to reduce separable costs, but first take a look at your company’s joint costs. Assume you manufacture leaf blowers. Your two products are heavy-duty blowers and yardwork blowers. The separable costs are $1,200,000 for the heavy-duty blower and $912,000 for the yardwork blower. If you know the separable costs and the cost of goods available for sale, you can compute the joint cost allocation. This table shows the process. Joint Cost Allocation Heavy-Duty Yardwork Total Cost of goods available for sale $1,751,163 $1,260,837 $3,012,000
  • 26. Less separable costs $1,200,000 $912,000 $2,112,000 Equals joint cost allocation $551,163 $348,837 $900,000 Each company division provides the separable costs. So altogether, this table gives you a joint cost allocation. Now assume that the heavy-duty blower division is able to sharply reduce its separable costs to an amazingly low $500,000. The first table listed heavy-duty separable costs of $1,200,000. Consider what now happens to heavy-duty’s joint cost allocation. Take a look at the next table. Cost Allocation — Less Heavy Duty Separable Costs Heavy-Duty Yardwork Total Cost of goods available for sale $1,751,163 $1,260,837 $3,012,000 Less separable costs $500,000 $912,000 $1,412,000 Equals joint cost allocation $1,251,163 $348,837 $1,600,000 Heavy-duty’s joint cost allocation increases to $1,251,163 (from $551,163). That doesn’t seem right. The goal is to analyze costs to reduce or eliminate them. If you do, supposedly you increase your profits. In this case, the heavy-duty division’s reducing separable costs increased its joint cost allocation. There doesn’t seem to be a benefit to operating more efficiently. Here’s an explanation: The gross margin percentage method (calculated as gross margin ÷ total sales value x 100) locks in total costs as a percentage of sales value. If the gross margin is about 12.5 percent of sales value, it means that costs must be about 87.5 percent of sales value. For heavy- duty, that 87.5 percent total cost number is $1,751,163. Those costs are either separable or joint costs. If one increases, the other decreases. The heavy-duty manager may have a problem with this process. The manager works hard (using good old cost accounting) to lower the separable costs. The manager’s “reward” is a higher joint cost allocation. The heavy-duty division has lowered costs but doesn’t get any savings in total costs.
  • 27. The constant gross margin percentage method clarifies the revenue and profit calculations company-wide. This method eliminates some of the variation between company divisions. Although some managers may complain, each division has the same gross margin percentage. The process makes managing company profit easier. This is one of those “Here’s why the chief financial officer (CFO) makes the big bucks” moments. As CFO, you explain the gross margin percentage method to the heavy-duty division manager. The goal is to allocate joint costs so that each product maintains the same gross margin percentage of about 12.5 percent. If a division reduces separable costs, it must get a bigger joint cost allocation —otherwise, the gross margin percentage would increase. Now heavy-duty’s manager should be evaluated based on the successful cost reduction. The manager had a success, and you want to encourage more cost savings. Although the gross margin percentage process requires a bigger joint cost allocation, that must not take away from the manager’s good performance. Cost Accounting: Joint Cost Allocation and Gross Margin Percentage By Kenneth Boyd from Cost Accounting For Dummies In cost accounting, the cost of goods available for sale represents the product’s total costs. Total costs have two components — joint costs and separable costs. Assume the cost of goods available for sale are $1,751,163 and $1,260,837 for the heavy-duty blower and the yardwork blower. Say the separable costsare $1,200,000 and $912,000. If you know the separable costs and the cost of goods available for sale, you can compute the joint cost allocation. The first table shows the process. Joint Cost Allocation Heavy-Duty Yardwork Total Cost of goods available for sale $1,751,163 $1,260,837 $3,012,000
  • 28. Less separable costs $1,200,000 $912,000 $2,112,000 Equals joint cost allocation $551,163 $348,837 $900,000 Each company division provides the separable costs. So altogether, the table gives you a joint cost allocation. Now calculate the gross margin percentage. Say your sales values are $2,000,00 and $1,440,000 for heavy-duty and yardwork blowers. The total cost is the cost of goods available for sale from the first table. The gross margin percentage is the gross margin divided by the sales value. For each product, the gross margin percentage is the same (12.442 percent) as the company’s overall gross margin. Verifying Gross Margin Percentage Heavy-Duty Yardwork Total Sales value (A) $2,000,000 $1,440,000 $3,440,000 Total cost (B) $1,751,163 $1,260,837 $3,012,000 Gross margin (A – B) $248,837 $179,163 $428,000 Gross margin percentage 12.442 12.442 Here’s the point of this table: it uses the traditional formula to compute gross margin and gross margin percentage. The table verifies that the calculations are correct. If the heavy-duty product has the higher sales value, it ends up with a higher gross margin in dollars than the yardwork product. However, both sale values are multiplied by the same gross margin percentage. Both products have a gross margin of about 12.5 percent (rounded). That means that about 87.5 percent of sales value represents cost of goods available for sale. Variable and Absorption Costing in Cost Accounting By Kenneth Boyd from Cost Accounting For Dummies
  • 29. Variable and absorption costing generate different levels of cost and net income in cost accounting, so it’s important to understand the differences so you can select a costing method to use internally for decision-making. Say your business manufactures handsaws. Here is a summary of production, sales, and costs in Year 1. Year 1 Production — Sales and Costs Production (units) 3,000 Sales (units) 2,500 Sales (at $25 per unit) $62,500 Fixed manufacturing costs $21,000 All other product costs $33,000 Because you didn’t sell all of your production, you created ending inventory: Ending inventory = units produced – units sold Ending inventory = 3,000 – 2,500 Ending inventory = 500 Your fixed manufacturing costs are $7 per unit produced ($21,000 ÷ 3,000 units). Absorption costing requires you to assign $3,500 of fixed manufacturing costs to ending inventory ($7 x 500 units). The next table outlines the profit in Year 1, comparing variable and absorption costing. Year 1 Profit — Variable Versus Absorption Costing Variable Costing Absorption Costing Sales (at $25 per unit) $62,500 $62,500 Fixed manufacturing costs $21,000 $17,500 All other costs $27,500 $27,500 Total costs $48,500 $45,000 Profit $14,000 $17,500
  • 30. Absorption costing deferred $3,500 of fixed manufacturing costs. The fixed manufacturing costs are only $17,500. You see that absorption costing has a $3,500 higher profit ($17,500 versus $14,000). In Year 2, assume that your sales and sales price are the same. You also sell all your production, plus the 500 units that were in ending inventory. Your sales (2,500 units) are 500 units more than your production (2,000 units). Because you produced less in Year 2, the all-other-cost number declines to $22,500. Less production means less cost. Check out this next table. Year 2 Production — Sales and Costs Production (units) 2,000 Sales (units) 2,500 Sales (at $25 per unit) $62,500 Fixed manufacturing costs $21,000 All other costs $22,500 Variable and absorption costing are the same if you sell all of your production. You don’t produce any ending inventory, so you don’t defer any fixed manufacturing costs into inventory items. Here is the profit in Year 2. Year 2 Profit — Variable Versus Absorption Costing Variable Costing Absorption Costing Sales (at $25 per unit) $62,500 $62,500 Fixed manufacturing costs $21,000 $24,500 All other costs $27,500 $27,500 Total costs $48,500 $52,000 Profit $14,000 $10,500
  • 31. Five hundred units from Year 1 ending inventory are sold in Year 2. In the third table, production of 2,000 is 500 units less than sales of 2,500. You had 500 units available for sale at the beginning of Year 2. Fixed manufacturing costs for Year 2 are the same for both methods ($21,000). However, absorption costing added the $3,500 fixed manufacturing cost that was deferred in Year 1. The fixed manufacturing cost is $24,500 ($21,000 + $3,500). The variable costing profit in Year 2 is $3,500 higher than the absorption costing profit ($14,000 versus $10,500). In Year 1, variable costing profit was $3,500 lower than the absorption costing. When Year 1 ending inventory is sold in Year 2, absorption picks up the fixed manufacturing cost that was deferred. Over two years, all the production is sold. The total profit over two years is the same for both costing methods. You’re probably wondering about which method to use. Your profit eventuallyis the same under either method. In the long run, there is no advantage to using one method over another. You should select a method and stick with it. By doing so, you’re applying the principle of consistency. For a financial statement reader to compare your results year by year, you need to use the same method. It’s the old idea of an apples-to-apples comparison. How to Implement Variance Analysis in Cost Accounting By Kenneth Boyd from Cost Accounting For Dummies In cost accounting practice, a spending variance occurs when the rate or price you pay different from your budget. An efficiency variance is incurred when you use more or less than you plan. You implement variance analysis to understand differences between planned and actual costs. You hope to learn from the analysis and reduce your costs moving forward.
  • 32. Compare the use of the term flexible budget variance in cost accounting Flexible budget variance is used in the fixed overhead costs section earlier this chapter. However, flexible budget variance has a different meaning for variable overhead. For variable overhead, the flexible budget variance is the sum of two variances. Flexible budget variance (also variable overhead variance) = spending variance + efficiency variance To keep this straight in your head, flexible budget variance refers to one variance for fixed overhead. Flexible budget variance is the sum of two variances for variable overhead. Compute spending variance and efficiency variance in cost accounting The formula for price variance is: Price variance = (actual price - budgeted price) x (actual units sold) The price variance formula is similar to the variable overhead spending variance. Instead of actual units sold, this variance uses actual units produced. That’s because you’re applying overhead to production. You use actual and budgeted costs instead of prices. All that being said, here’s the formula: Variable overhead spending variance = ($2.11 - $1.80) x (18,000) Variable overhead spending variance = $5,580 It’s an unfavorable variance, because you spent more than you planned. Once again, if you get a positive number for a cost variance, it’s unfavorable. Now consider the variable overhead efficiency variance. If you have an efficiency variance, you used more or less than you planned. You need two calculations for this variance; then you compute the difference between the two amounts. Here’s the first calculation:
  • 33. Actual quantity x budgeted price = 18,000 units x $1.80 Actual quantity x budgeted price = $32,400 The second calculation is budgeted variable overhead applied to actual output. Budgeted Variable Overhead — Applied to Actual Output Flexible-budget machine hours per output (A) 4 Actual output (units) (B) 5,000 Flexible-budget overhead per machine hour (C) $1.80 Budgeted variable overhead applied (A x B x C) $36,000 The variable overhead efficiency variance is the difference between (actual quantity x budgeted price) and (budgeted variable overhead applied to actual output). Here’s the variance: Variable overhead efficiency variance = $32,400 - $36,000 Variable overhead efficiency variance = ($3,600). Because this is a negative cost variance, it’s favorable. The variable overhead variance is the sum of the spending variance and the efficiency variance. Here’s your variance calculation: Variable overhead variance = $5,580 + ($3,600) Variable overhead variance = $1,980 Because the positive cost variance is unfavorable, that means your costs for variable overhead were more than planned. One point bears repeating: You have a variance because you spent more or less than planned (the price or rate you paid had a variance), or you used more or less than planned. You can apply that thought to just about any variance in cost accounting.
  • 34. Attach Costing Concepts to Variance Analysis in Cost Accounting By Kenneth Boyd from Cost Accounting For Dummies When cost accounting, you can allocate costs at different levels: unit level, batch level, and so forth. A batch is a group of units, just like a batch of cookies you bake in the oven. You can analyze how you produce batches (for example, batches of a simple, high-volume product compared to batches of a complex, low-volume product) and possibly reduce your costs. That’s better than spreading costs uniformly, which can result in distortions. Say you make glass bottles. You’re in a great environment for cost allocation by batch. A machine shapes the glass into bottles and imprints your logo. Your static budget assumes that the cost of loading and unloading bottles is allocated based on a batch of 50 bottles. Here is an analysis of your loading costs. Glass Bottles — Labor Cost Allocation by Batch Actual Static Bottles produced (A) 10,000 12,000 Batch size (B) 50 48 Batches produced (A × B) 200 250 Labor hours per batch 3 2.5 Total labor hours (C) 600 625 Cost per labor hour (D) $22 $21 Total labor costs (C × D) $13,200 $13,125 You have just traced labor costs at a different level in cost hierarchy. Instead of tracing costs to a unit, you’ve traced costs to a batch. It’s not hard to apply flexible budget techniques to a batch. When you know how to apply the per-unit static budget amount to actual production, it’s a
  • 35. short step to applying the per-batch static budget amount to actual production. This table calculates flexible budget cost. Glass Bottles — Flexible Budget Calculation Actual units 10,000 Divide by static batch size 48 Equals number of batches 208 Multiply by static labor hours per batch 2.5 Equals flexible budget labor hours 521 Multiply by static labor rate per hour $21 Equals flexible budget labor costs $10,938 The best way to reduce costs is to analyze multiple variances (in fact, analyze as much data as you can). You see labor price and efficiency variances in tables earlier in the chapter. Now apply the concepts at the batch level. These tables show a labor price variance calculation and a labor efficiency variance. Glass Bottles — Labor Price Variance Actual Quantity × Actual Price Actual Quantity × Budgeted Price 600 hours 600 hours Multiply by $22/hour Multiply by $21/hour Equals $13,200 (A) Equals $12,600 (B) Labor price variance (A – B) $600 Because the price variance relates to cost, the negative variance of $625 is favorable. You spent less than planned in the static budget. Glass Bottles — Labor Efficiency Variance Actual Quantity × Budgeted Price Budgeted Quantity × Budgeted Price 600 hours 625 hours Multiply by $21/hour Multiply by $21/hour Equals $12,600 (A) Equals $13,125 (B)
  • 36. Labor efficiency variance (A – B) -$525 Favorable The negative labor cost variance is favorable. You spent less than planned. Now calculate the flexible budget variance: Flexible budget variance = price variance + efficiency variance Flexible budget variance = $600 + -$525 Flexible budget variance = $75 How to Determine Variances in Cost Accounting By Kenneth Boyd from Cost Accounting For Dummies When cost accounting, if you think investigating a variance is tough, try ignoring one sometime. Yes, following up takes time and may involve phone calls, discussions with your staff, or additional research into supplier relationships. But if the variance is relevant, you gotta do it. In accounting, you see the term relevance used frequently. Relevance refers to something that’s worth noticing. You need to decide what variances are important to you. Here’s some simple advice: If a variance amounts to a big percentage difference between actual results and plan, or if it amounts to a big out-of-pocket cash difference, you should investigate. Don’t waffle on the impact of defective products in cost accounting If you produce defective products, you’re spending production costs on goods that cannot be sold to customers. You may be able to repair the product and sell it, but that will require more costs, too. So defective products result in unfavorable cost variances. You spend more than you planned. You also may see a decline in sales, as unhappy customers stop buying your product. The sales decline means an unfavorable sales variance. You sell less than you planned.
  • 37. A defective product will kill you ten ways to Sunday. Any defect in any product qualifies. The impact won’t be good. The first thing you don’t need is diminished sales, and the last thing you need is dozens of bad comments on a consumer website. This isn’t just a matter of a cost accounting variance. A defective product is the core of ruined image, publicly aired complaints, and a general undermining of confidence in your entire product line. Simple advice is for you to look at the defect, find the cause, correct the cause, and make things right with your customer base. And for that matter, take what steps are necessary to reduce the chances of producing defective products in the future. The time investment is worth the effort. You don’t have to spend a lot of time on the Internet to find stories about companies that were seriously damaged by making defective products and failed to handle the problem. Pick a guideline for variances in cost accounting For variances other than serious product defects, pick a dollar amount or percentage as a big red flare. That is, choose a guideline for investigating variances. Say you’re making watches. It doesn’t matter whether you put out costly Rolex watches at $15,325 or inexpensive Casio watches at $6.95. Each line suggests a guideline for concern. You might decide that a variance of 10 percent or more from your standard amount is an issue. If your standard direct materials cost (cost x quantity) is $50,000, a variance, either favorable or unfavorable, of $5,000 or more ($50,000 x 10%) should be reviewed. The same is true if your standard direct material cost is $5,000,000. It’s still 10 percent or more. Big-ticket items can absorb a variance better than small-ticket items. An affluent customer base is likely to accept price increases, which overcomes variances. The economic law is that consumers buy more of a good when its price is lower and less when its price is higher; however, that law doesn’t seem to apply to luxury items.
  • 38. Keep in mind that the standards you create in planning (costs, quantities, and so forth) are only an estimate. You can expect some difference between standard and actual amounts. You don’t have a crystal ball to get the standards exactly right. Finally, your company should include the guidelines for variance investigation in your written accounting procedures. That way, everyone in your organization knows the ground rules for variances. Continuous improvement and benchmarking in cost accounting Continuous improvement is the process of continually improving your efficiency and thereby reducing costs over time. By reducing costs a small amount each year, you increase your profit over time. You can find areas to reduce costs by investigating variances. Over time, it may be more difficult to find cost reductions. As with many things in life, you try to do the easy fixes first; you make those changes that are obvious. As time goes on, the changes make your production more efficient. Finding new changes gets harder, but great companies stay at it. They make the effort to find more ways to reduce costs without sacrificing product quality. If you want to compete, it’s a good idea to compare your performance to other companies in your industry. Benchmarking is the process of comparing your company’s performance to that of similar companies. That performance could mean many things: how quickly you deliver a service or how well you produce a product that minimizes defects. If you do competitive benchmarking, you’re in good company. Some of the largest corporations in the world have such programs. The purpose of benchmarking is to suggest areas where you can make improvements. If, for example, you can produce and deliver a product faster or reduce costs without affecting product quality, your company can be more profitable.
  • 39. What you measure relates to what you do. If you’re in a service industry, you might benchmark how quickly you do things: how long a customer waits in line at your store or how quickly can you make a home delivery. If you manufacture products, you might benchmark product quality. Quality might mean tracking the number of product defects or the percentage of sales that are returned by customers.