Download as PDF, PPTX
![@lbernail
Kubelet logs
remote_runtime.go:434] Status from runtime service failed: rpc error: code = DeadlineExceeded desc =
context deadline exceeded
kubelet.go:2130] Container runtime sanity check failed: rpc error: code = DeadlineExceeded desc =
context deadline exceeded
kubelet.go:1803] skipping pod synchronization - [container runtime is down]
"Status from runtime service failed"
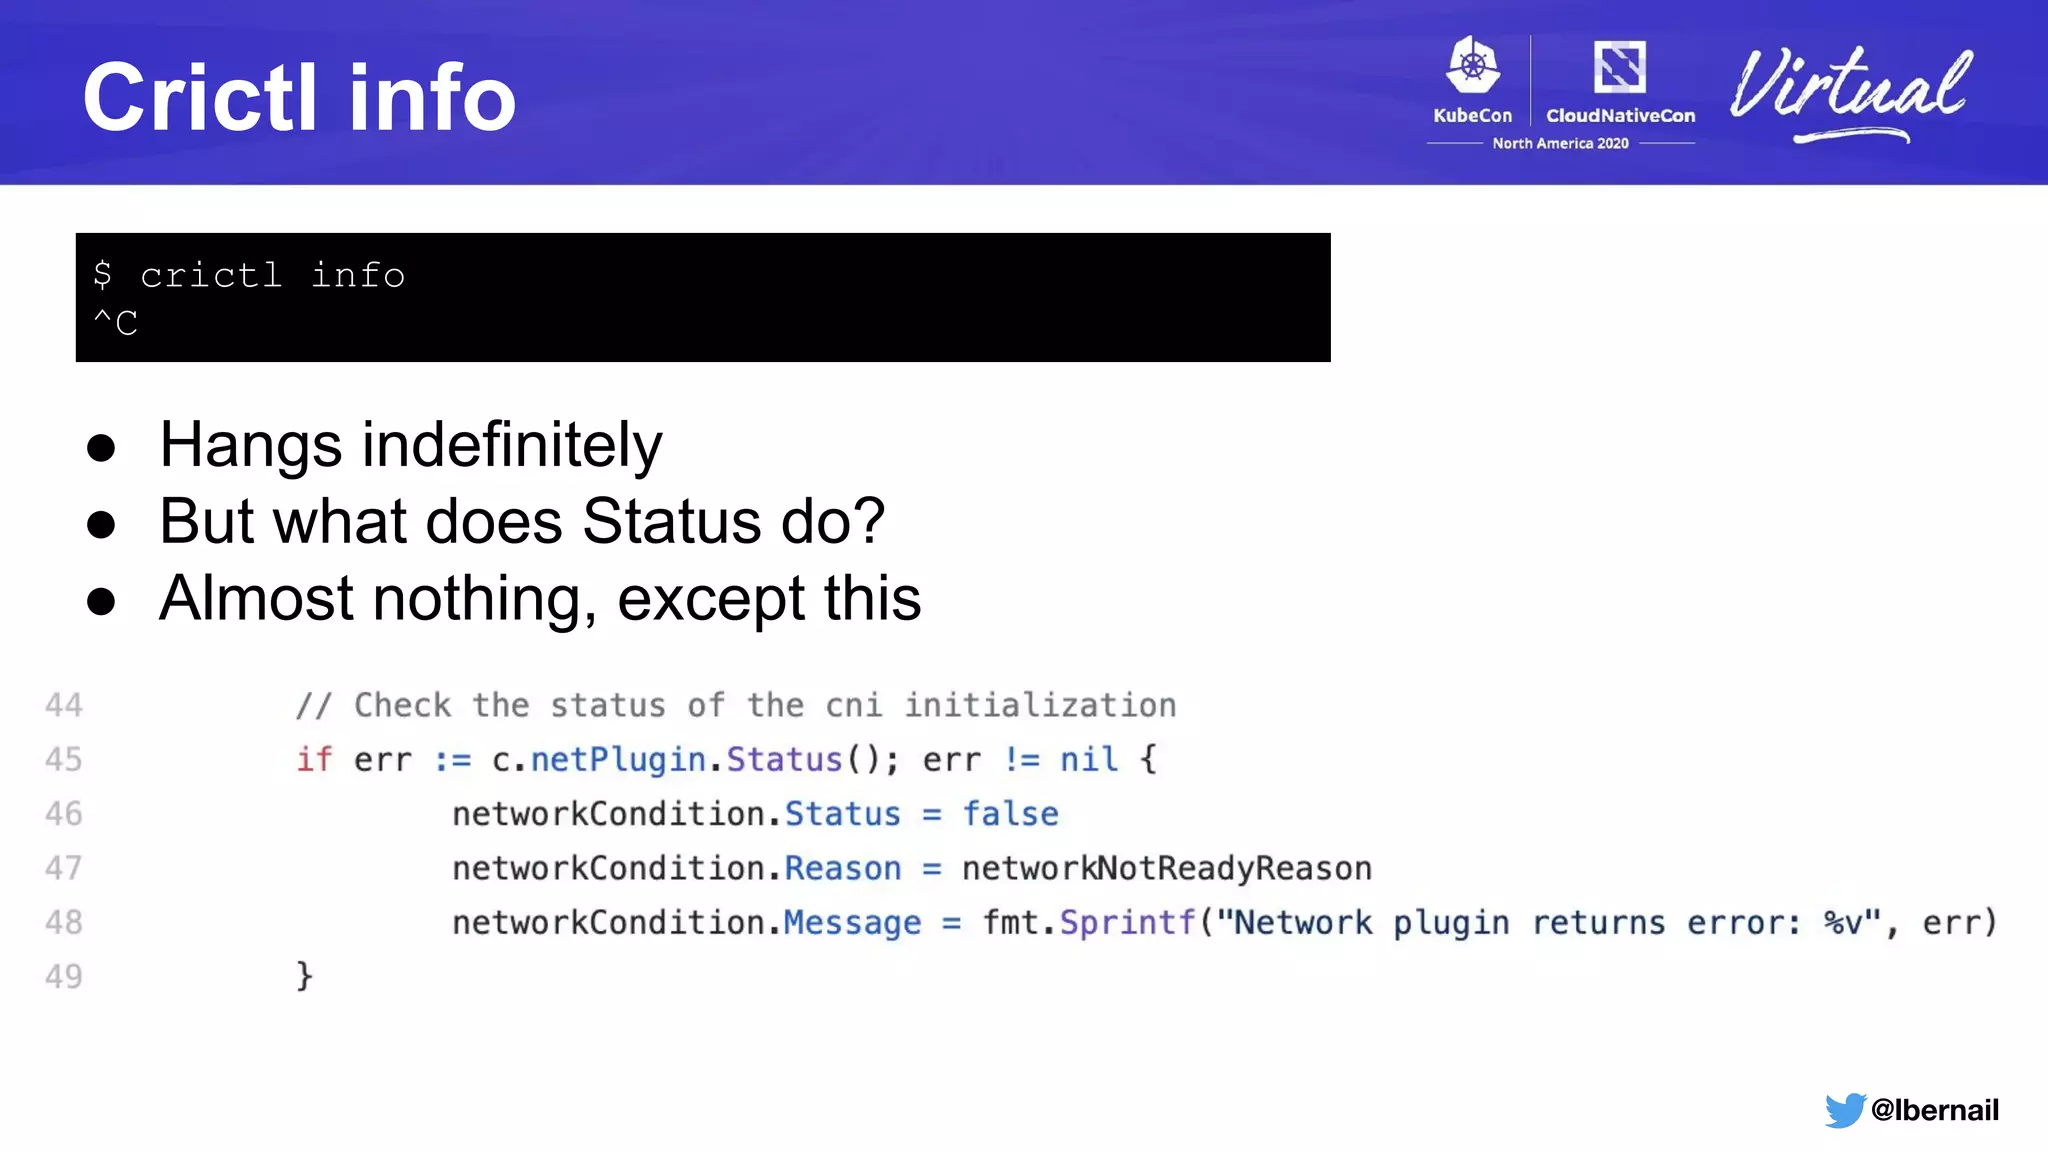
➢ Is there a CRI call for this?
Something is definitely wrong](https://image.slidesharecdn.com/howtheoom-killerdeletedmynamespace-201120185914/75/How-the-OOM-Killer-Deleted-My-Namespace-32-2048.jpg)
![@lbernail
Containerd goroutine dump
containerd[737]: goroutine 107298383 [semacquire, 2 minutes]:
containerd[737]: goroutine 107290532 [semacquire, 4 minutes]:
containerd[737]: goroutine 107282673 [semacquire, 6 minutes]:
containerd[737]: goroutine 107274360 [semacquire, 8 minutes]:
containerd[737]: goroutine 107266554 [semacquire, 10 minutes]:
Blocked goroutines?
The runtime error from the kubelet also happens every 2mn
containerd[737]: goroutine 107298383 [semacquire, 2 minutes]:
...
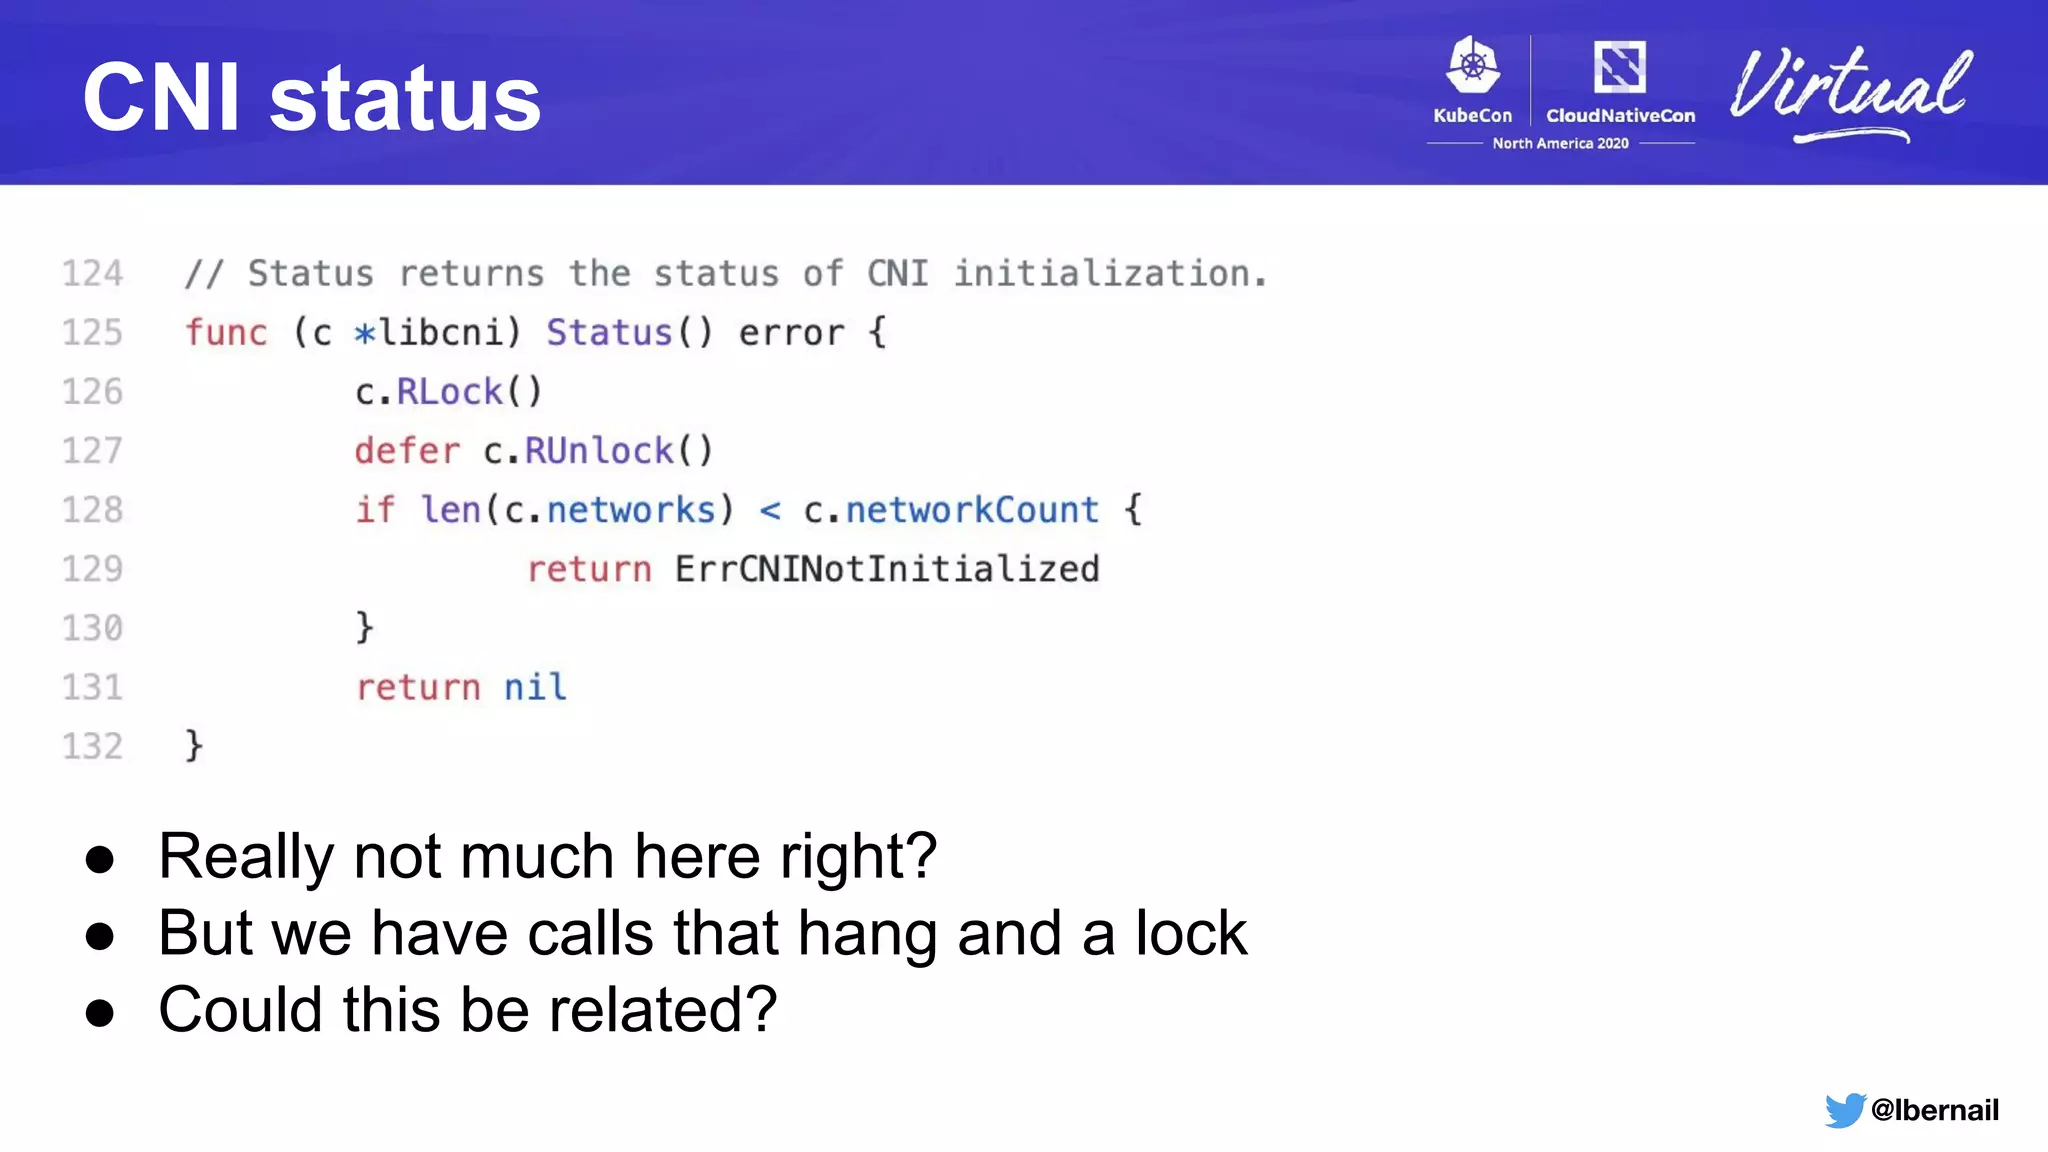
containerd[737]: .../containerd/vendor/github.com/containerd/go-cni.(*libcni).Status()
containerd[737]: .../containerd/vendor/github.com/containerd/go-cni/cni.go:126
containerd[737]: .../containerd/vendor/github.com/containerd/cri/pkg/server.(*criService).Status(...)
containerd[737]: .../containerd/containerd/vendor/github.com/containerd/cri/pkg/server/status.go:45
Goroutine details match exactly the codepath we looked at](https://image.slidesharecdn.com/howtheoom-killerdeletedmynamespace-201120185914/75/How-the-OOM-Killer-Deleted-My-Namespace-36-2048.jpg)
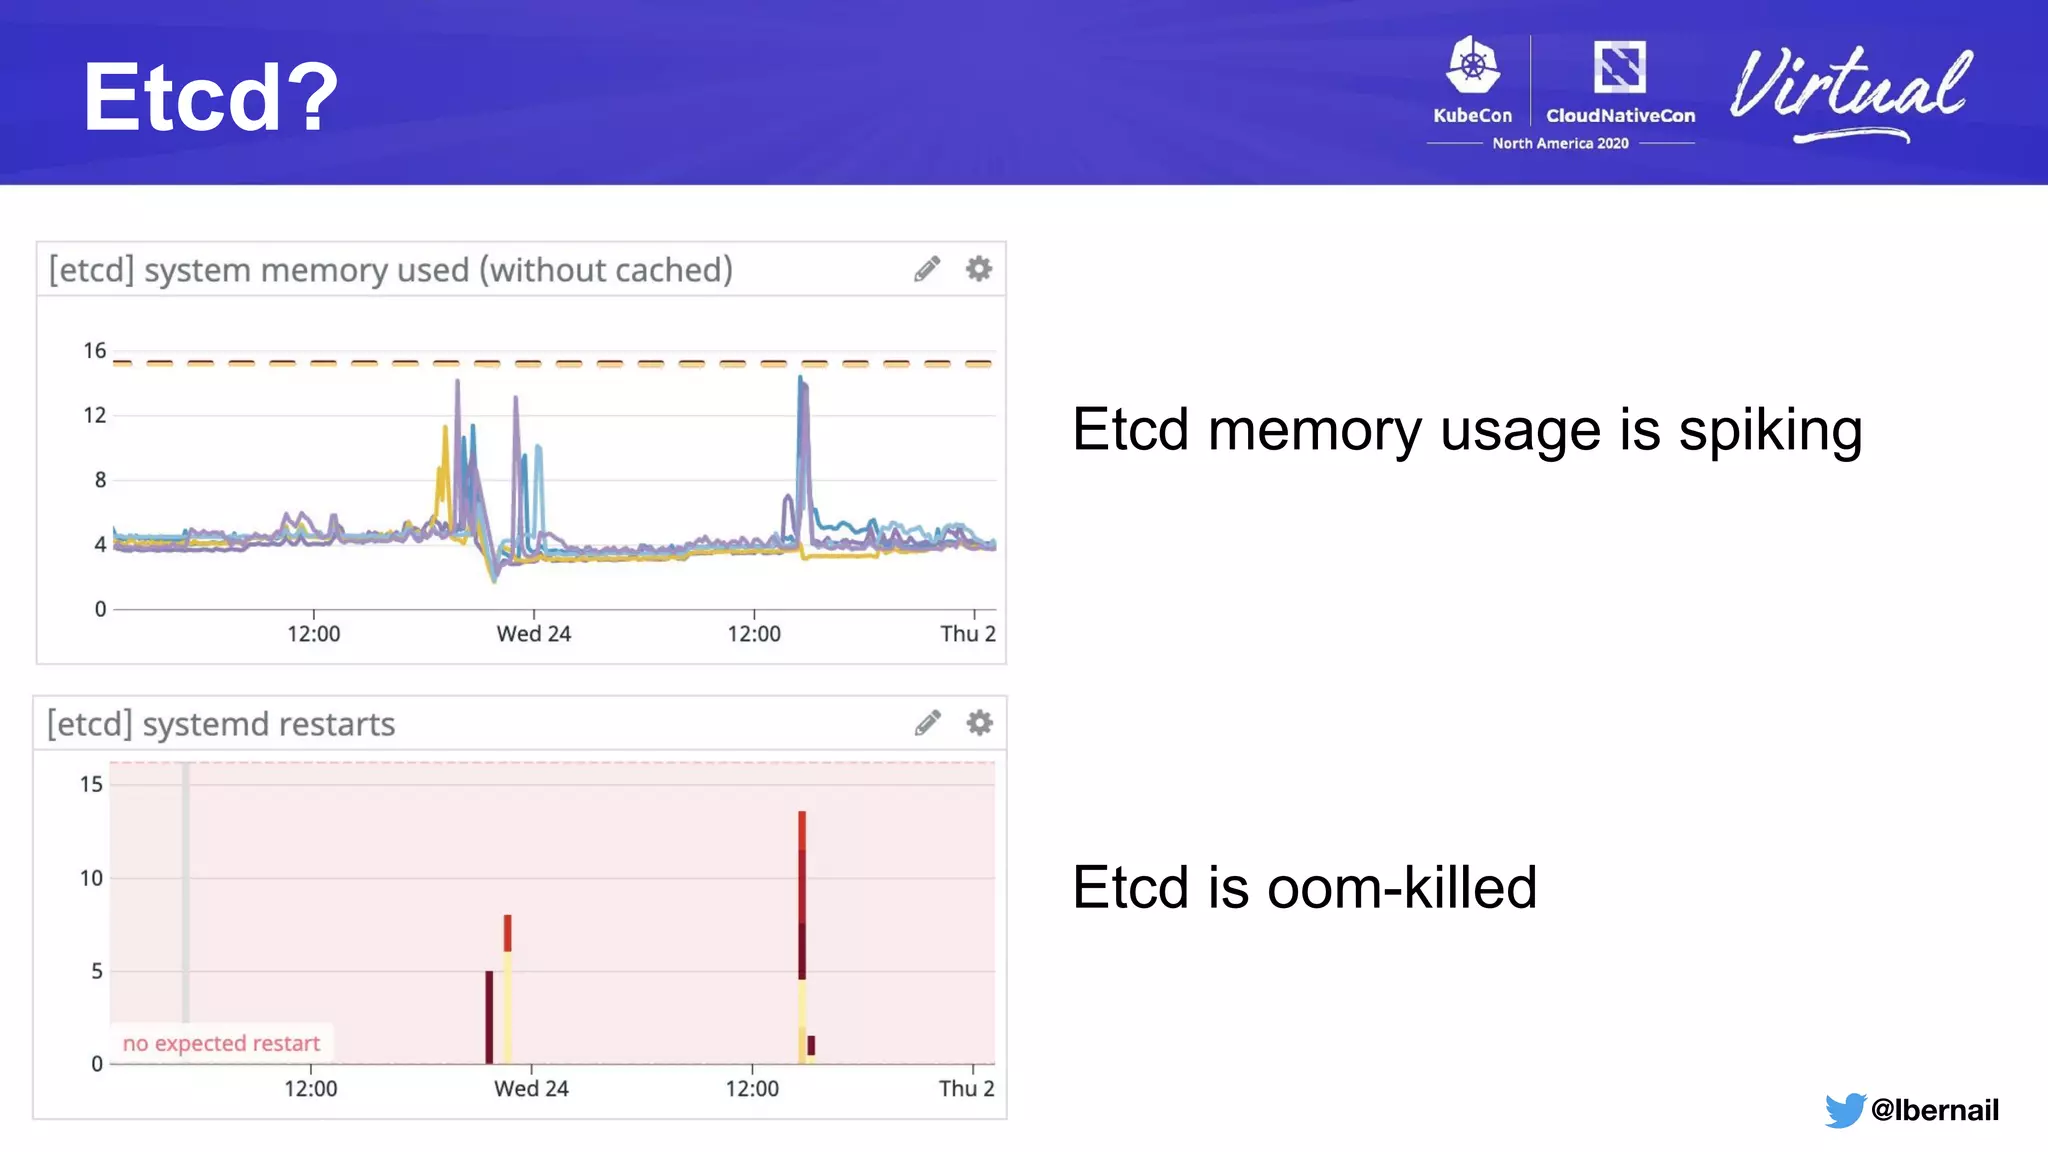
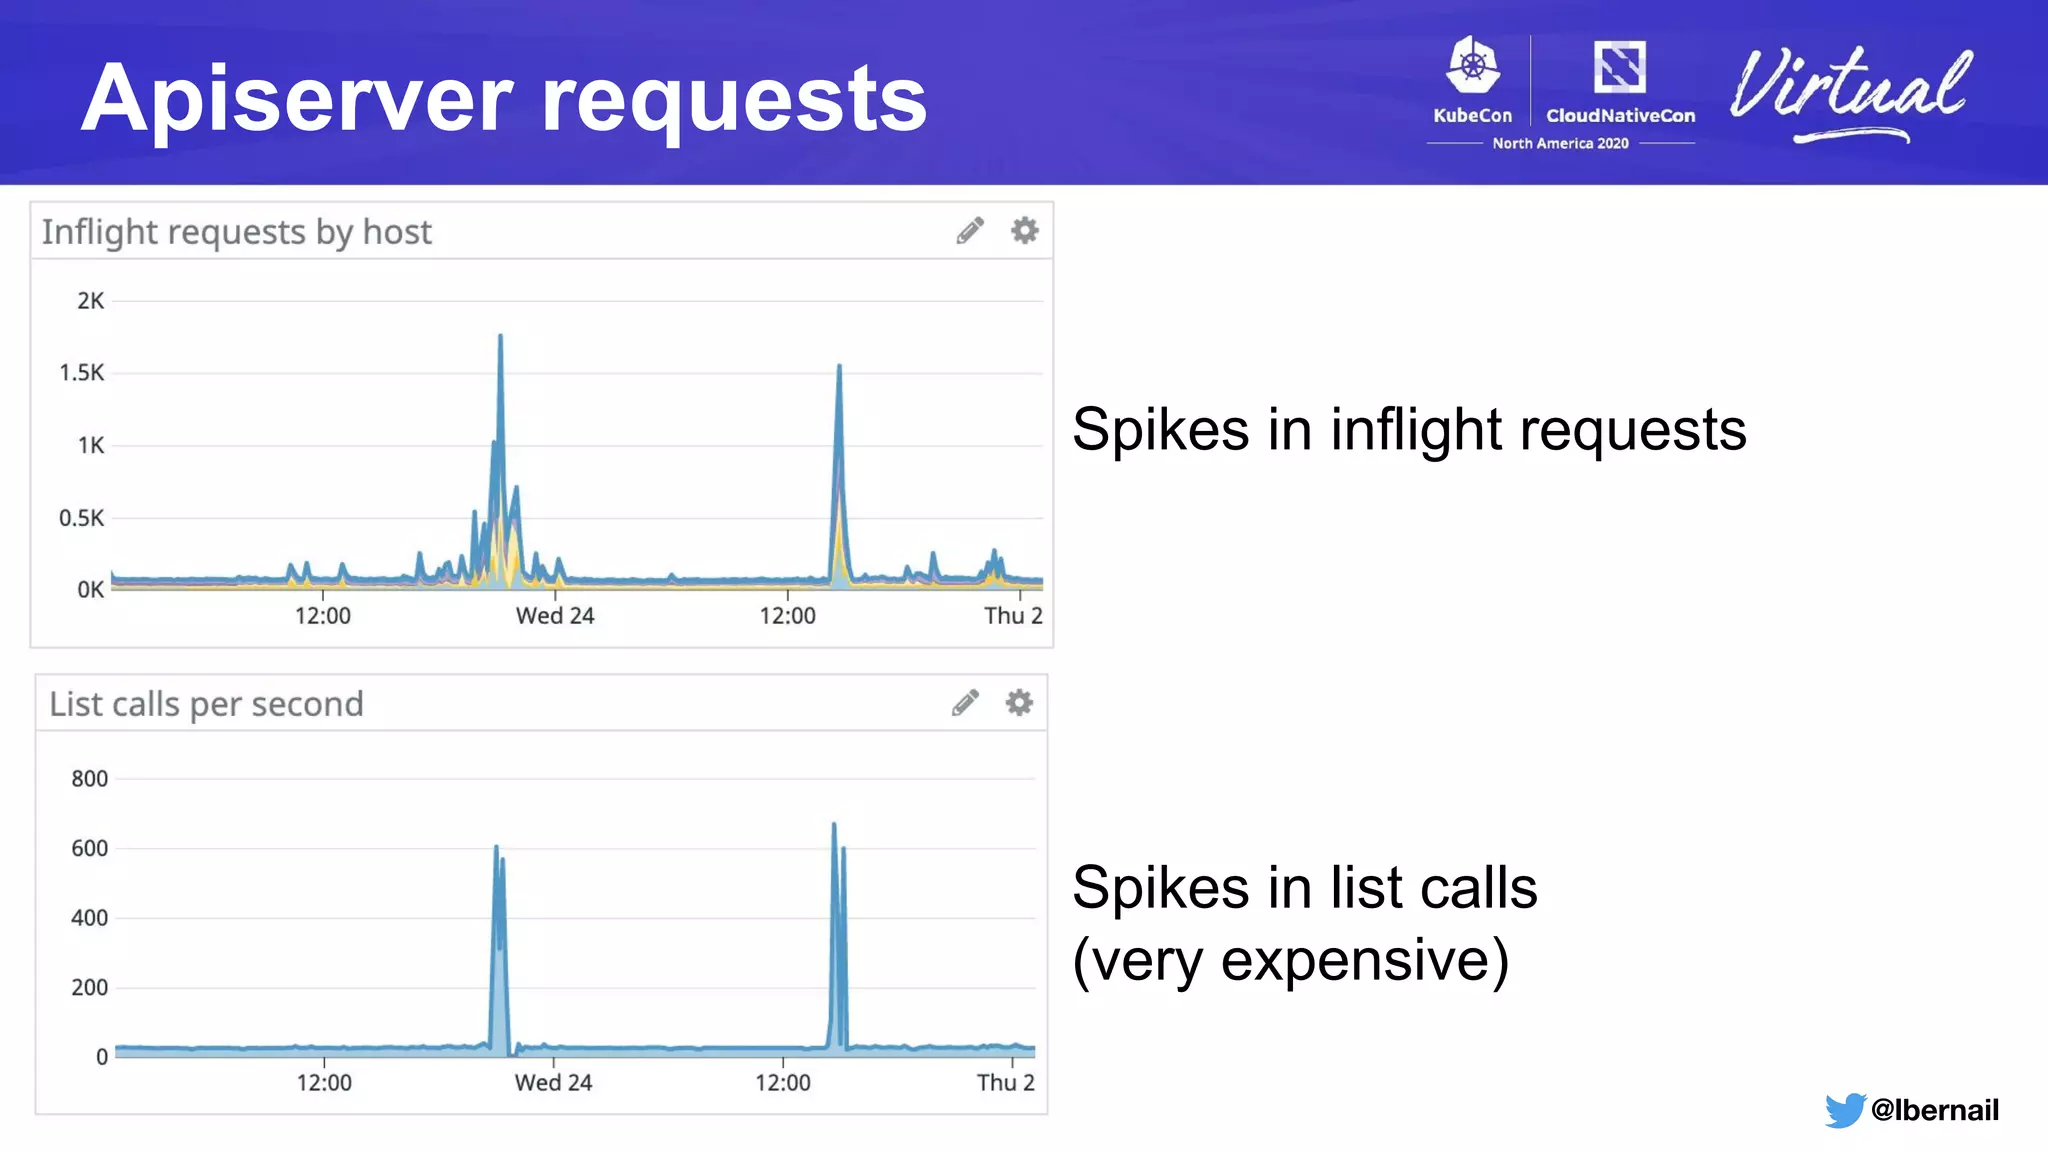
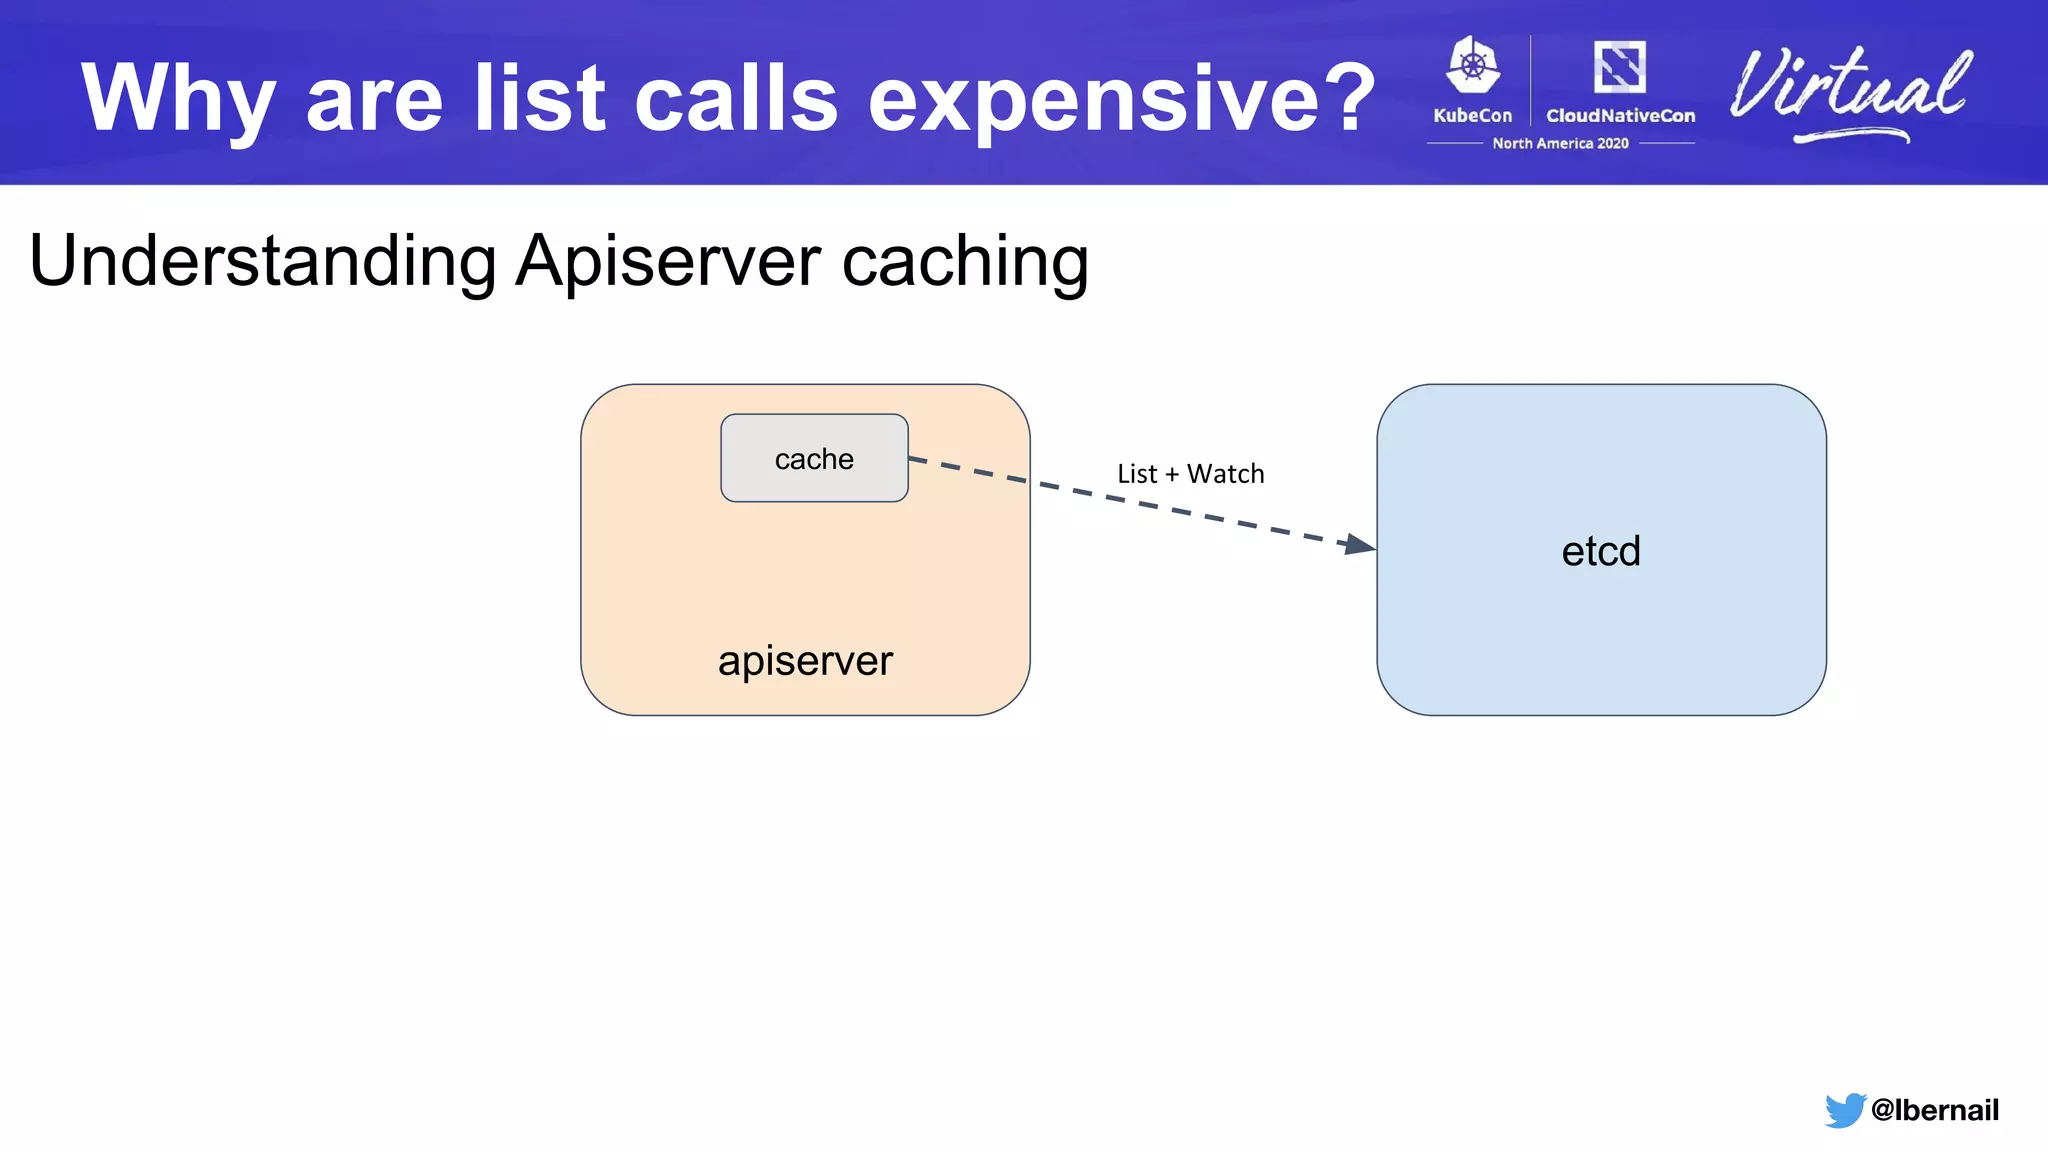
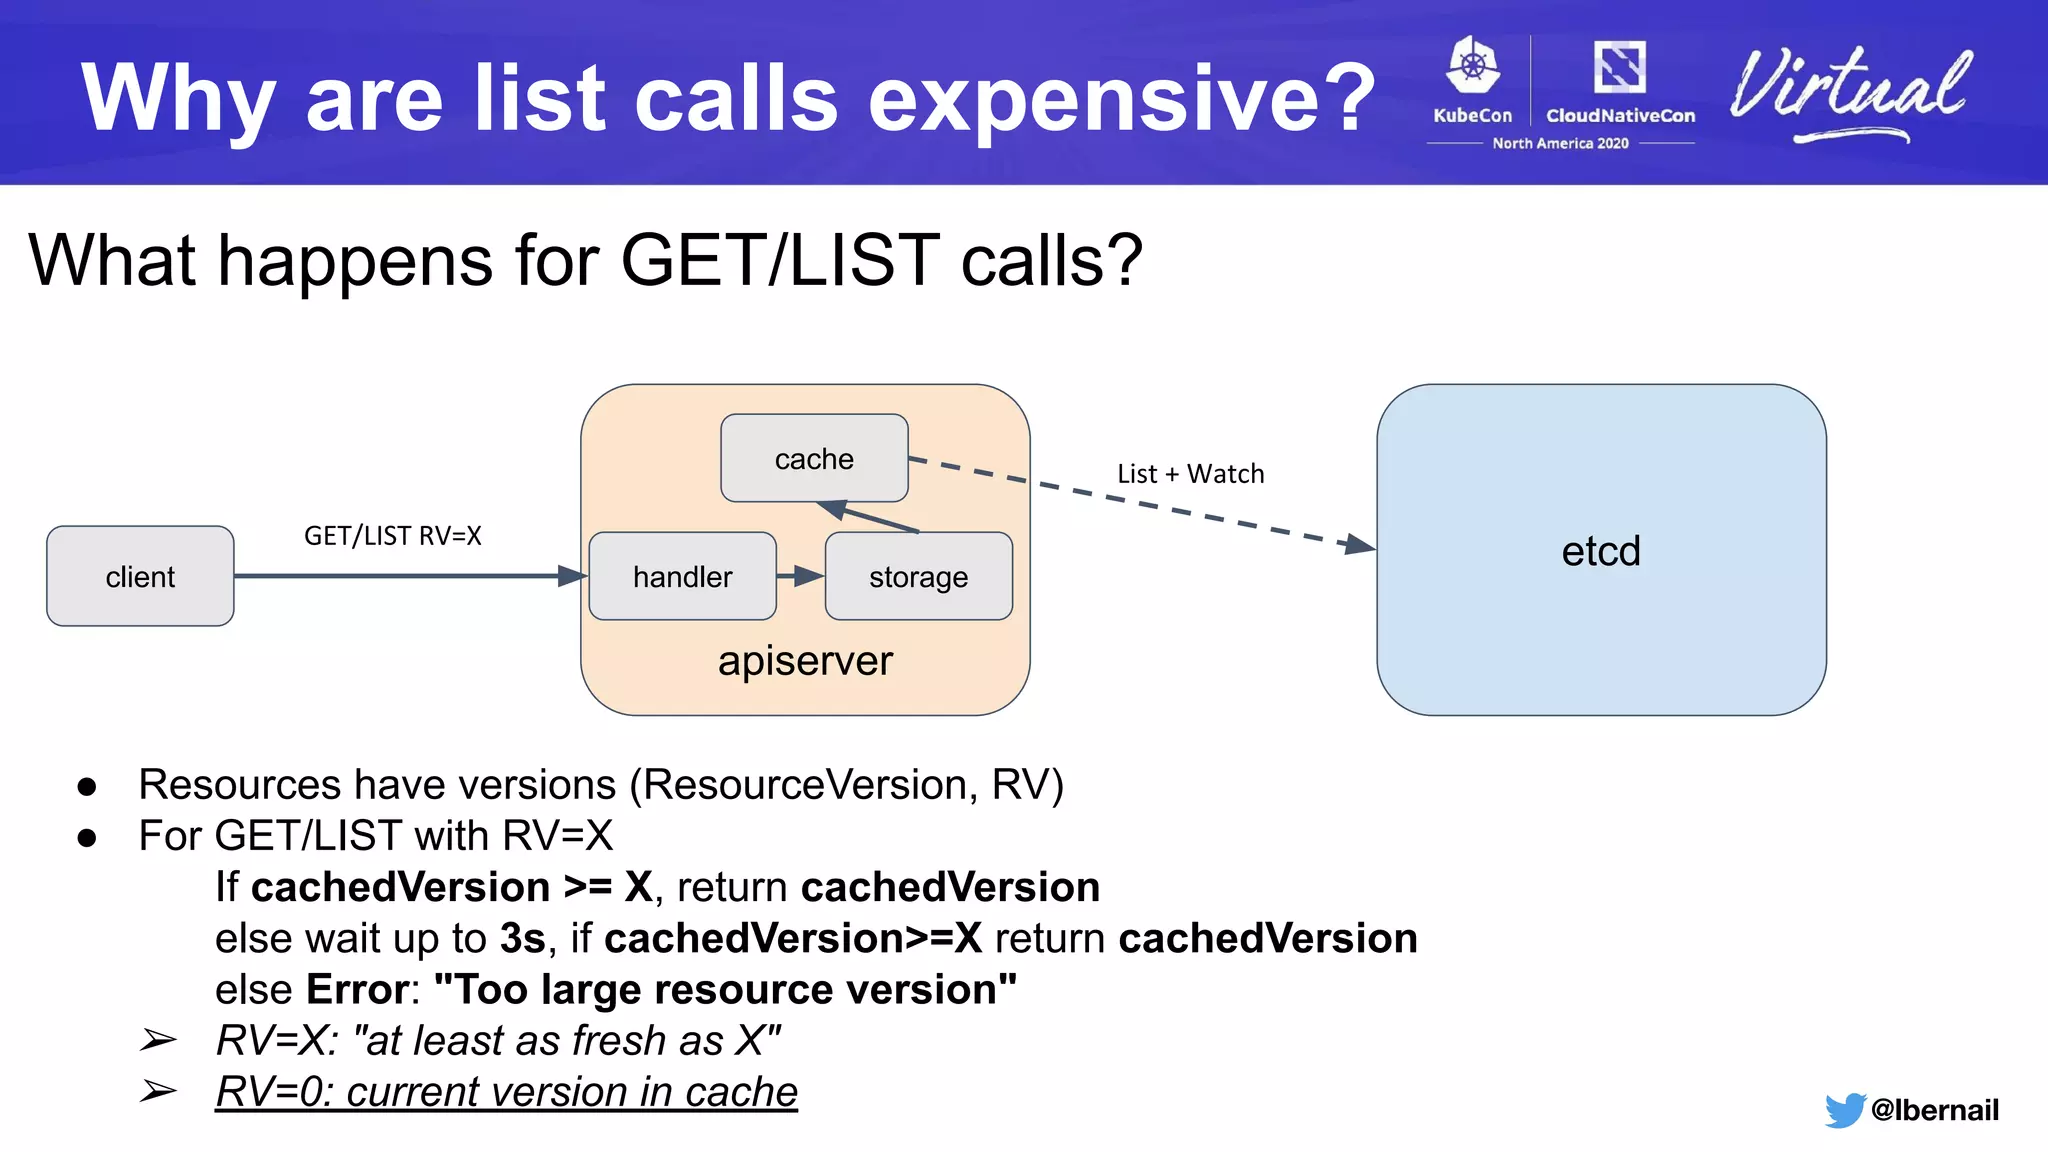
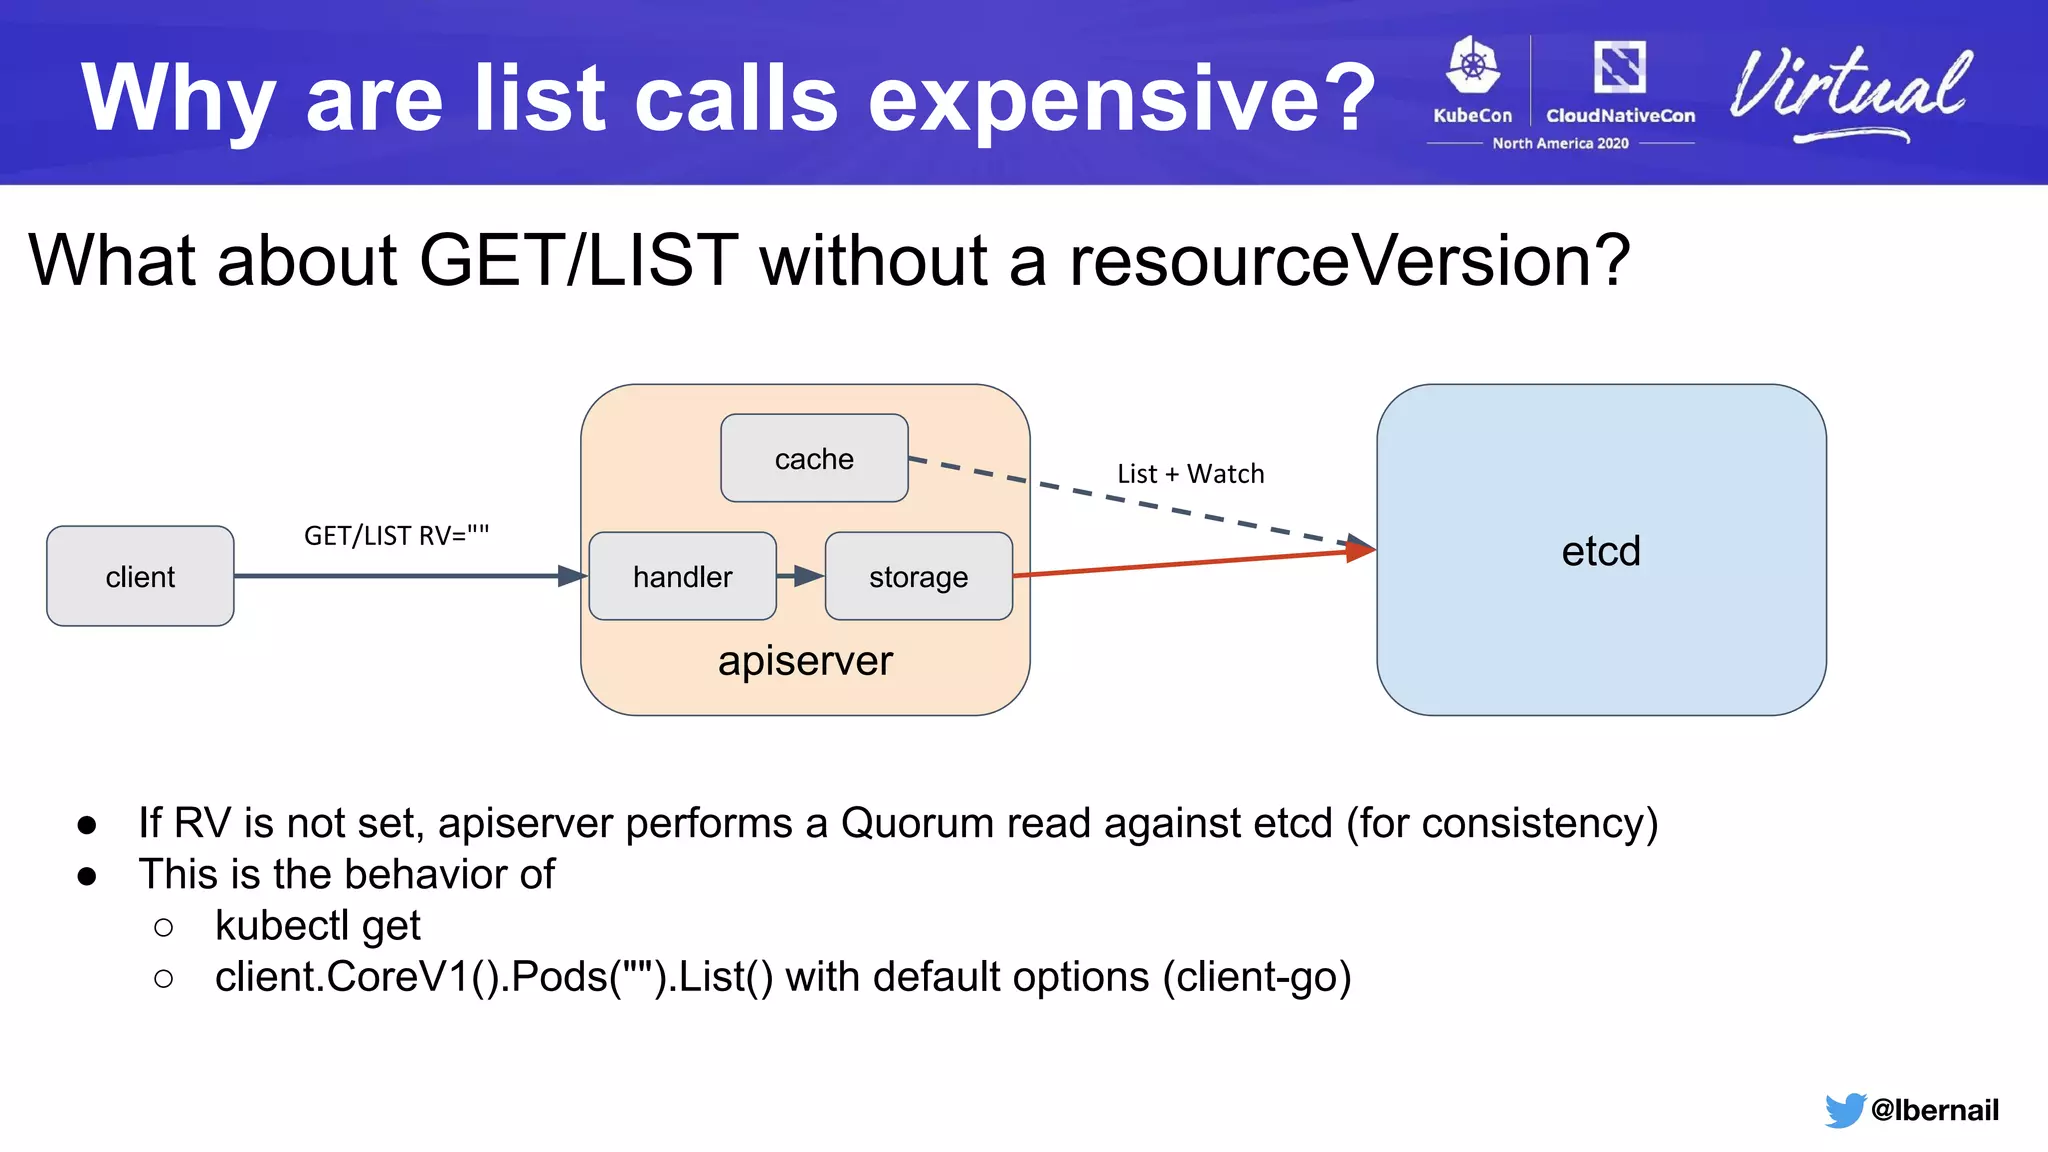
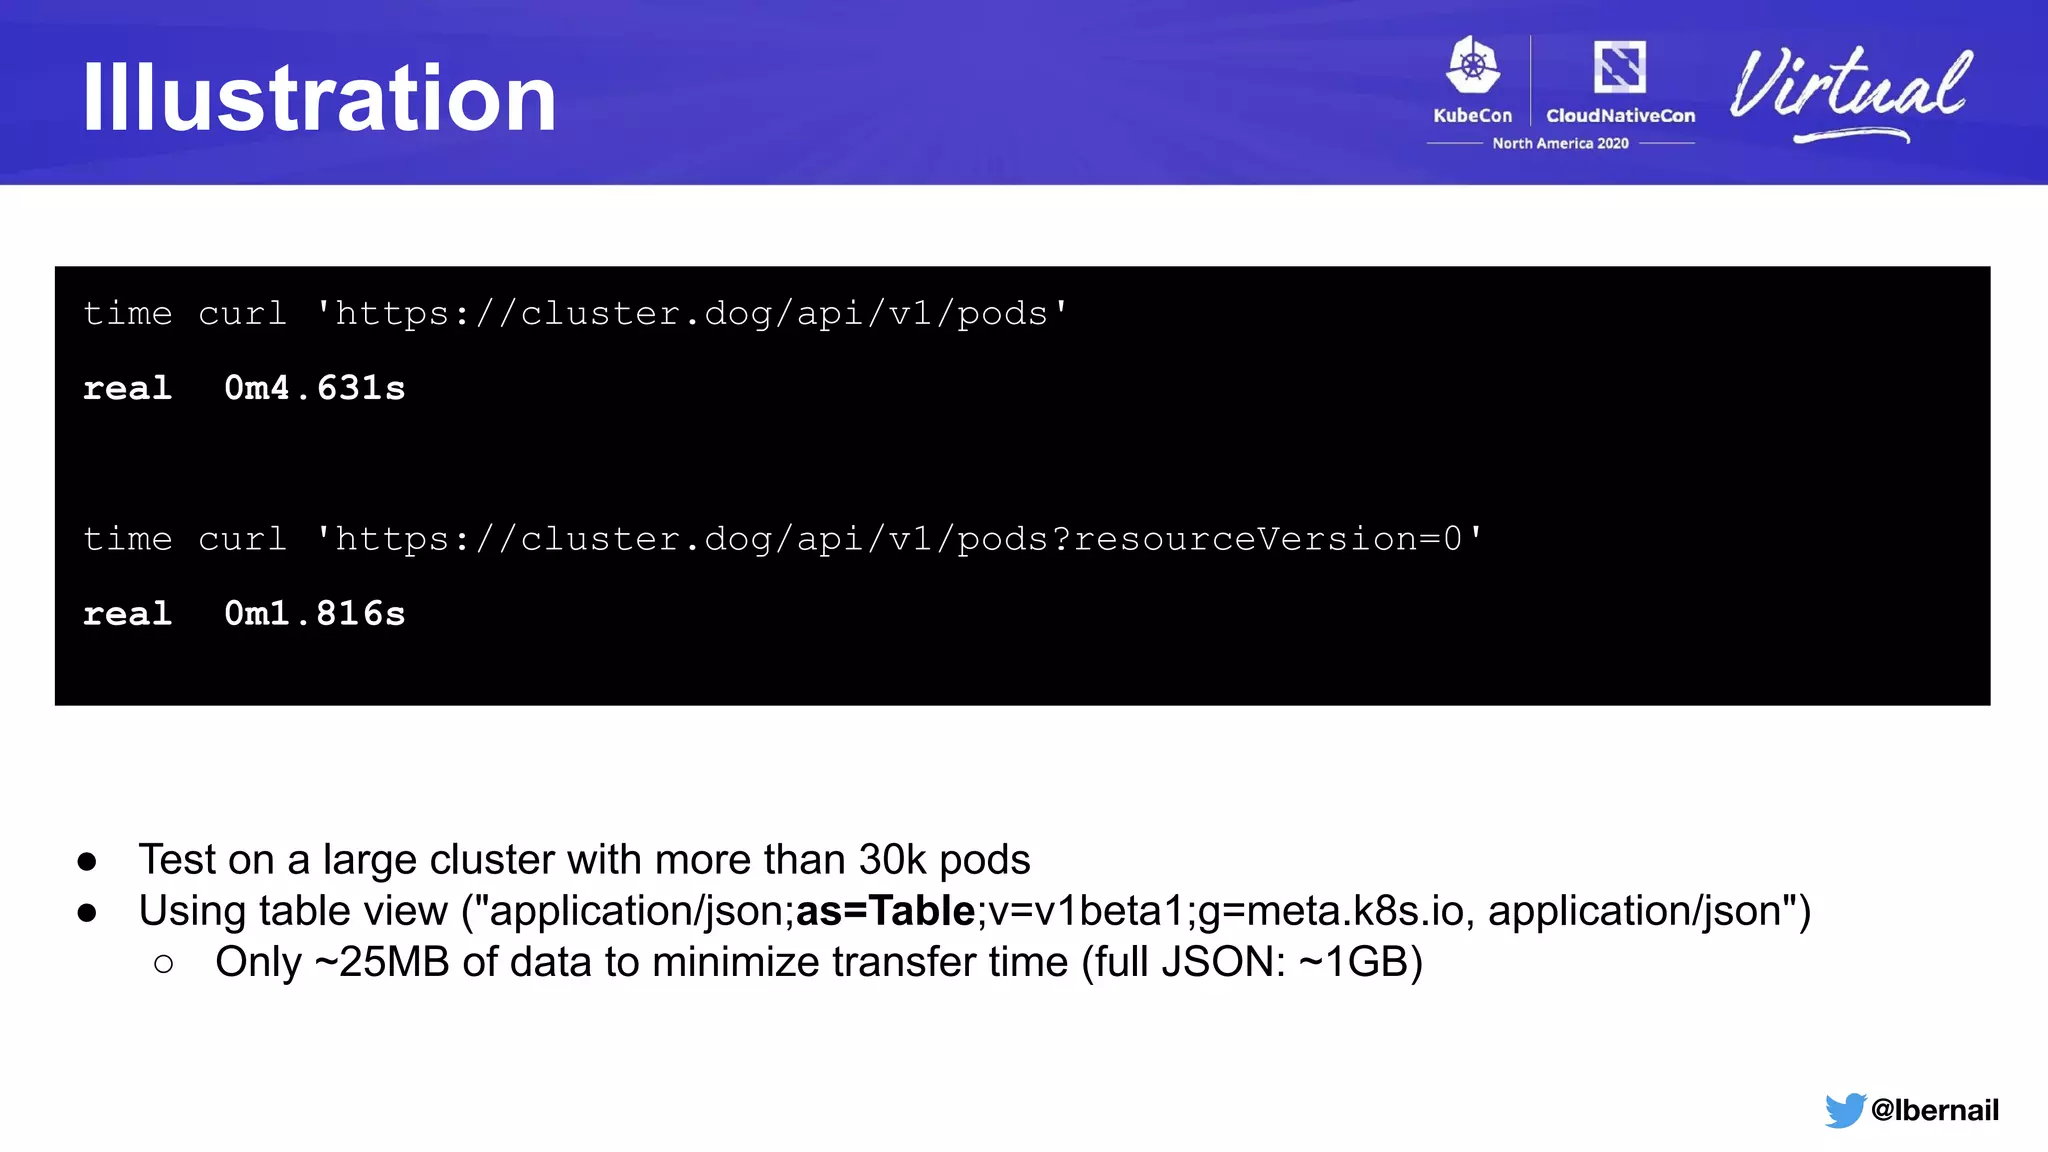
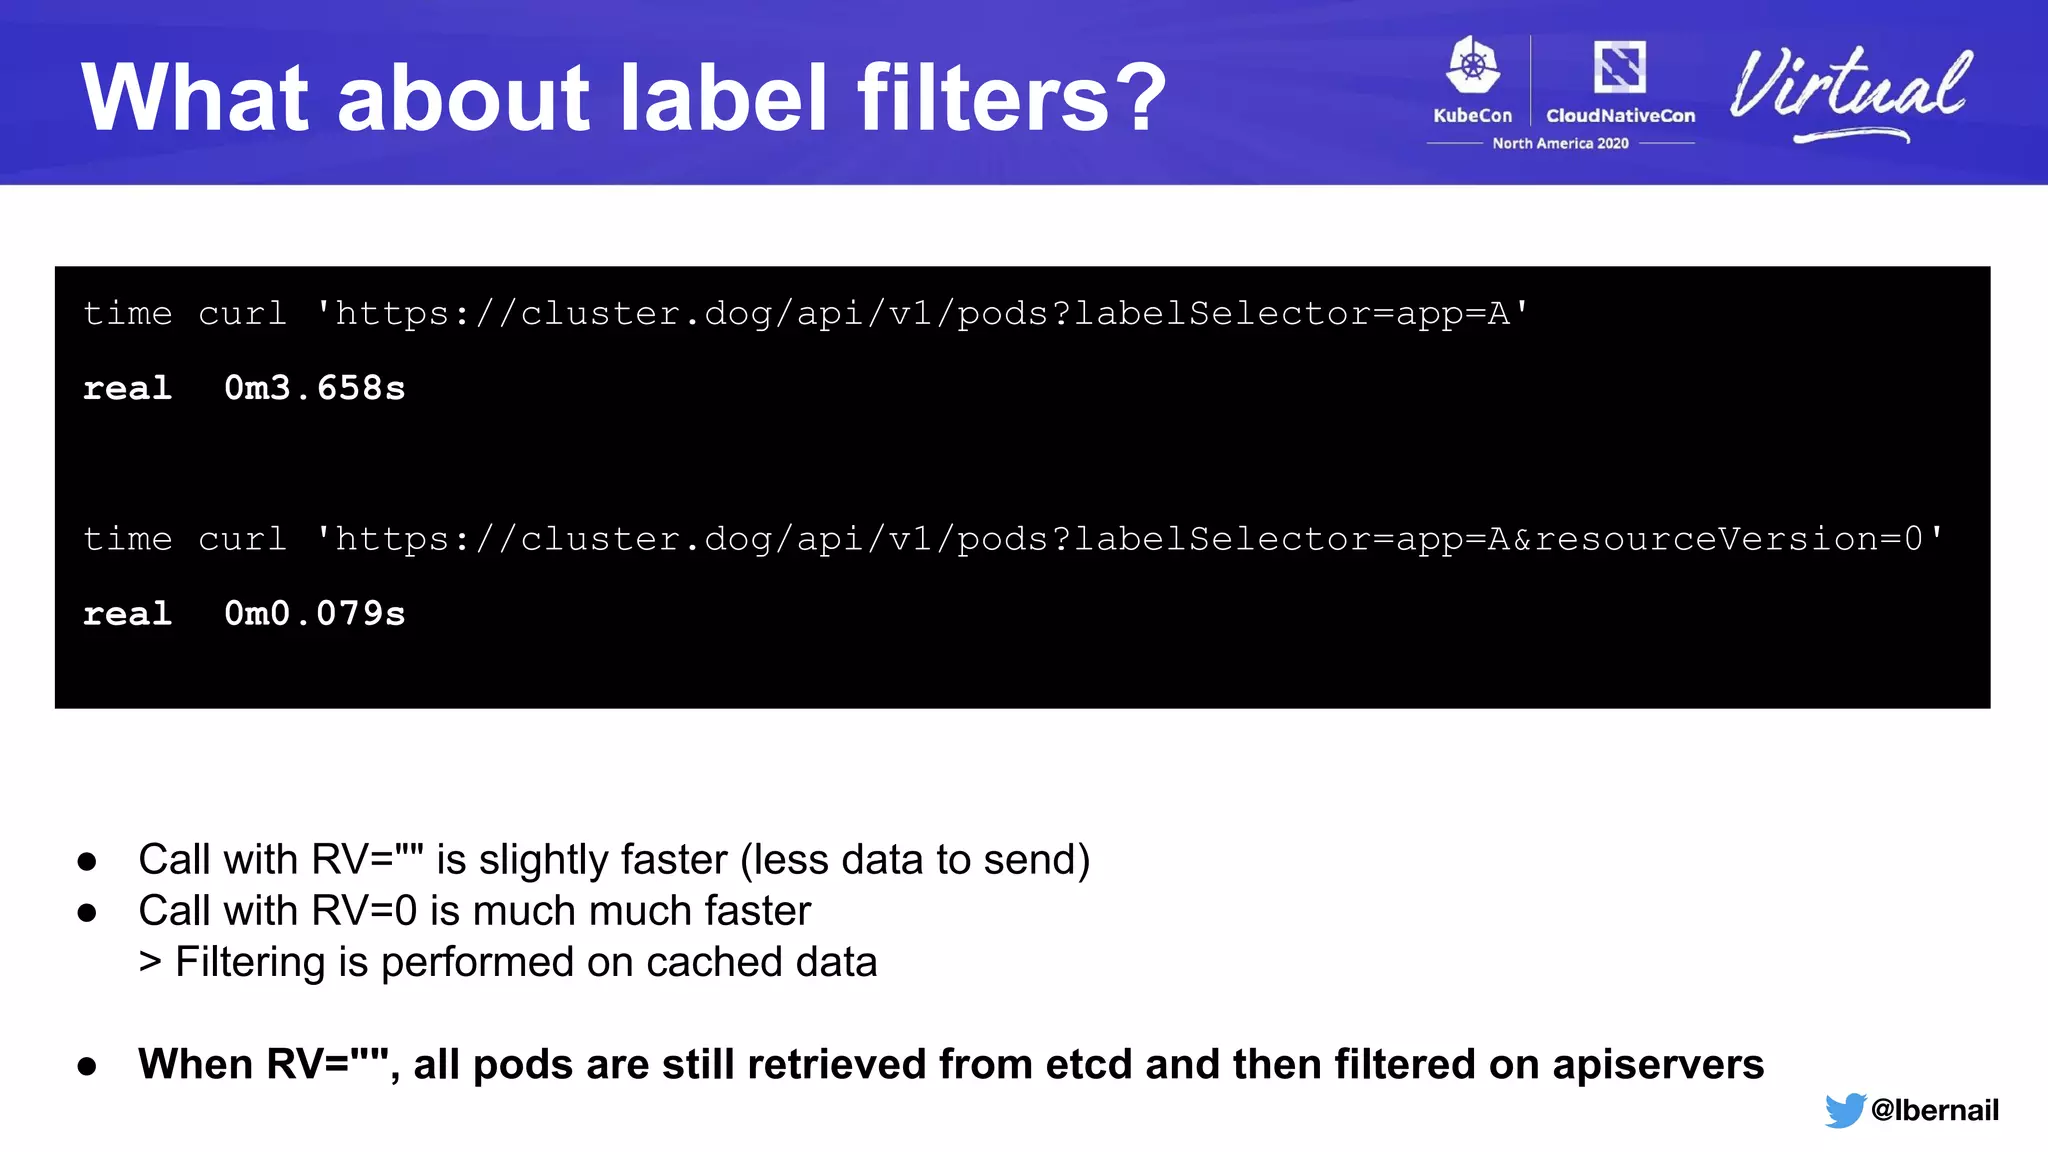
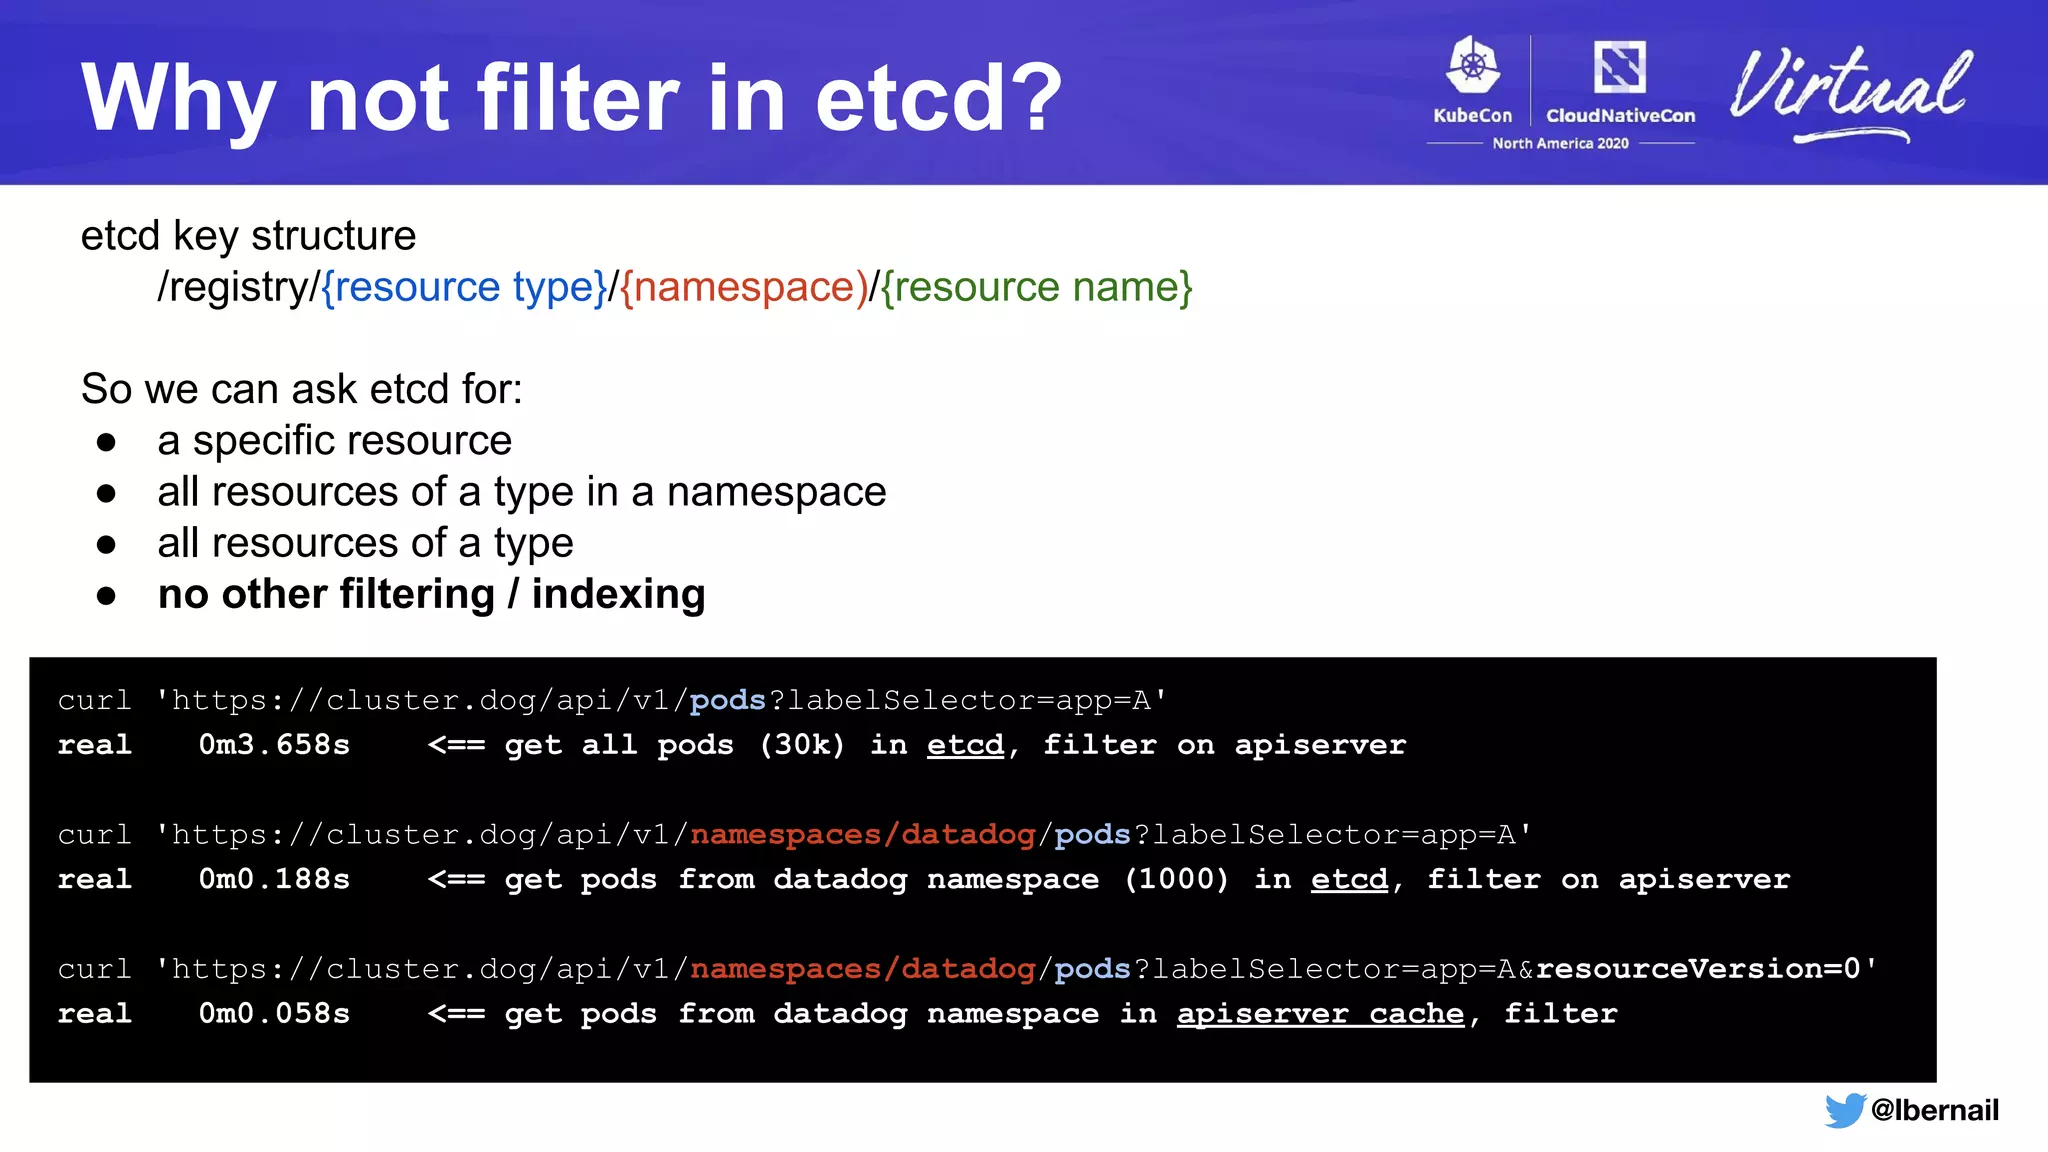
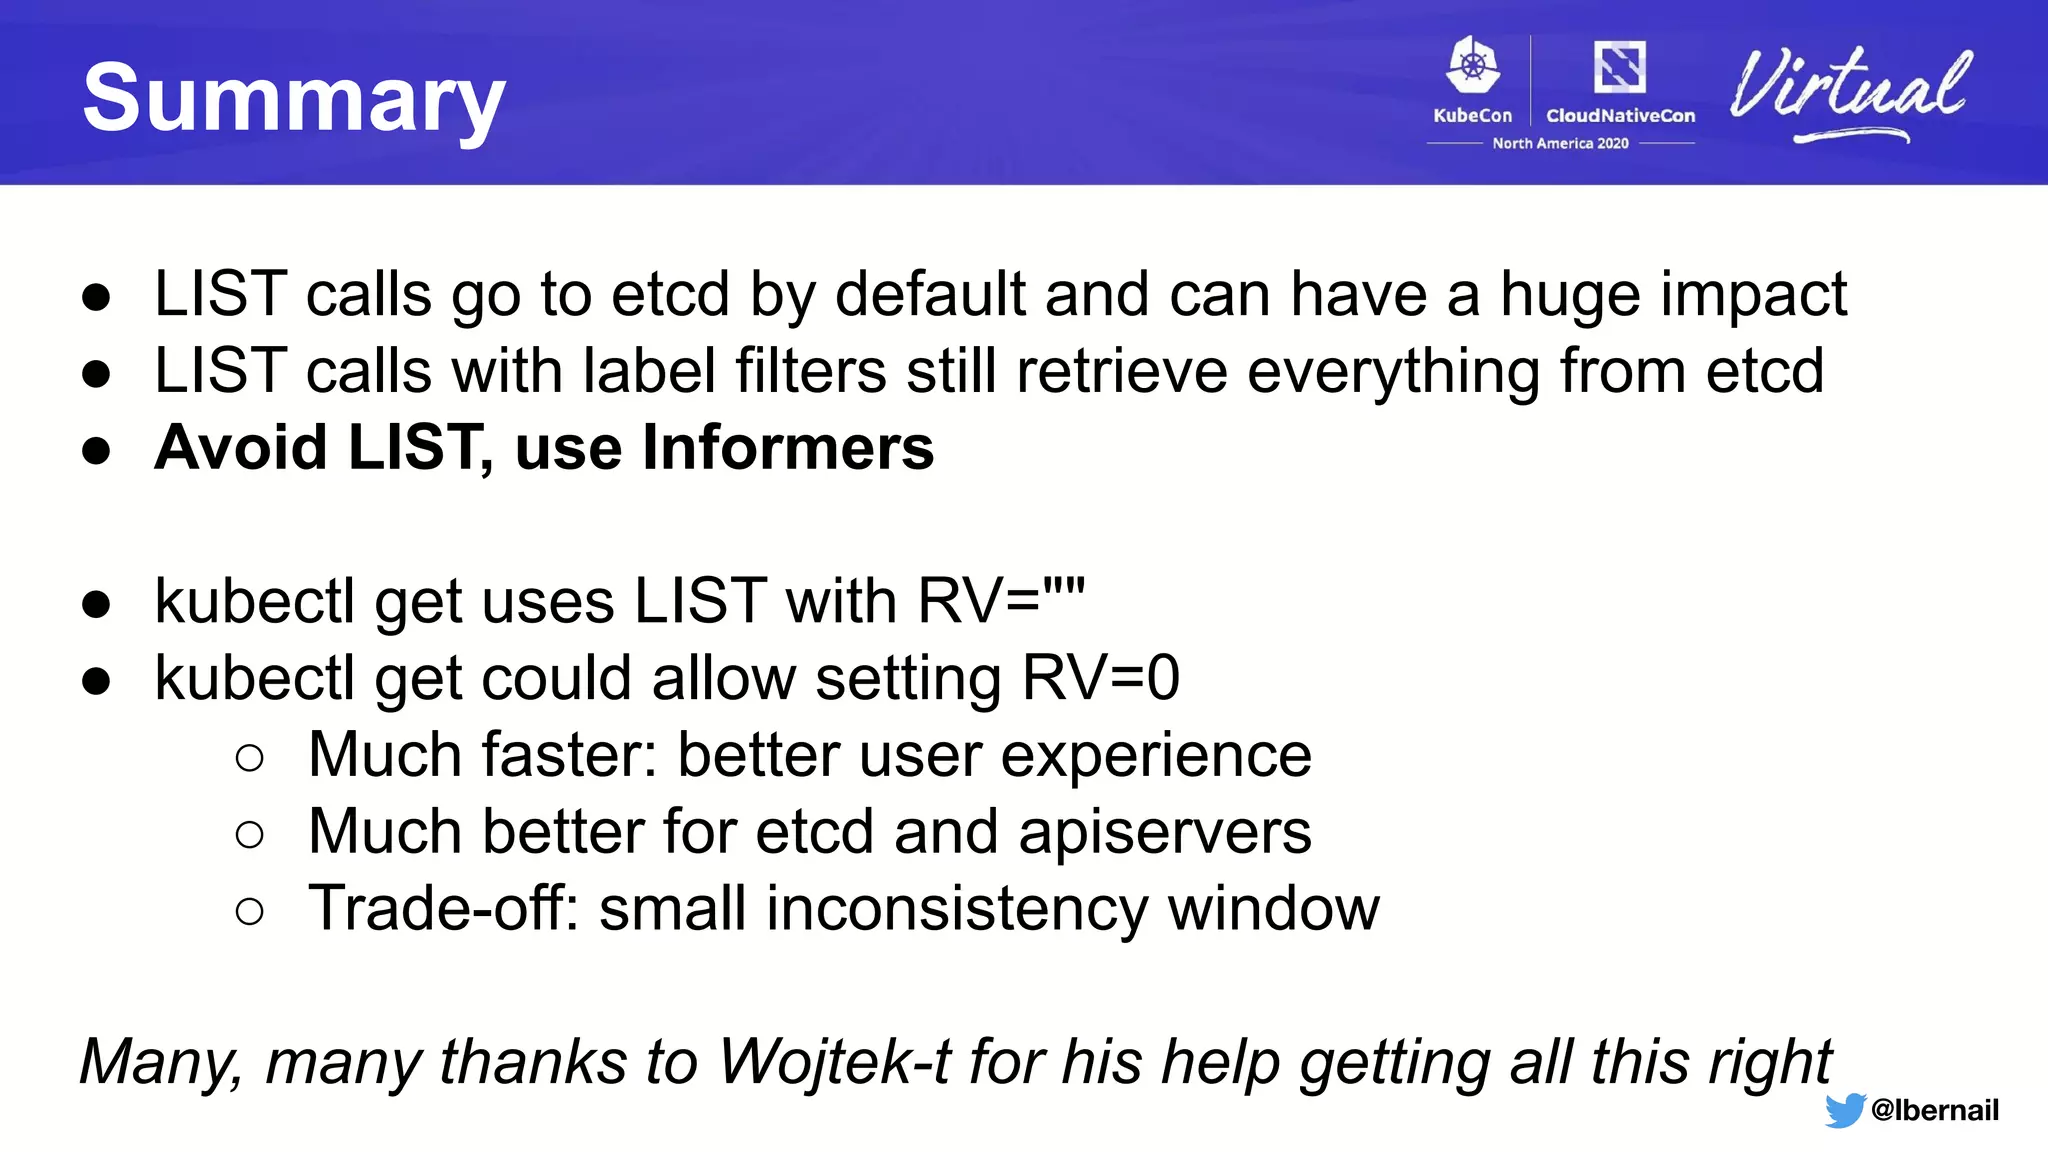
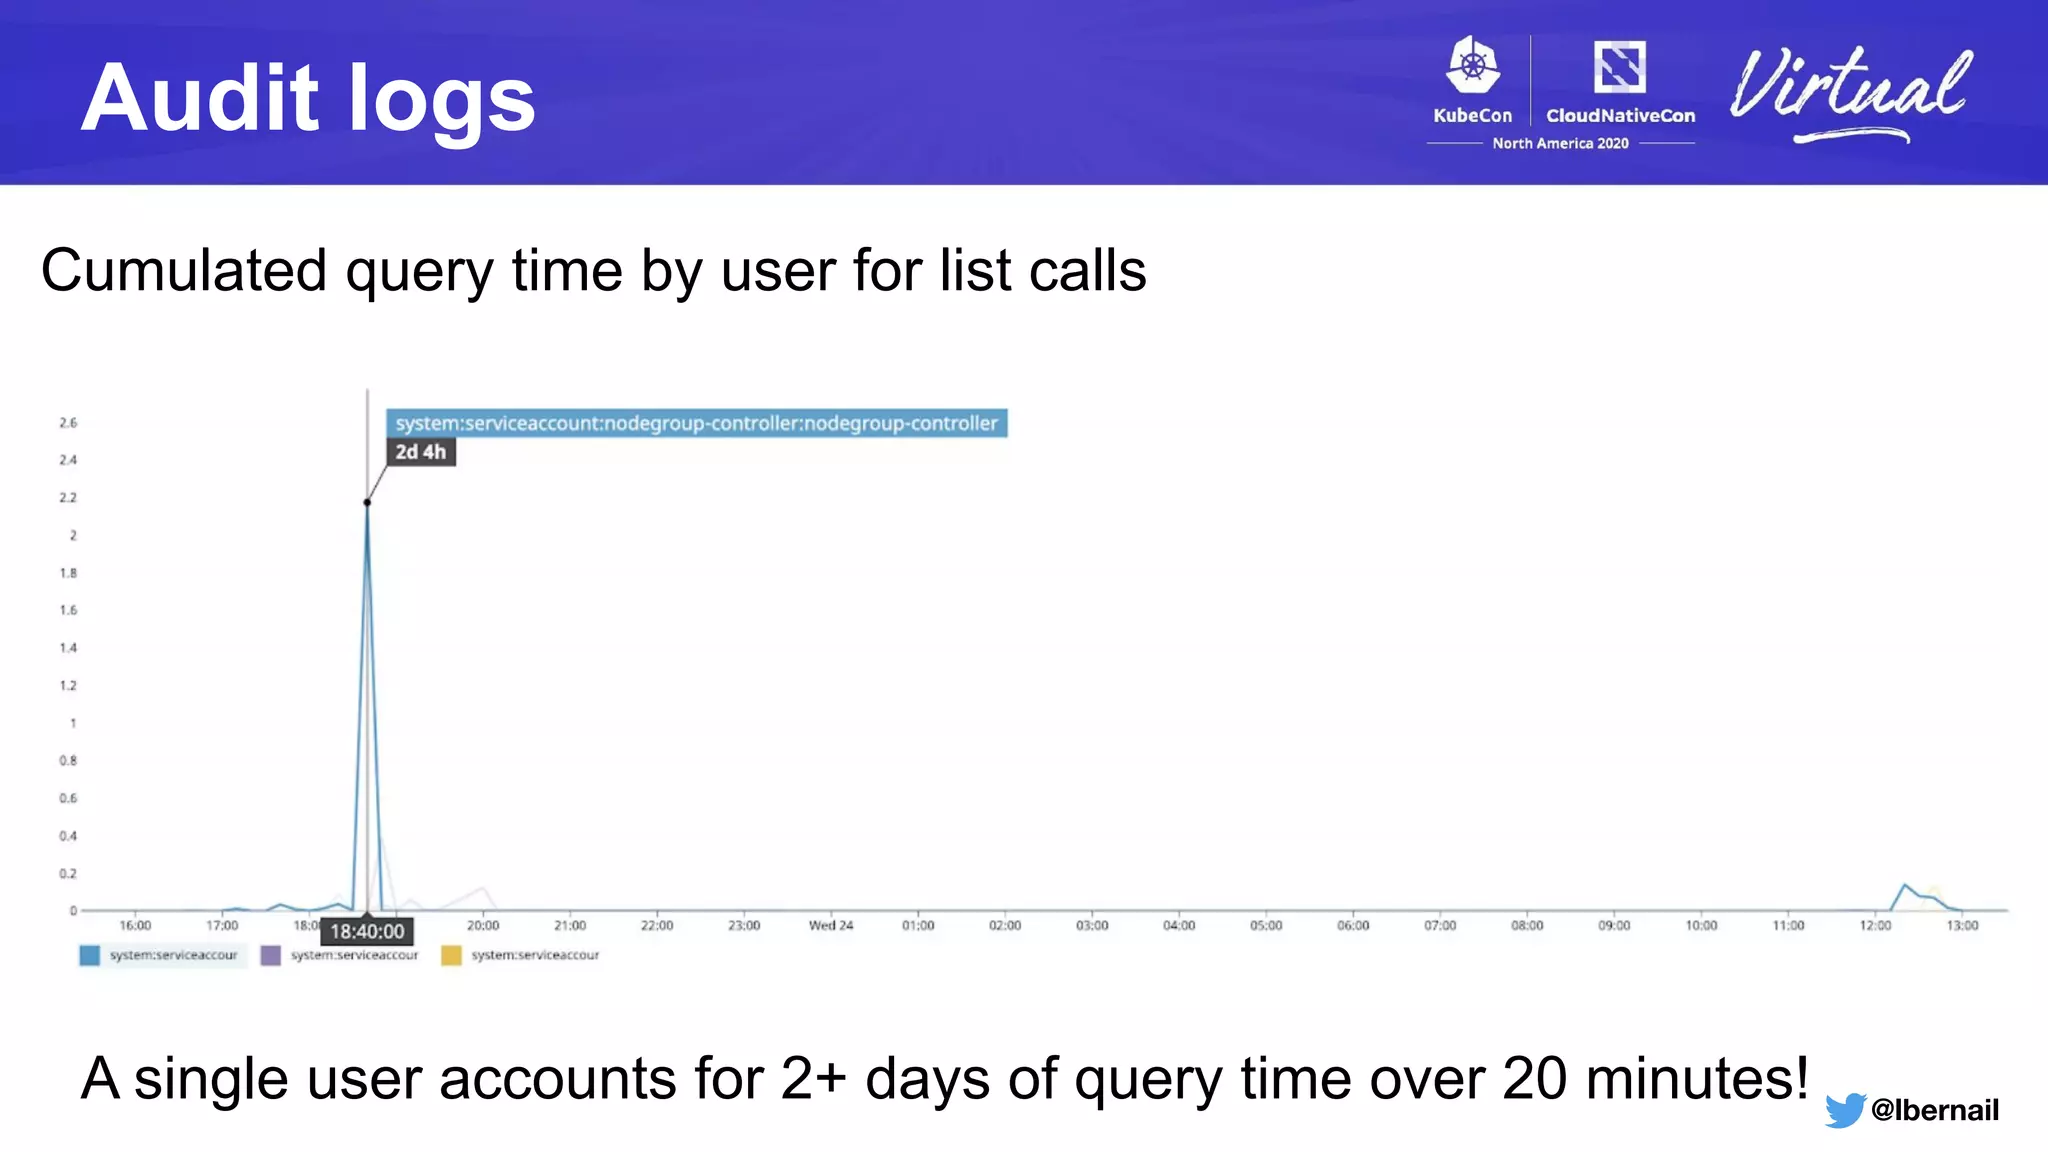
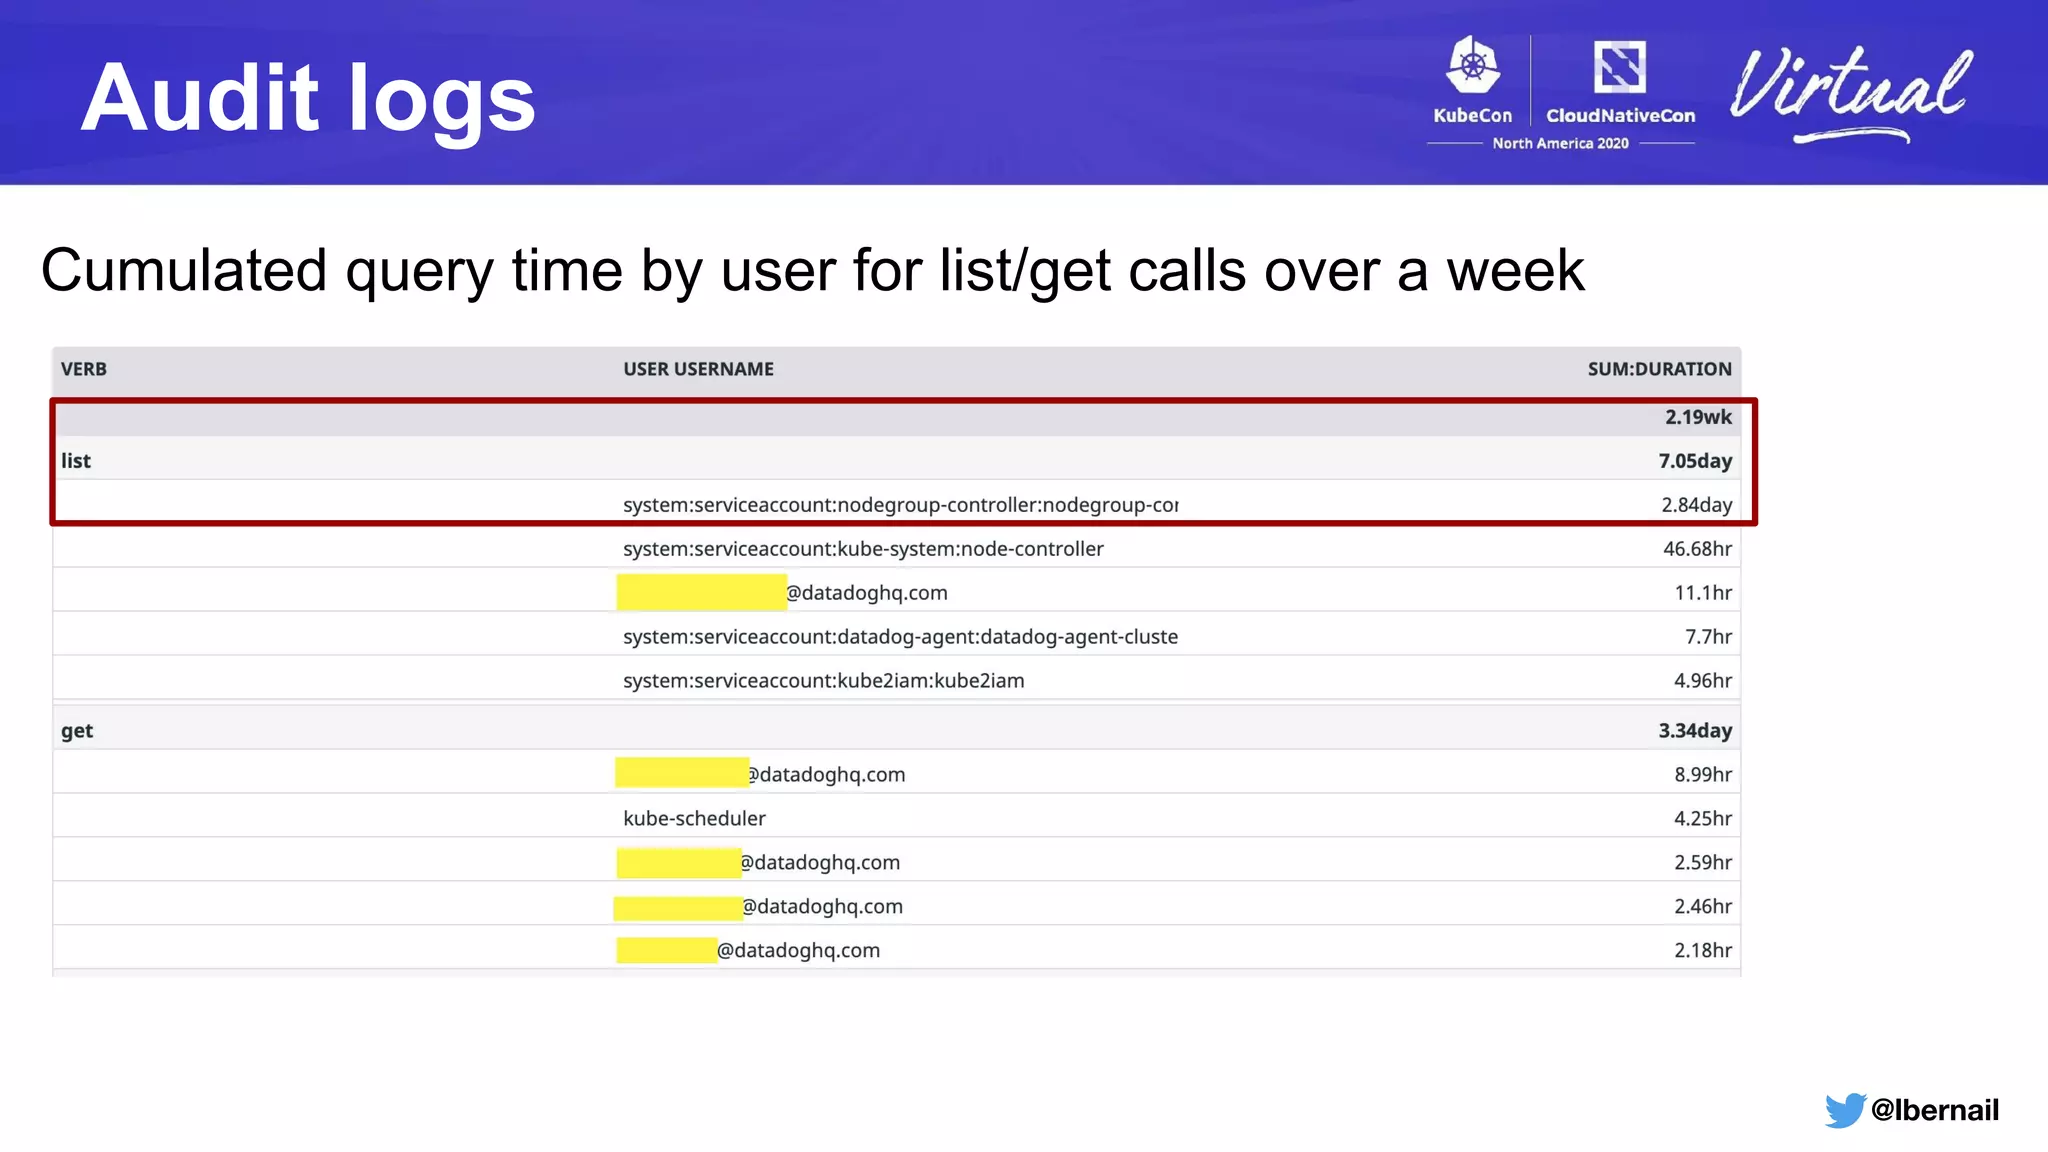
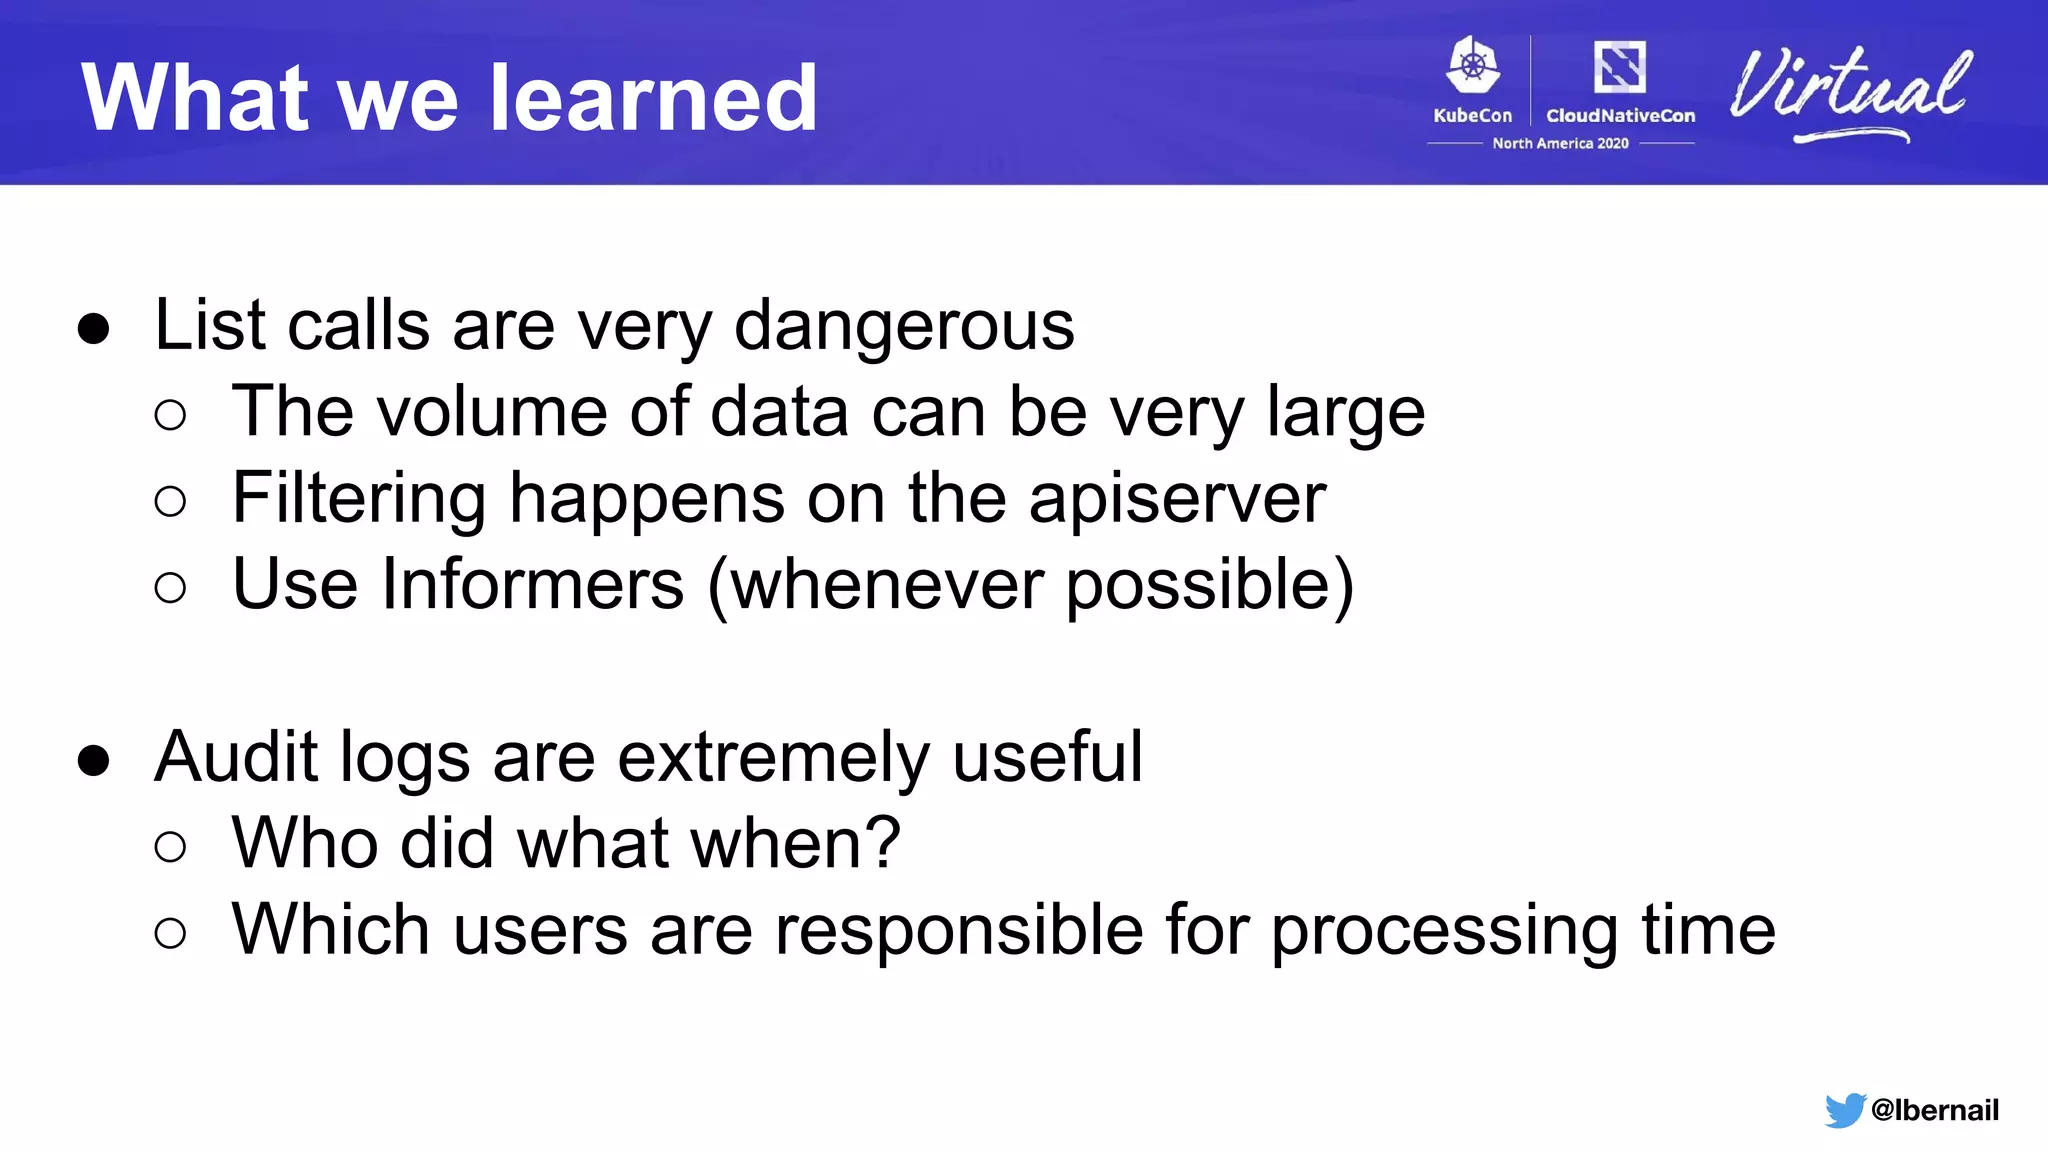
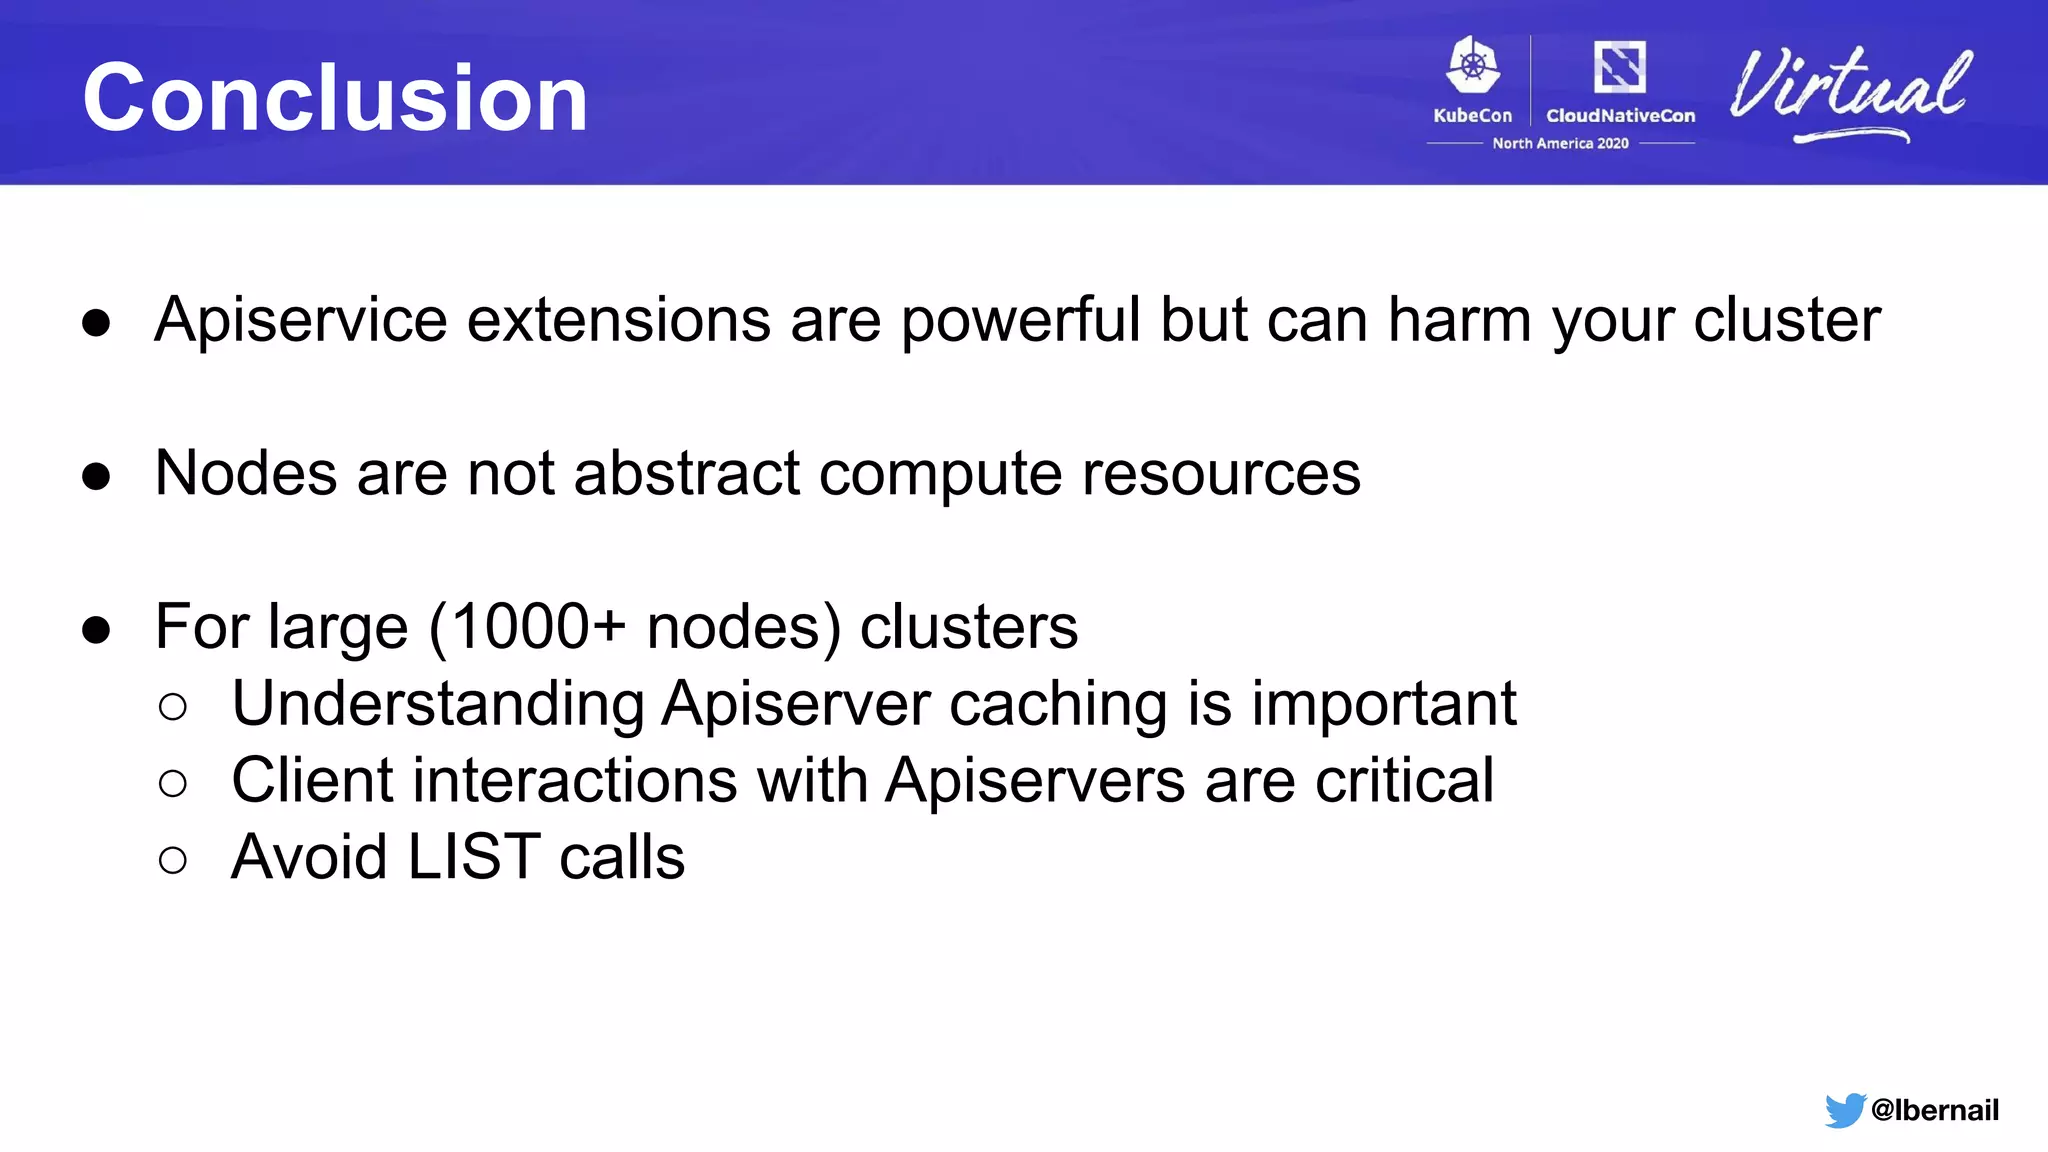


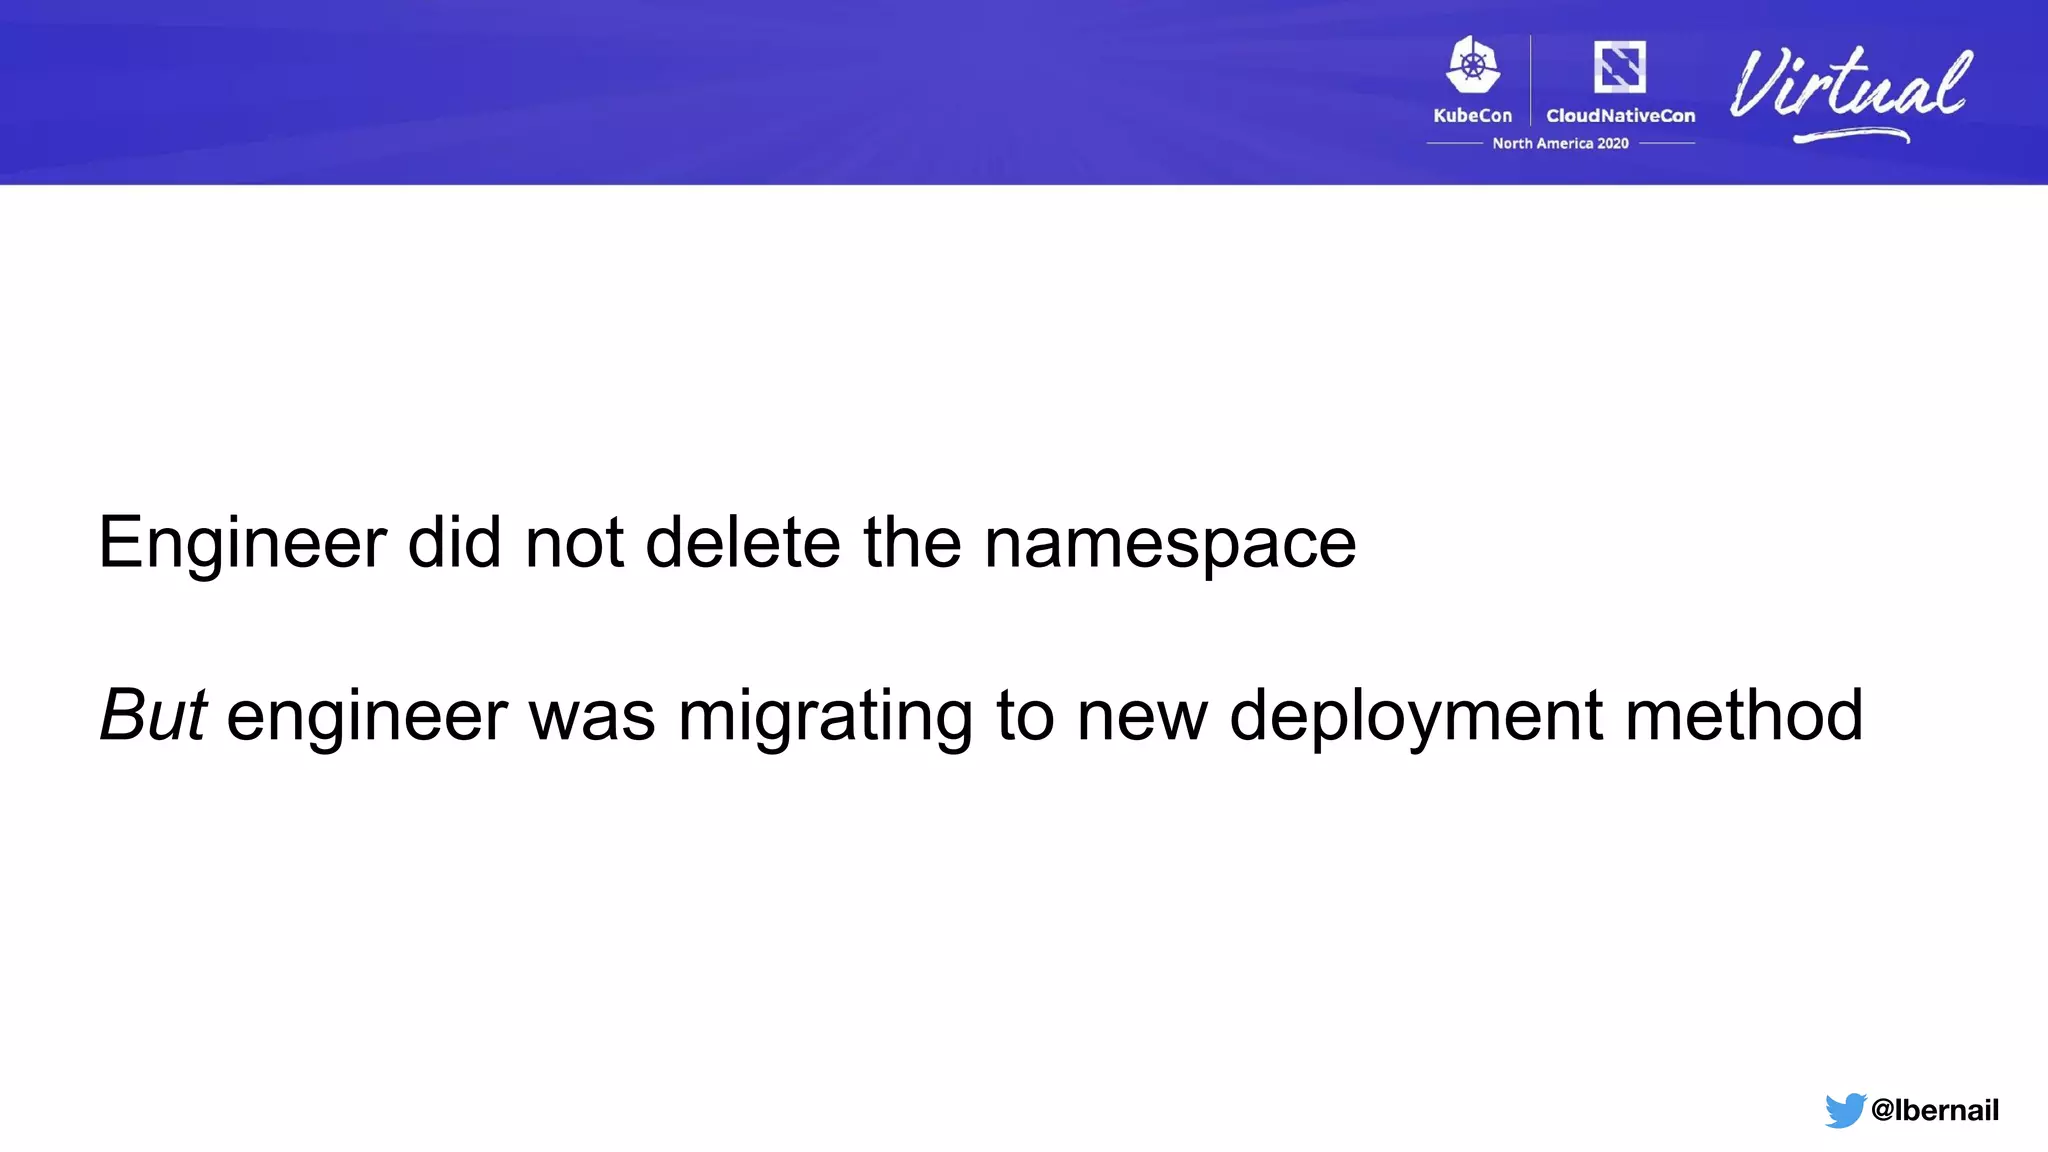
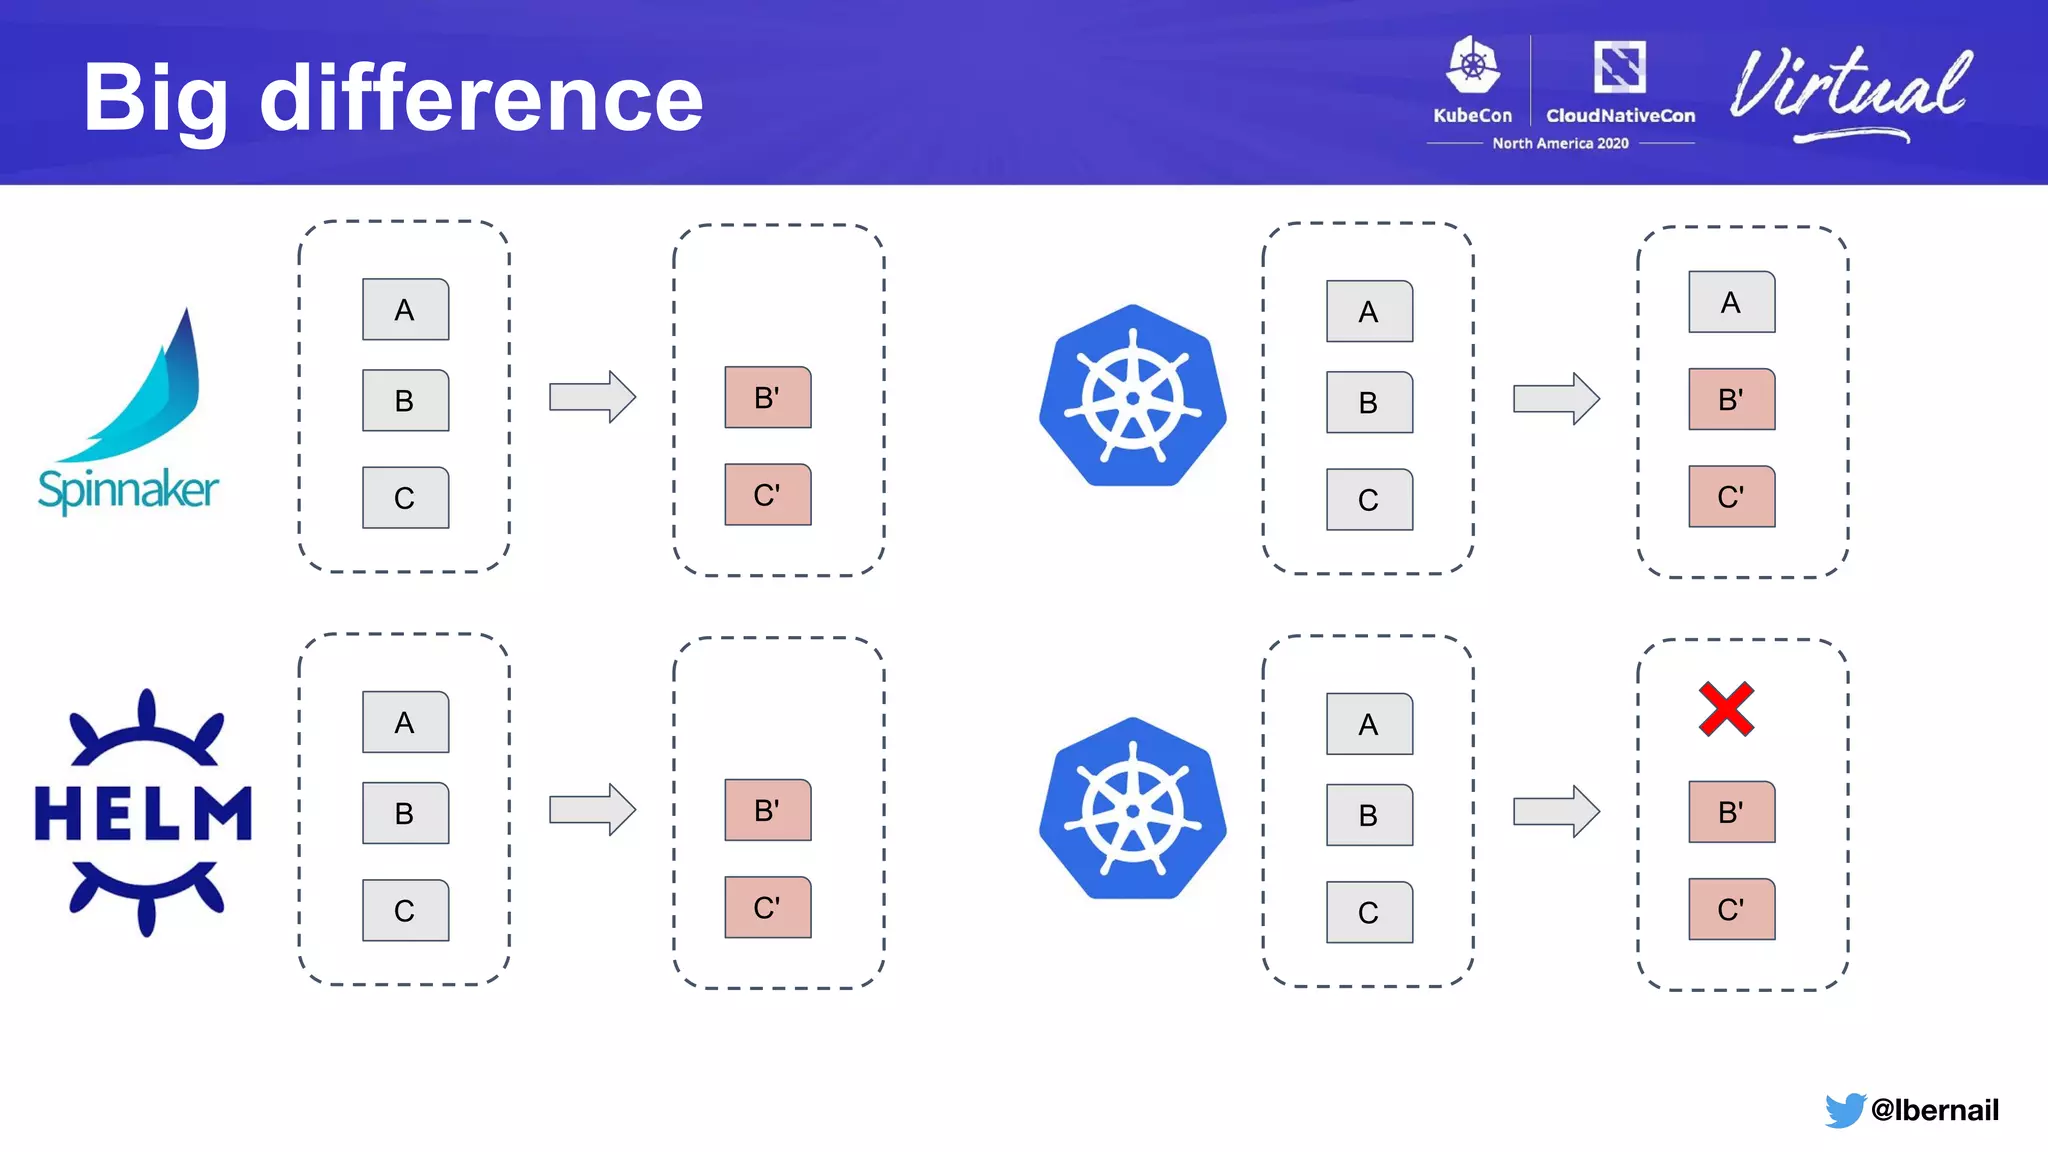
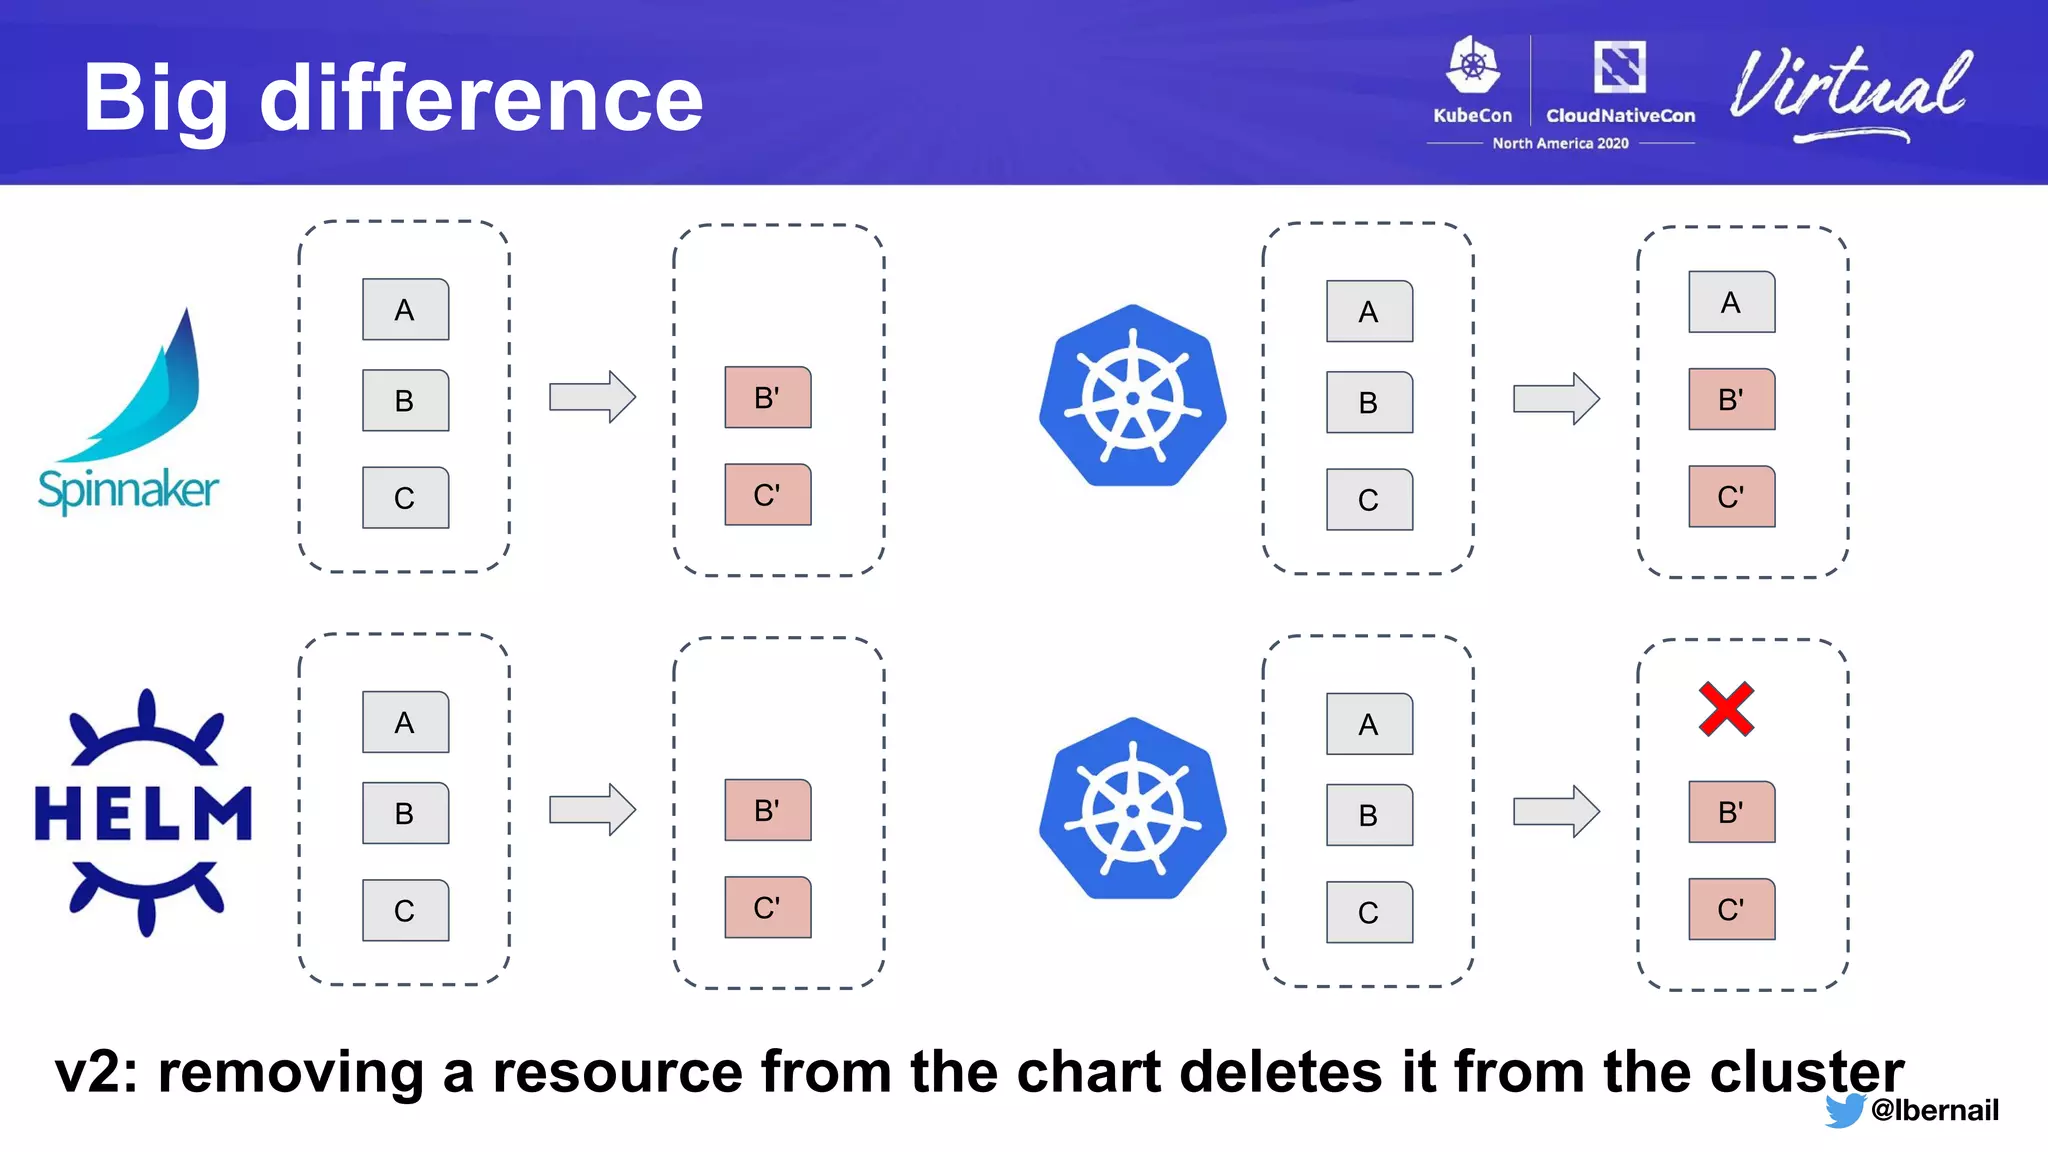
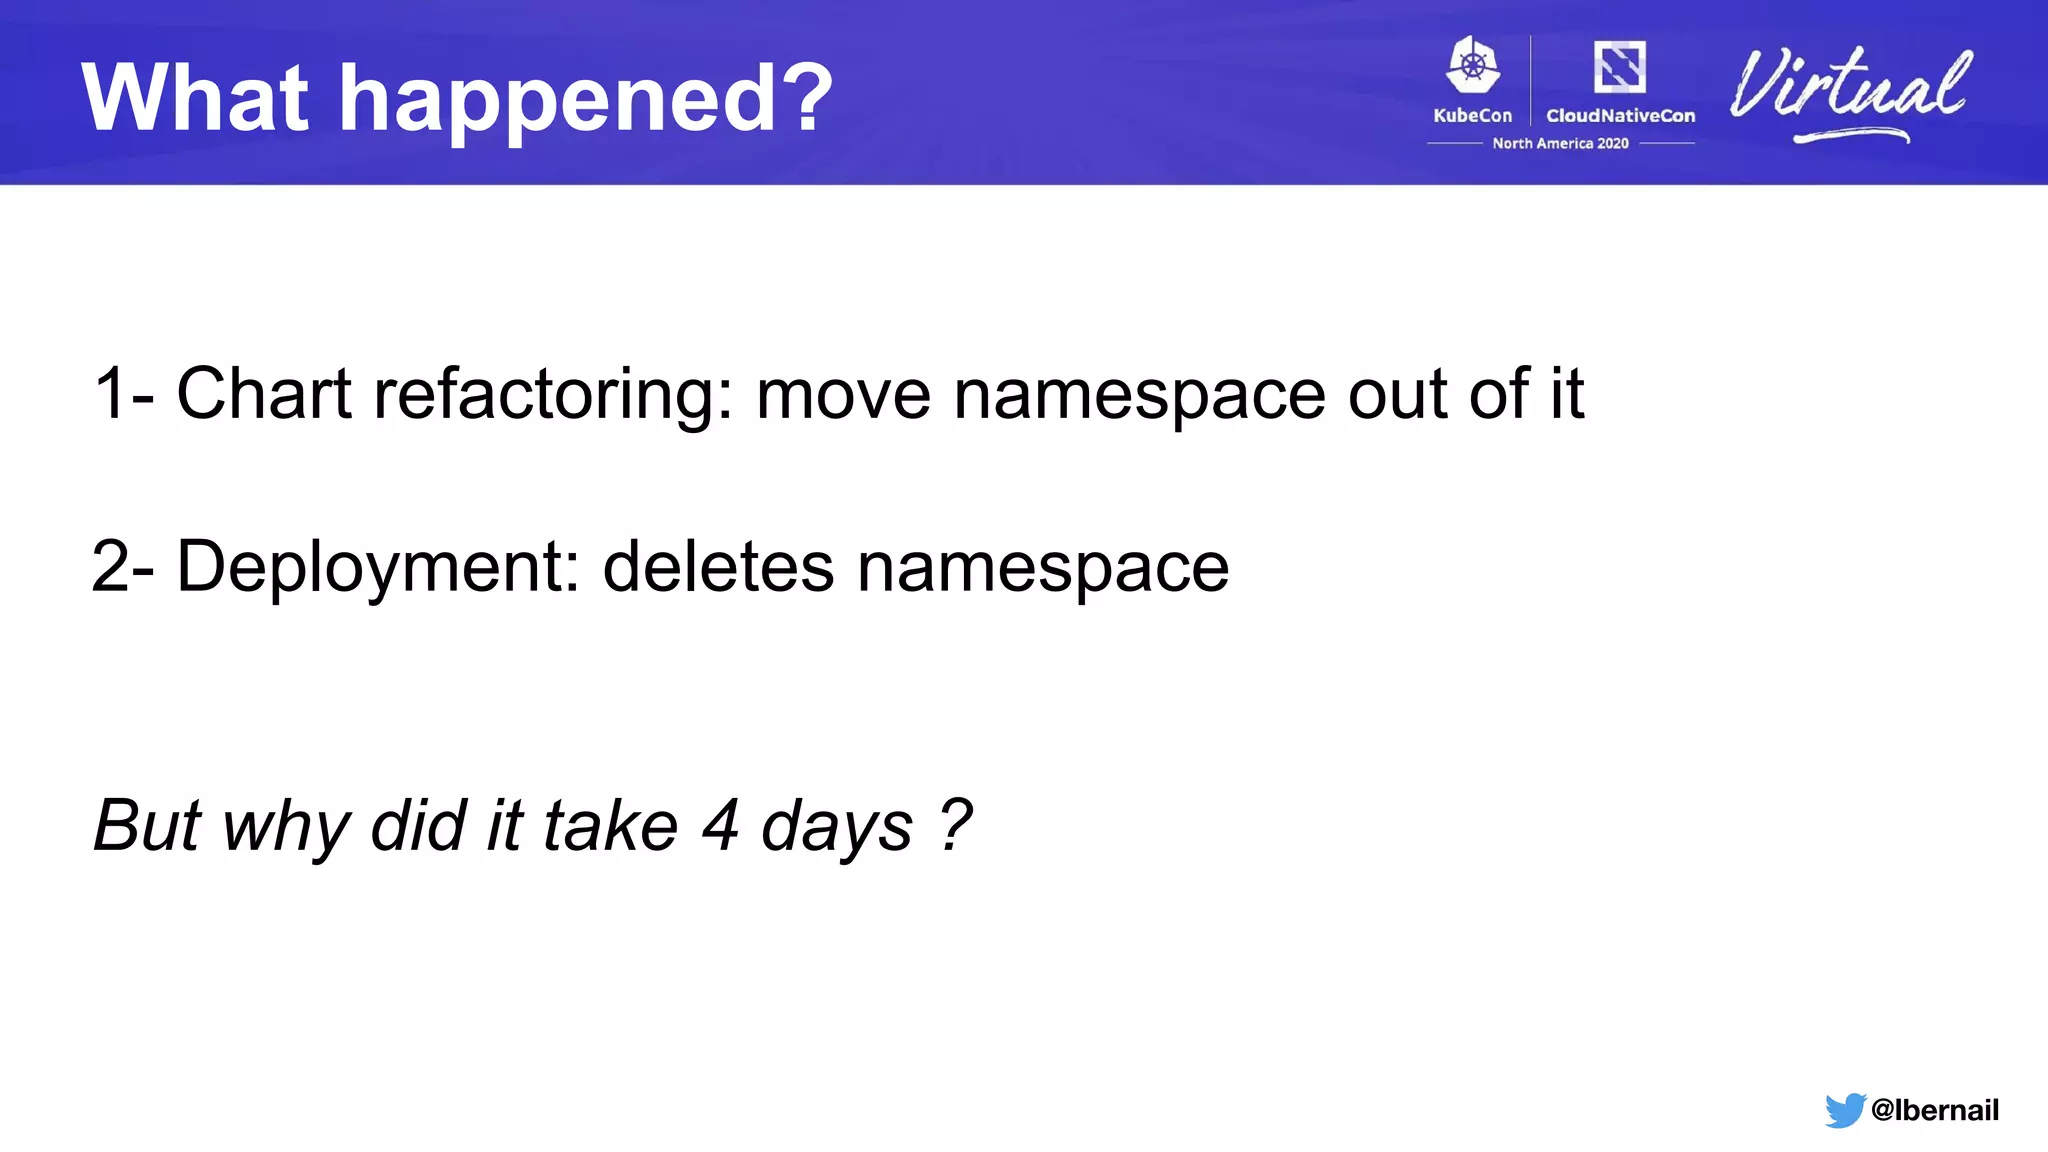
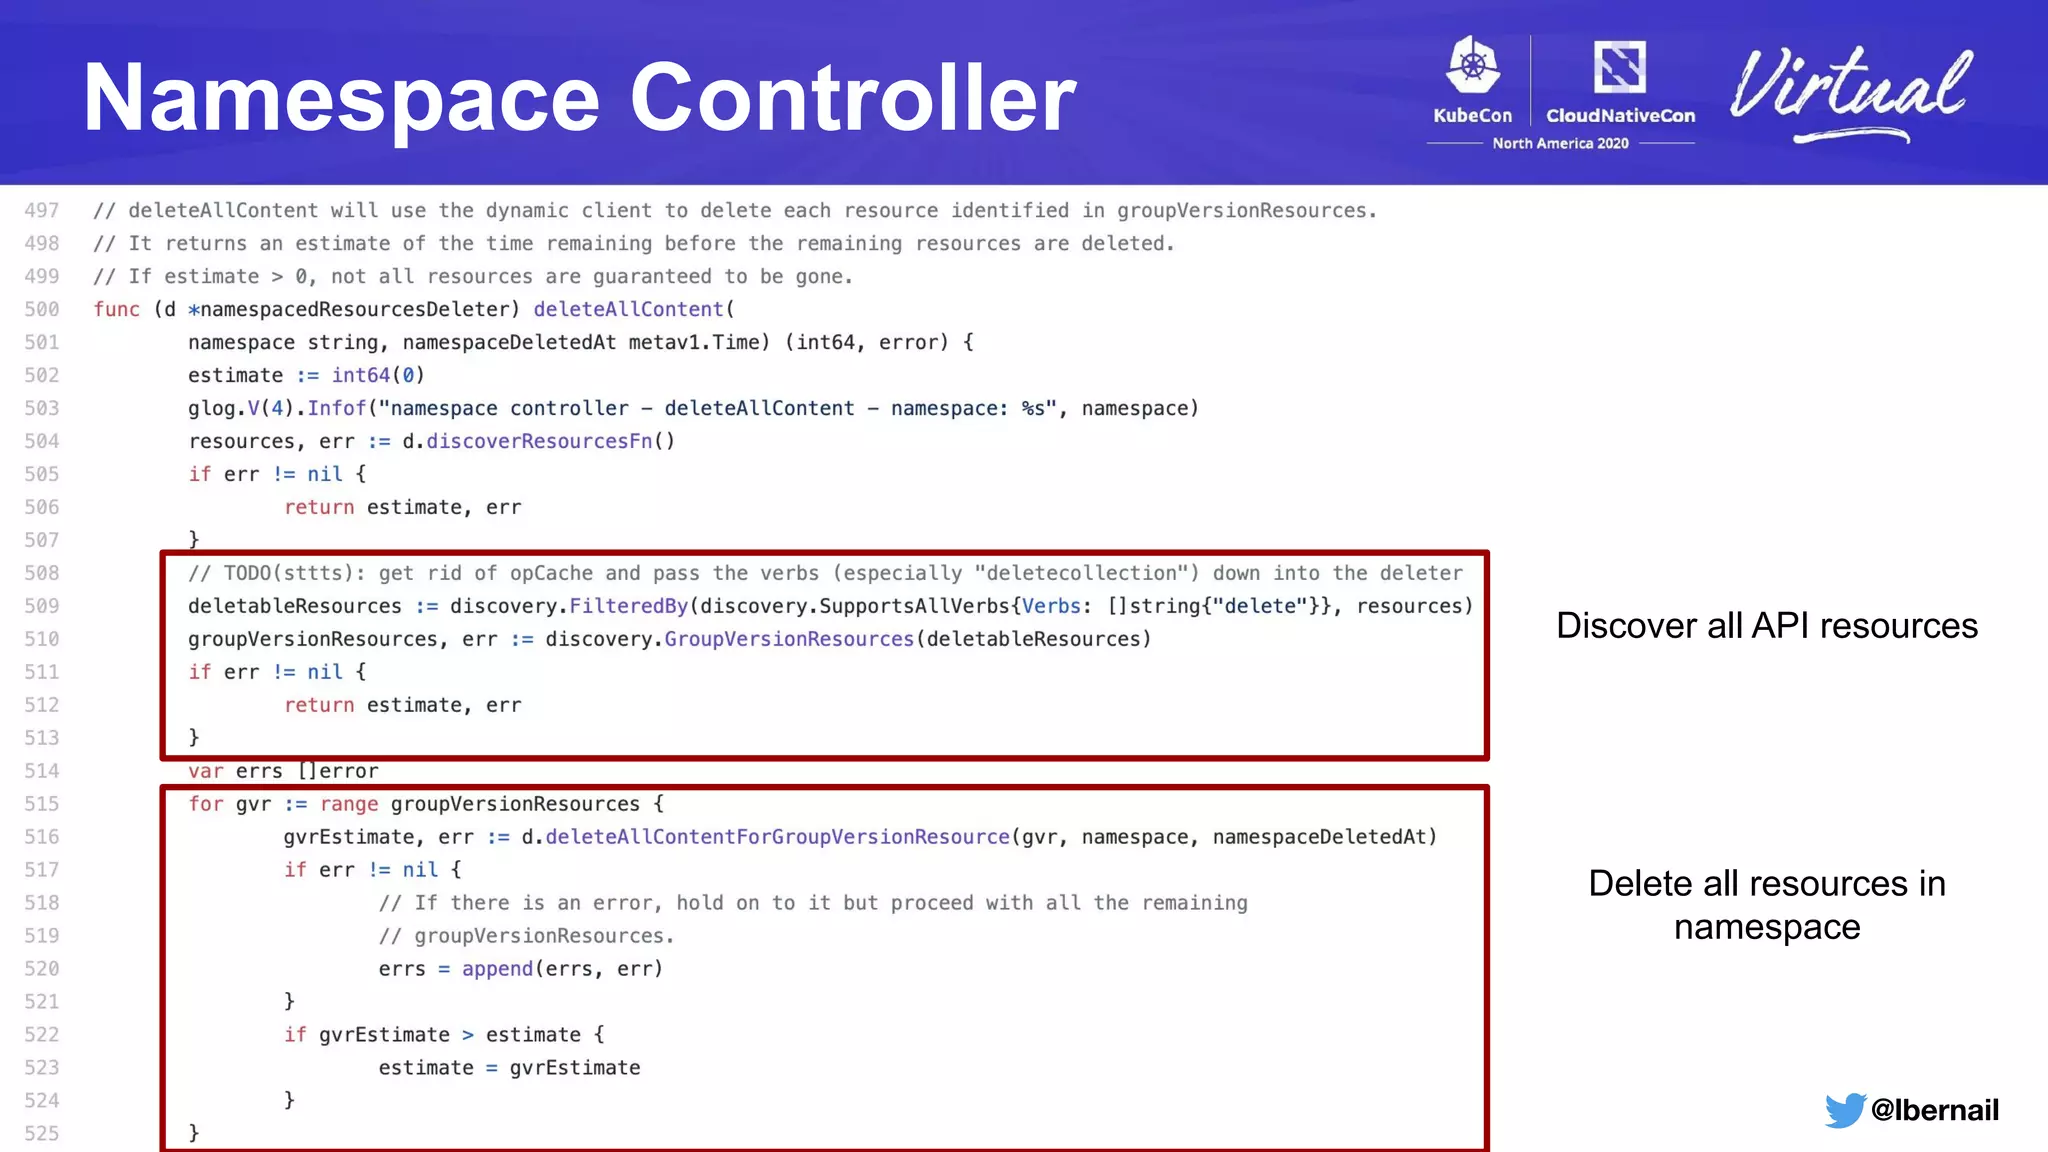
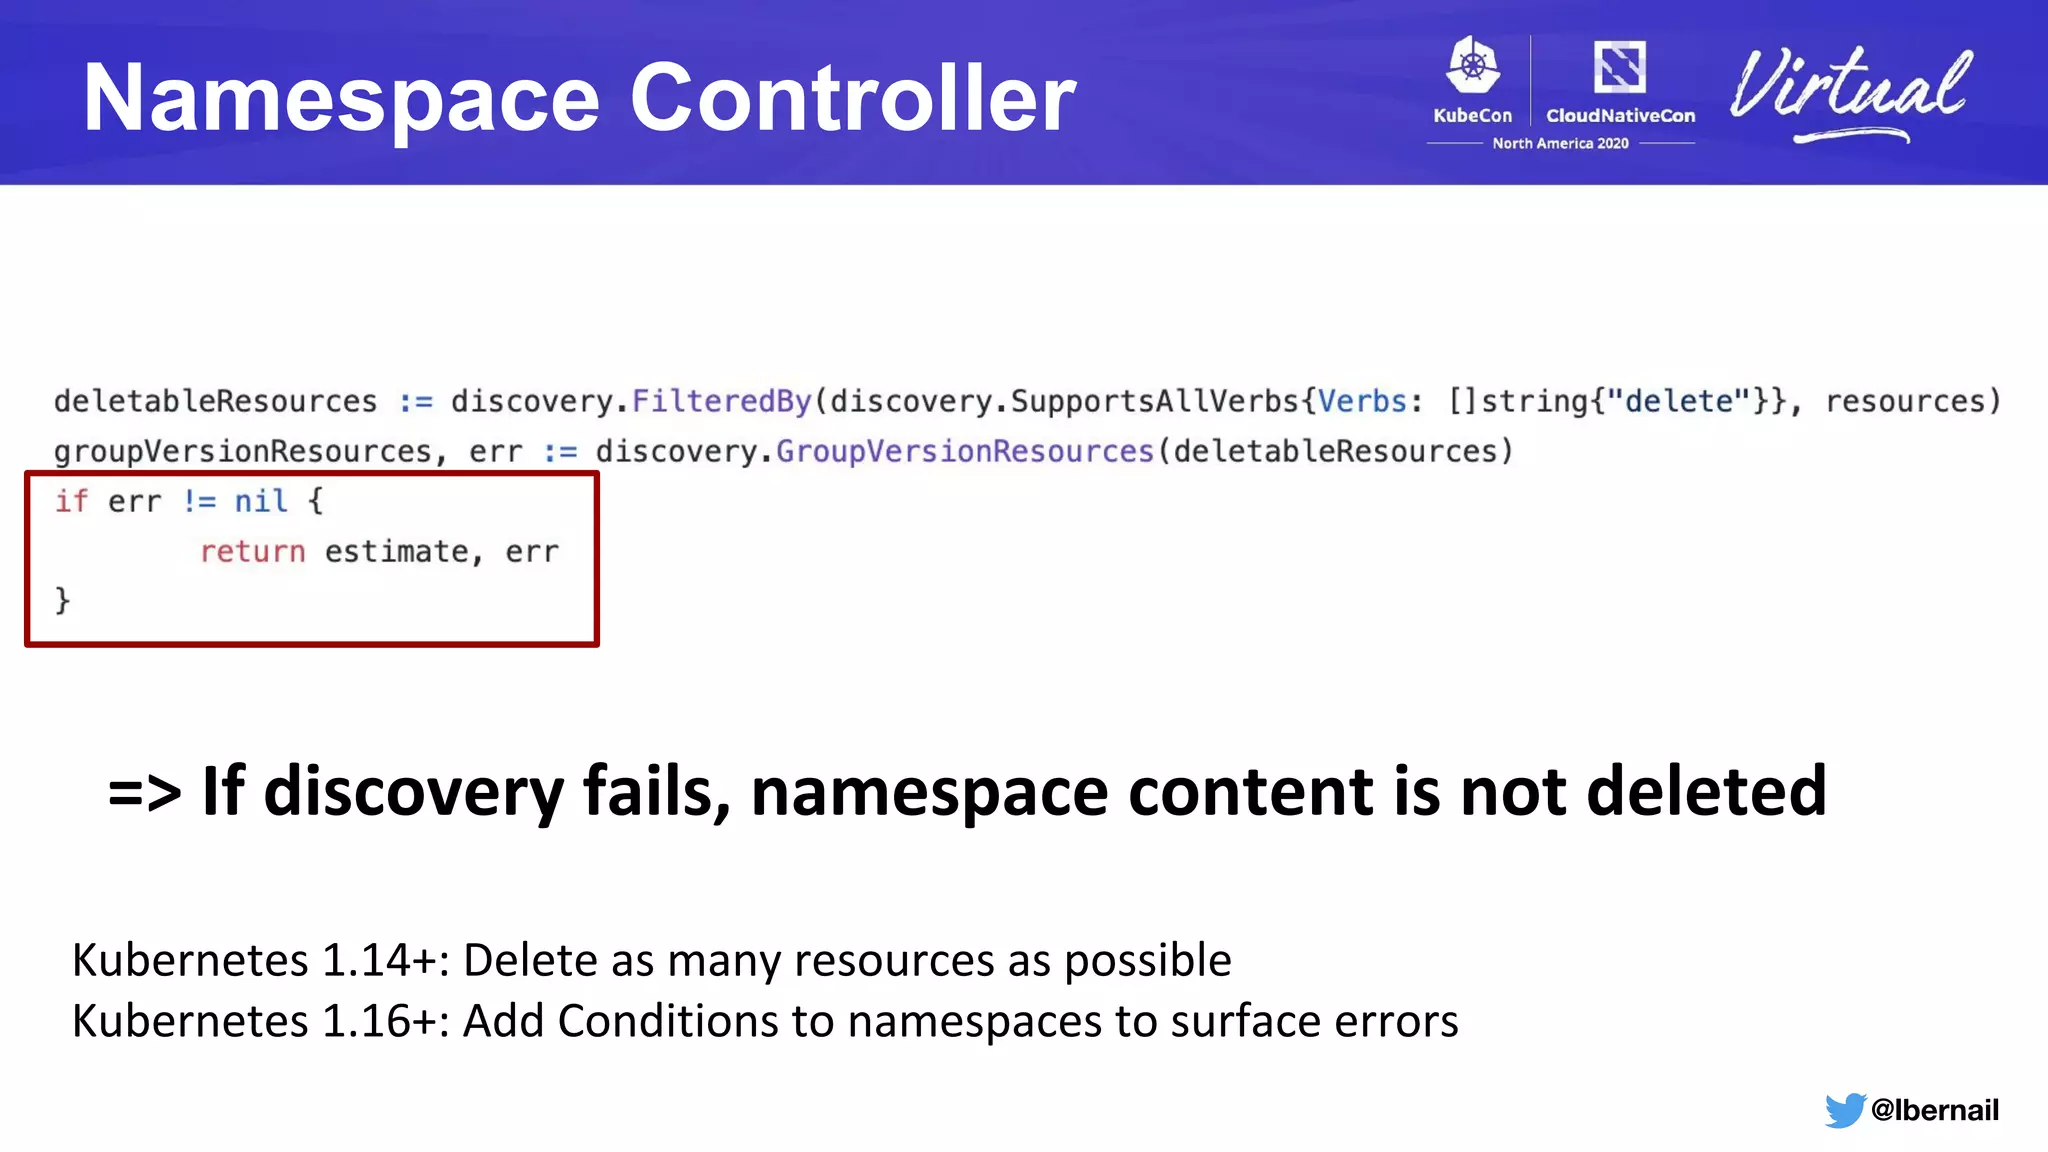
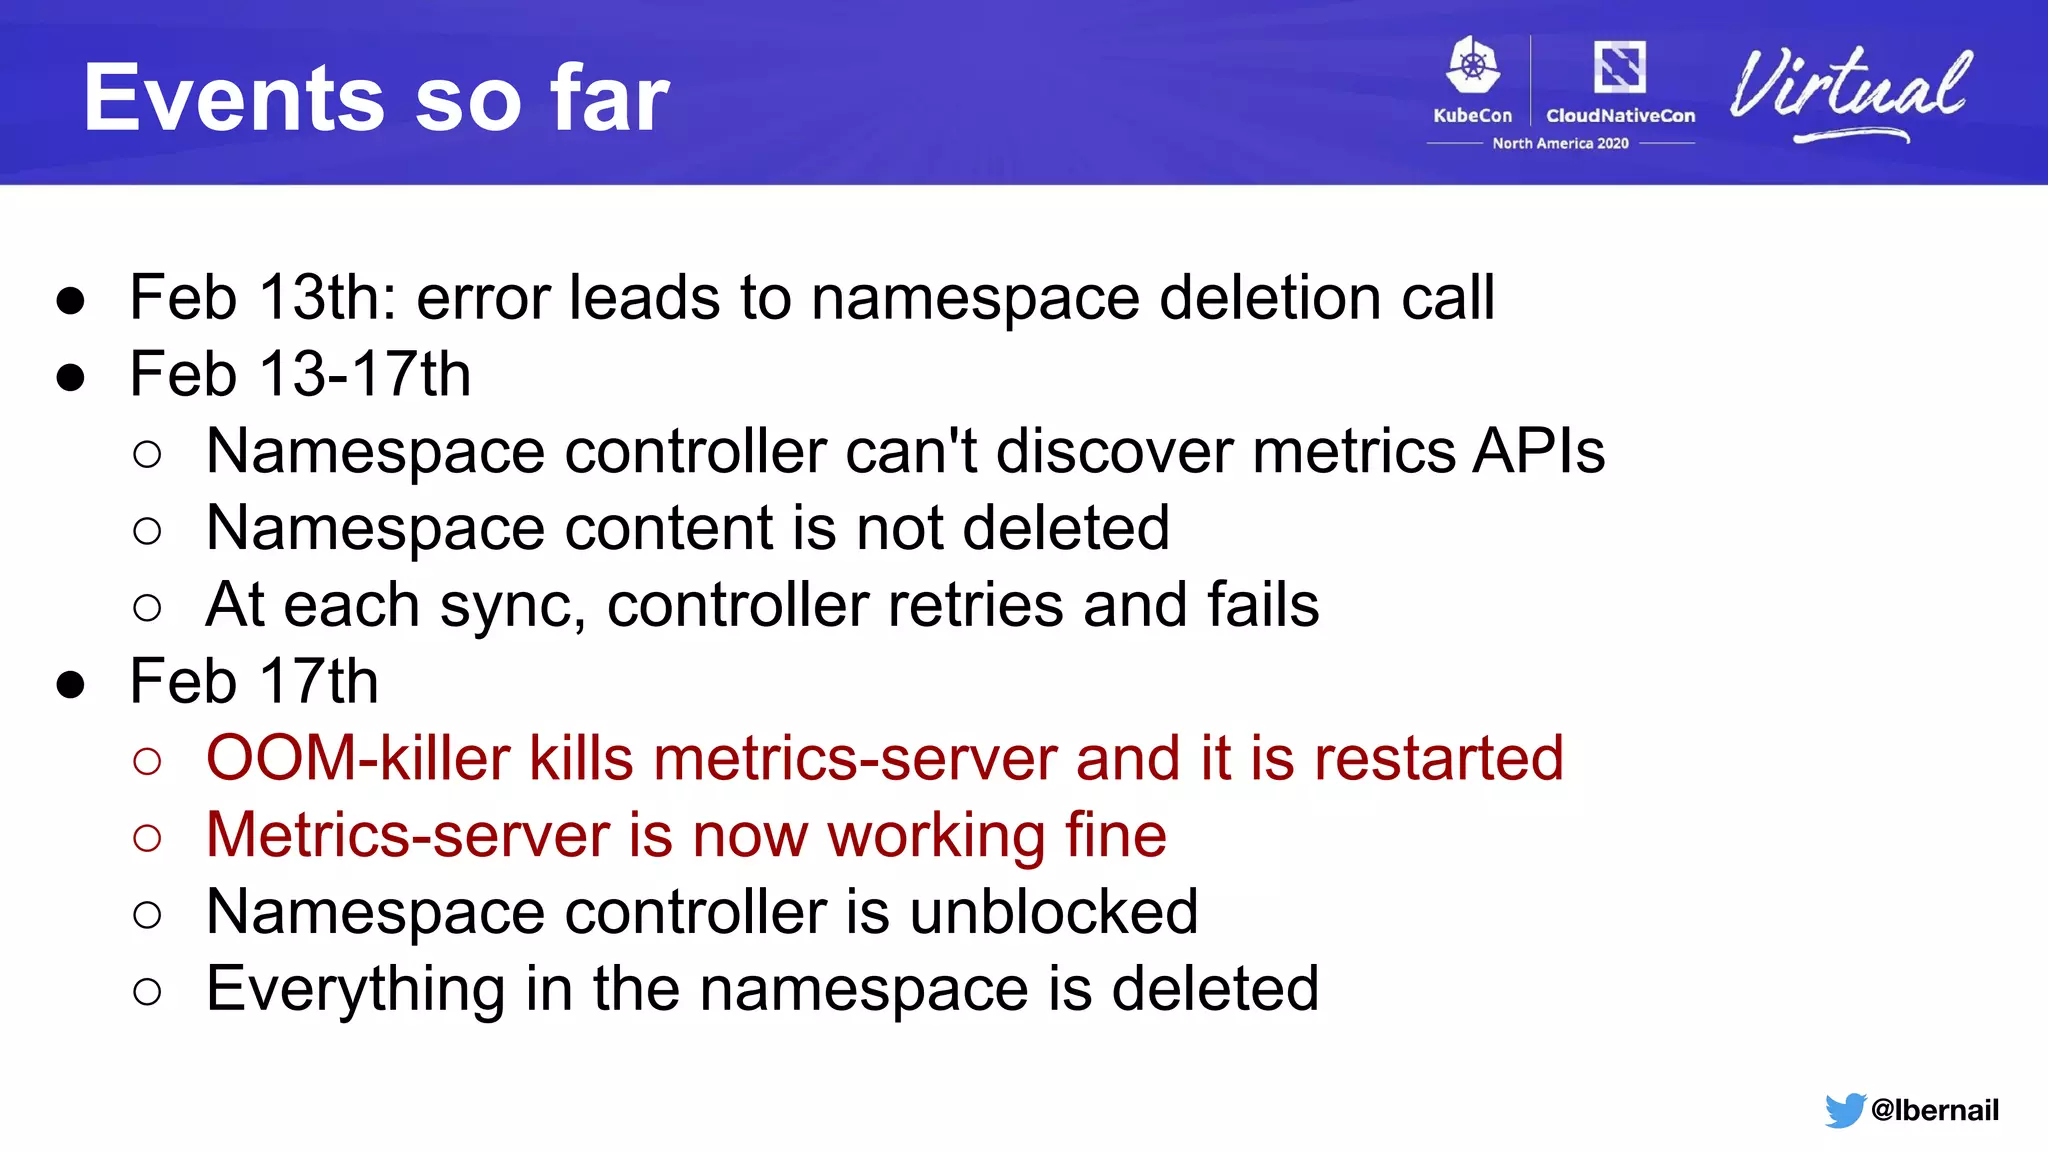
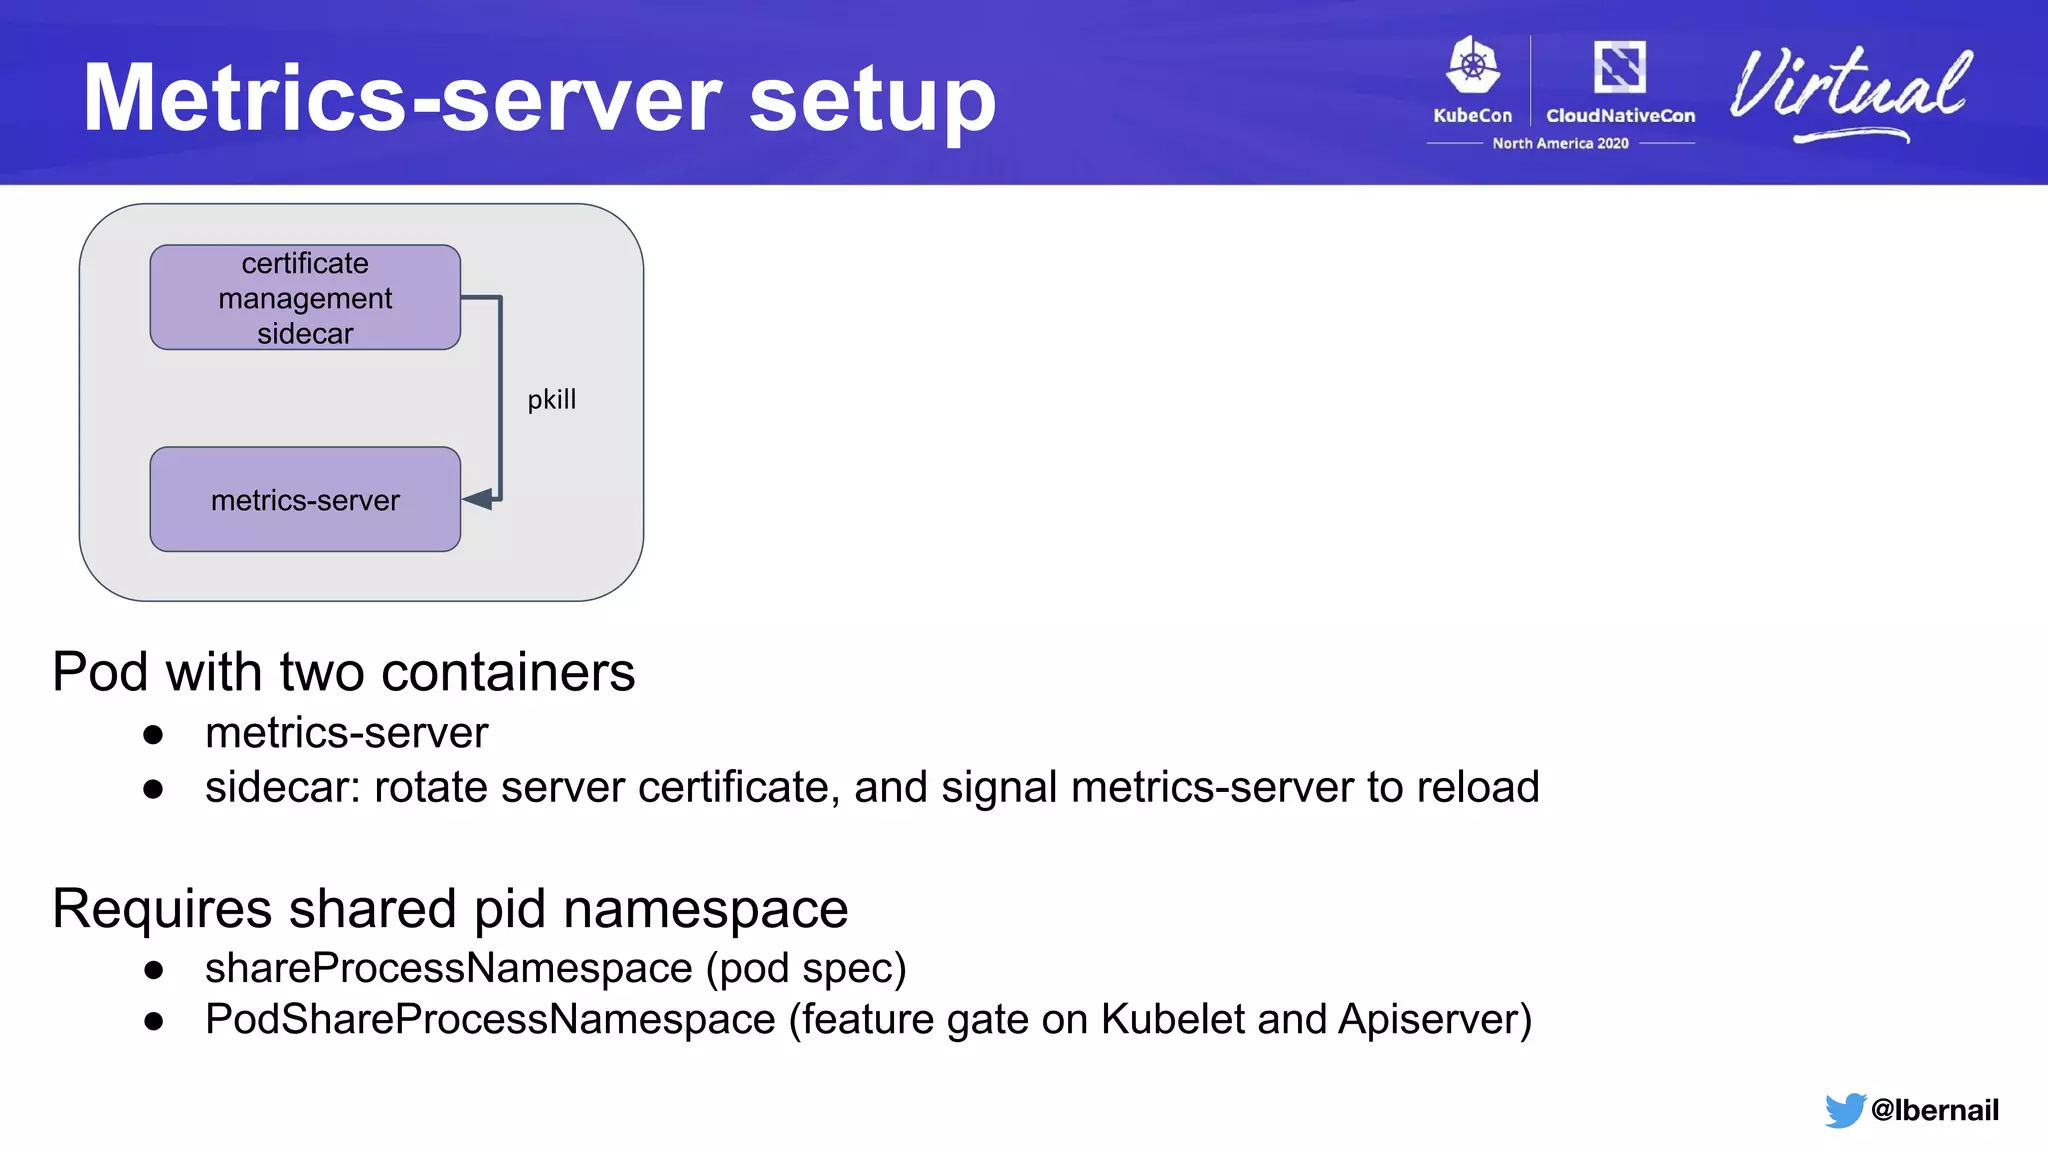
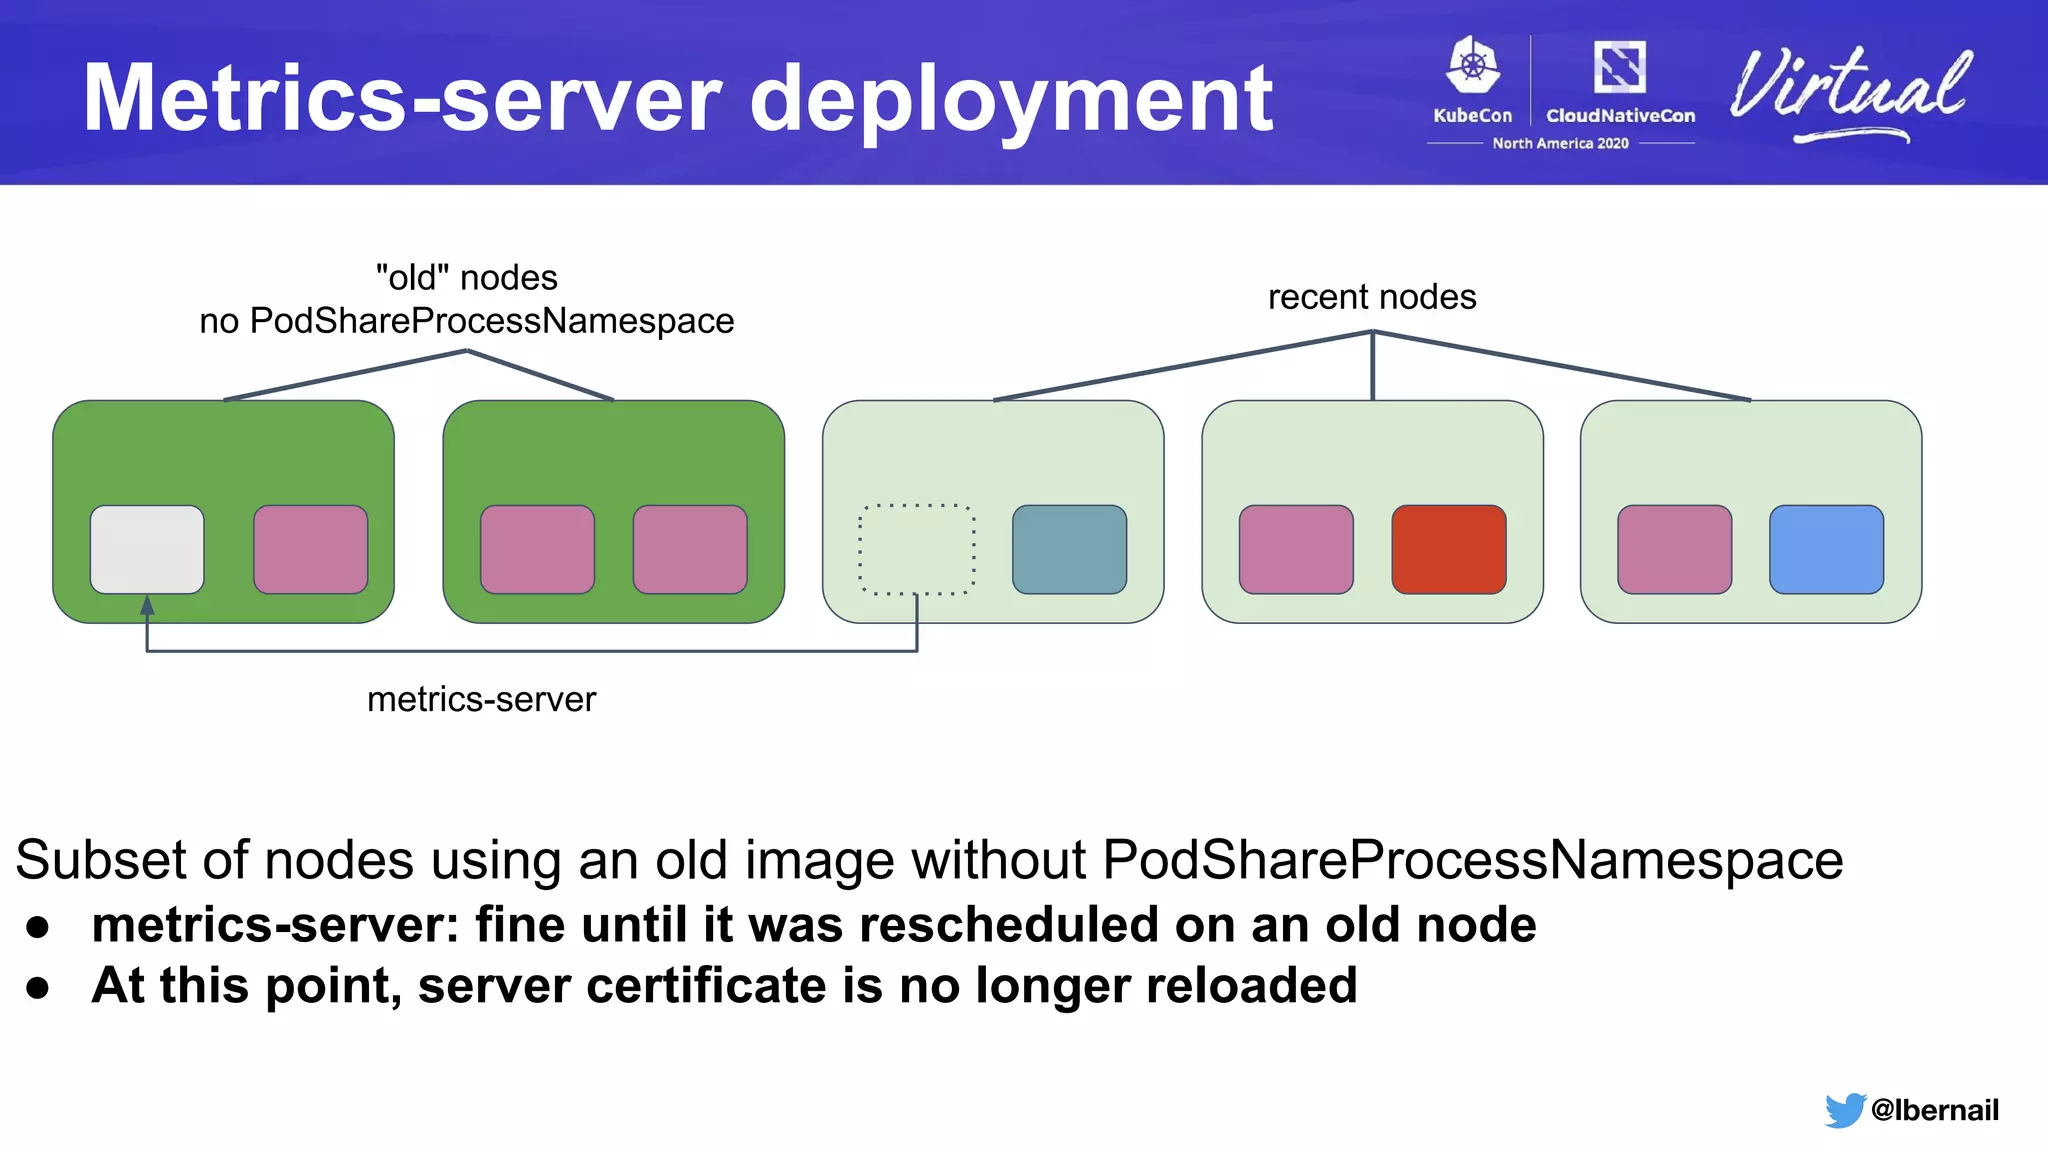
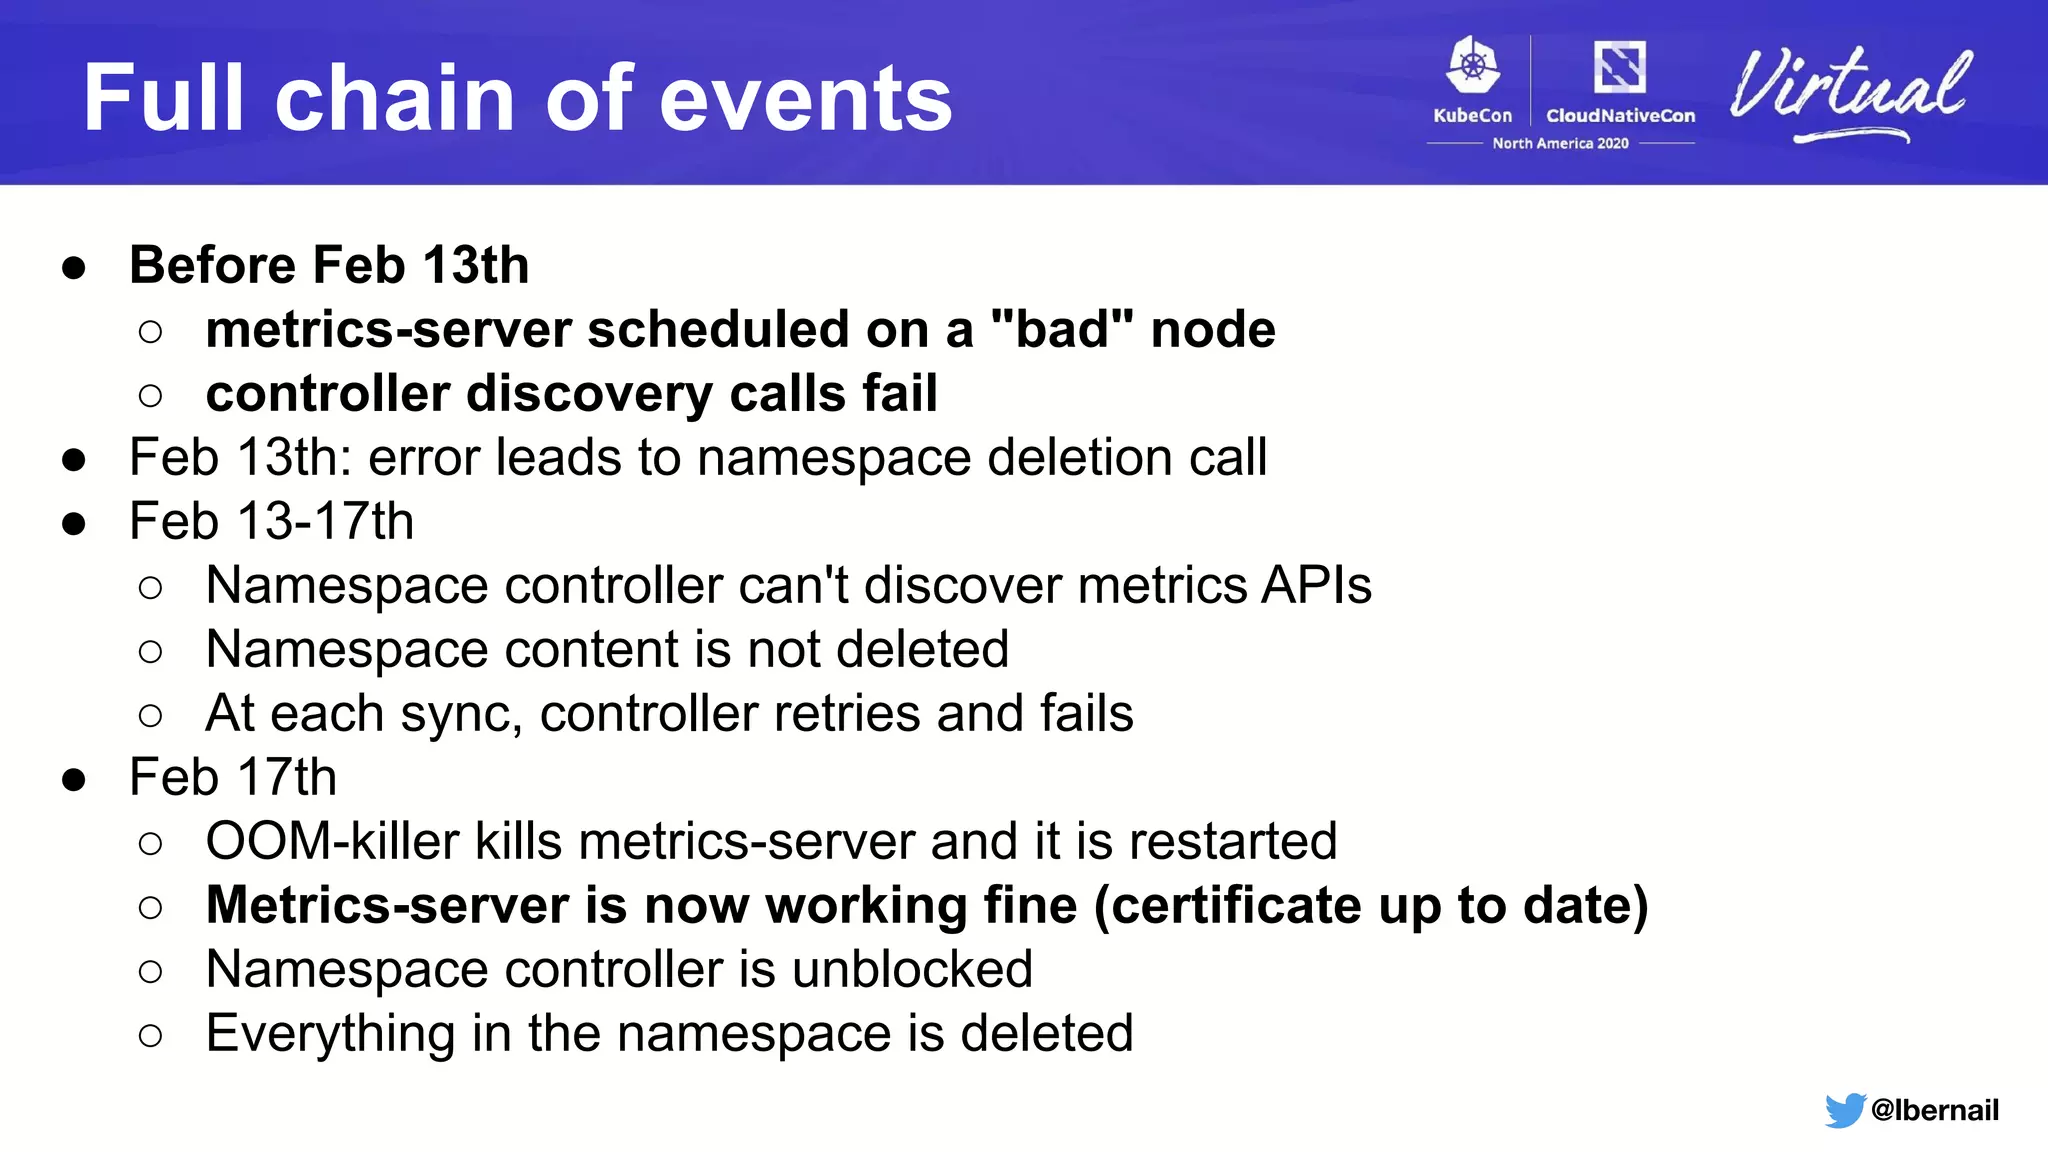
The document details a Kubernetes incident where a namespace and its resources were accidentally deleted due to a deletion call caused by a metrics-server failure. This failure was linked to an issue with the metrics-server's certificate management, exacerbated by an OOM-killer event that cleared the namespace. Additionally, it discusses broader implications such as the expensive nature of list calls to the apiserver, revealing that a single user contributed significantly to the excessive workload on the system.


![[오픈소스컨설팅] Linux Network Troubleshooting](https://cdn.slidesharecdn.com/ss_thumbnails/opensourceconsultingnetworktroubleshootingyjlee20210412-210413014206-thumbnail.jpg?width=640&height=640&fit=bounds)

![[OpenInfra Days Korea 2018] Day 2 - E6 - OpenInfra monitoring with Prometheus](https://cdn.slidesharecdn.com/ss_thumbnails/e61520monitoringopeninfrawithprometheusv1-180704062709-thumbnail.jpg?width=640&height=640&fit=bounds)

![[OpenInfra Days Korea 2018] Day 1 - T4-7: "Ceph 스토리지, PaaS로 서비스 운영하기"](https://cdn.slidesharecdn.com/ss_thumbnails/47openinfradaykorea2018hyun-ha-180705032301-thumbnail.jpg?width=640&height=640&fit=bounds)


![[오픈소스컨설팅] EFK Stack 소개와 설치 방법](https://cdn.slidesharecdn.com/ss_thumbnails/elasticstack-210712042246-thumbnail.jpg?width=640&height=640&fit=bounds)


![Vibe Coding vs. Spec-Driven Development [Free Meetup]](https://cdn.slidesharecdn.com/ss_thumbnails/vibecodingvsspecdrivendevelopment-251209105622-43f455e7-thumbnail.jpg?width=640&height=640&fit=bounds)


