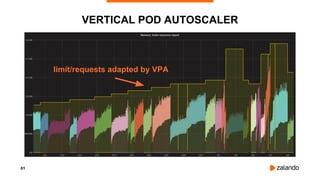
DEVOPS GATHERING
BOCHUM
2019-03-13
HENNING JACOBS
@try_except_
Ensuring Kubernetes
Cost Efficiency
across (many)
Clusters
2
ZALANDO AT A GLANCE
~ 5.4billion EUR
revenue 2018
> 250
million
visits
per
month
> 15.000
employees in
Europe
> 79%
of visits via
mobile devices
> 26
million
active customers
> 300.000
product choices
~ 2.000
brands
17
countries
3
SCALE
100Clusters
373Accounts
4
ZALANDO: DEVELOPERS USING KUBERNETES
5
6
Is this a lot? Is this cost efficient?
7
¯_(ツ)_/¯
Do you know your per unit costs?
8
THE MAGIC DIAL
Speed
Stability
Overprovision
Higher Cost
Efficiency
Risk
Overcommit
Lower Cost
9
THE BASICS
10
KUBERNETES: IT'S ALL ABOUT RESOURCES
Node Node
Pods demand capacity
Nodes offer capacity
Scheduler
11
COMPUTE RESOURCE TYPES
● CPU
● Memory
● Local ephemeral storage (1.12+)
● Extended Resources
○ GPU
○ TPU?
Node
12
KUBERNETES RESOURCES
CPU
○ Base: 1 AWS vCPU (or GCP Core or ..)
○ Example: 100m (0.1 vCPU, "100 Millicores")
Memory
○ Base: 1 Byte
○ Example: 500Mi (500 MiB memory)
13
REQUESTS / LIMITS
Requests
○ Affect Scheduling Decision
○ Priority (CPU, OOM adjust)
Limits
○ Limit maximum container usage
resources:
requests:
cpu: 100m
memory: 300Mi
limits:
cpu: 1
memory: 300Mi
14
Pod 1
REQUESTS: POD SCHEDULING
CPU
Memory
Pod 2CPU
Memory
Node 1
Node 2
CPU
Memory
Pod 3
Requests
15
POD SCHEDULING
CPU
Memory
CPU
Memory
Node 1
Node 2
Pod 4
16
POD SCHEDULING: TRY TO FIT
CPU
Memory
CPU
Memory
Node 1
Node 2
17
POD SCHEDULING: NO CAPACITY
CPU
Memory
CPU
Memory
Node 1
Node 2
Pod 4
"PENDING"
18
REQUESTS: CPU SHARES
kubectl run --requests=cpu=10m/5m ..sha512()..
cat /sys/fs/cgroup/cpu/kubepods/burstable/pod5d5..0d/cpu.shares
10 // relative share of CPU time
cat /sys/fs/cgroup/cpu/kubepods/burstable/pod6e0..0d/cpu.shares
5 // relative share of CPU time
cat /sys/fs/cgroup/cpuacct/kubepods/burstable/pod5d5..0d/cpuacct.usage
/sys/fs/cgroup/cpuacct/kubepods/burstable/pod6e0..0d/cpuacct.usage
13432815283 // total CPU time in nanoseconds
7528759332 // total CPU time in nanoseconds
19
LIMITS: COMPRESSIBLE RESOURCES
Can be taken away quickly,
"only" cause slowness
CPU Throttling
200m CPU limit
⇒ container can use 0.2s of CPU time per second
20
CPU THROTTLING
docker run --cpus CPUS -it python
python -m timeit -s 'import hashlib' -n 10000 -v
'hashlib.sha512().update(b"foo")'
CPUS=1.0 3.8 - 4ms
CPUS=0.5 3.8 - 52ms
CPUS=0.2 6.8 - 88ms
CPUS=0.1 5.7 - 190ms
more CPU throttling,
slower hash computation
21
LIMITS: NON-COMPRESSIBLE RESOURCES
Hold state,
are slower to take away.
⇒ Killing (OOMKill)
22
MEMORY LIMITS: OUT OF MEMORY
kubectl get pod
NAME READY STATUS RESTARTS AGE
kube-ops-view-7bc-tcwkt 0/1 CrashLoopBackOff 3 2m
kubectl describe pod kube-ops-view-7bc-tcwkt
...
Last State: Terminated
Reason: OOMKilled
Exit Code: 137
23
QUALITY OF SERVICE (QOS)
Guaranteed: all containers have limits == requests
Burstable: some containers have limits > requests
BestEffort: no requests/limits set
kubectl describe pod …
Limits:
memory: 100Mi
Requests:
cpu: 100m
memory: 100Mi
QoS Class: Burstable
24
OVERCOMMIT
Limits > Requests ⇒ Burstable QoS ⇒ Overcommit
For CPU: fine, running into completely fair scheduling
For memory: fine, as long as demand < node capacity
https://code.fb.com/production-engineering/oomd/
Might run into unpredictable OOM
situations when demand reaches node's
memory capacity (Kernel OOM Killer)
25
LIMITS: CGROUPS
docker run --cpus 1 -m 200m --rm -it busybox
cat /sys/fs/cgroup/cpu/docker/8ab25..1c/cpu.{shares,cfs_*}
1024 // cpu.shares (default value)
100000 // cpu.cfs_period_us (100ms period length)
100000 // cpu.cfs_quota_us (total CPU time in µs consumable per period)
cat /sys/fs/cgroup/memory/docker/8ab25..1c/memory.limit_in_bytes
209715200
26
LIMITS: PROBLEMS
1. CPU CFS Quota: Latency
2. Memory: accounting, OOM behavior
27
PROBLEMS: LATENCY
https://github.com/zalando-incubator/kubernetes-on-aws/pull/923
28
PROBLEMS: HARDCODED PERIOD
29
PROBLEMS: HARDCODED PERIOD
https://github.com/kubernetes/kubernetes/issues/51135
30
NOW IN KUBERNETES 1.12
https://github.com/kubernetes/kubernetes/pull/63437
31
OVERLY AGGRESSIVE CFS
Usage < Limit,
but heavy
throttling
32
OVERLY AGGRESSIVE CFS: EXPERIMENT #1
CPU Period: 100ms
CPU Quota: None
Burn 5ms and sleep 100ms
⇒ Quota disabled
⇒ No Throttling expected!
https://gist.github.com/bobrik/2030ff040fad360327a5fab7a09c4ff1
33
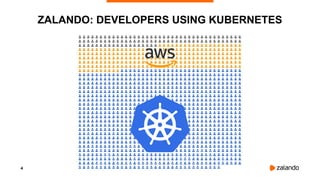
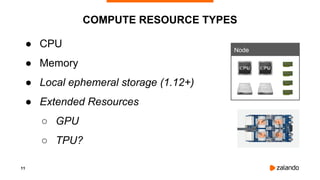
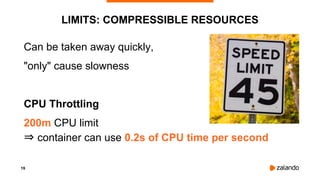
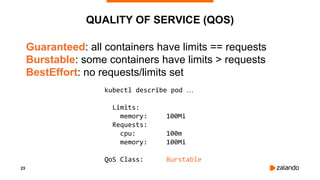
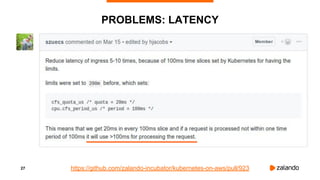
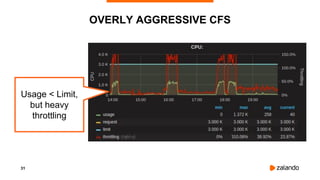
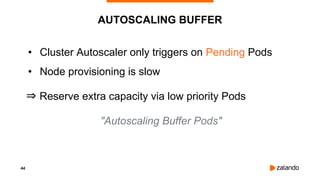
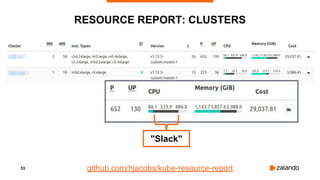
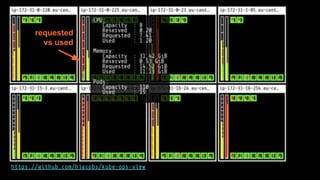
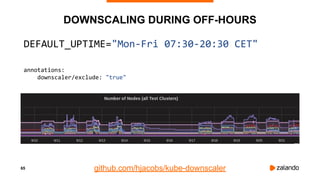
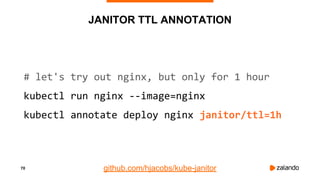
EXPERIMENT #1: NO QUOTA, NO THROTTLING
2018/11/03 13:04:02 [0] burn took 5ms, real time so far: 5ms, cpu time so far: 6ms
2018/11/03 13:04:03 [1] burn took 5ms, real time so far: 510ms, cpu time so far: 11ms
2018/11/03 13:04:03 [2] burn took 5ms, real time so far: 1015ms, cpu time so far: 17ms
2018/11/03 13:04:04 [3] burn took 5ms, real time so far: 1520ms, cpu time so far: 23ms
2018/11/03 13:04:04 [4] burn took 5ms, real time so far: 2025ms, cpu time so far: 29ms
2018/11/03 13:04:05 [5] burn took 5ms, real time so far: 2530ms, cpu time so far: 35ms
2018/11/03 13:04:05 [6] burn took 5ms, real time so far: 3036ms, cpu time so far: 40ms
2018/11/03 13:04:06 [7] burn took 5ms, real time so far: 3541ms, cpu time so far: 46ms
2018/11/03 13:04:06 [8] burn took 5ms, real time so far: 4046ms, cpu time so far: 52ms
2018/11/03 13:04:07 [9] burn took 5ms, real time so far: 4551ms, cpu time so far: 58ms
34
OVERLY AGGRESSIVE CFS: EXPERIMENT #2
CPU Period: 100ms
CPU Quota: 20ms
Burn 5ms and sleep 500ms
⇒ No 100ms intervals where possibly 20ms is burned
⇒ No Throttling expected!
35
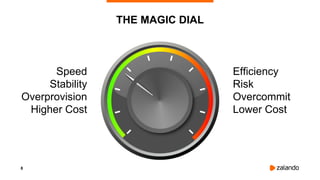
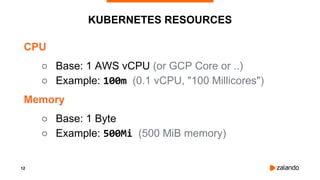
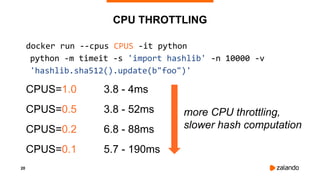
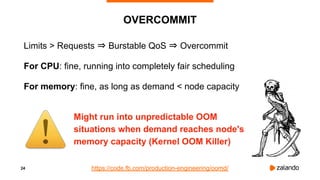
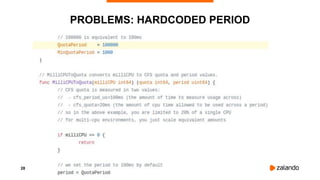
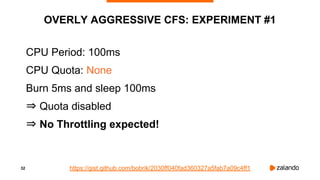
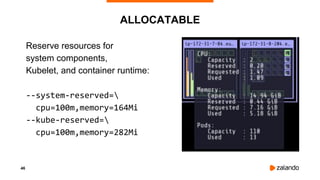
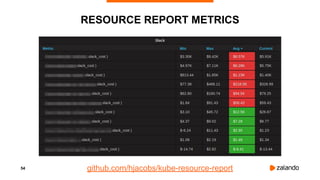
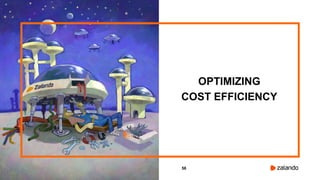
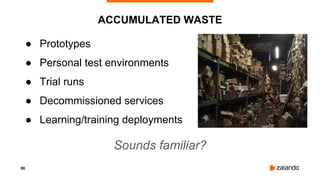
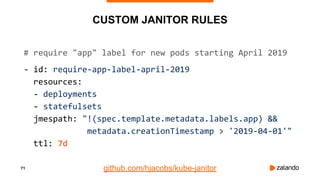
EXPERIMENT #2: OVERLY AGGRESSIVE CFS
2018/11/03 13:05:05 [0] burn took 5ms, real time so far: 5ms, cpu time so far: 5ms
2018/11/03 13:05:06 [1] burn took 99ms, real time so far: 690ms, cpu time so far: 9ms
2018/11/03 13:05:06 [2] burn took 99ms, real time so far: 1290ms, cpu time so far: 14ms
2018/11/03 13:05:07 [3] burn took 99ms, real time so far: 1890ms, cpu time so far: 18ms
2018/11/03 13:05:07 [4] burn took 5ms, real time so far: 2395ms, cpu time so far: 24ms
2018/11/03 13:05:08 [5] burn took 94ms, real time so far: 2990ms, cpu time so far: 27ms
2018/11/03 13:05:09 [6] burn took 99ms, real time so far: 3590ms, cpu time so far: 32ms
2018/11/03 13:05:09 [7] burn took 5ms, real time so far: 4095ms, cpu time so far: 37ms
2018/11/03 13:05:10 [8] burn took 5ms, real time so far: 4600ms, cpu time so far: 43ms
2018/11/03 13:05:10 [9] burn took 5ms, real time so far: 5105ms, cpu time so far: 49ms
36
OVERLY AGGRESSIVE CFS: EXPERIMENT #3
CPU Period: 10ms
CPU Quota: 2ms
Burn 5ms and sleep 100ms
⇒ Same 20% CPU (200m) limit, but smaller period
⇒ Throttling expected!
37
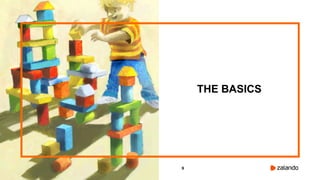
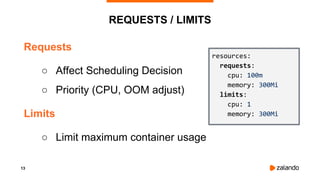
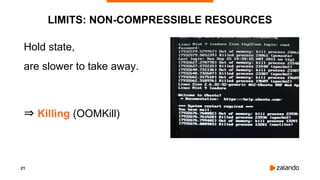
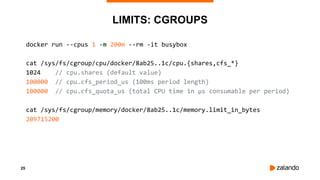
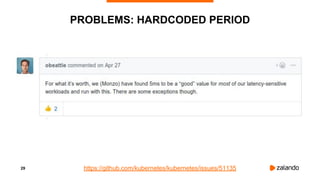
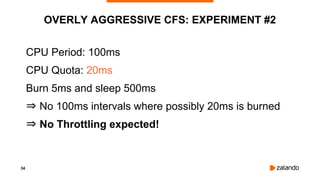
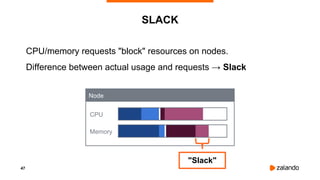
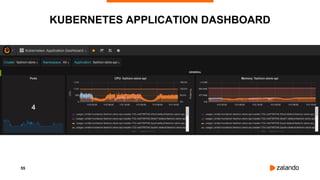
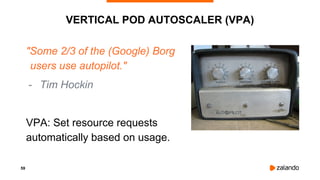
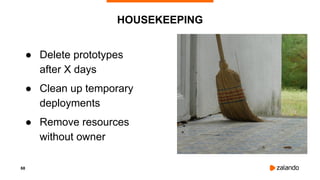
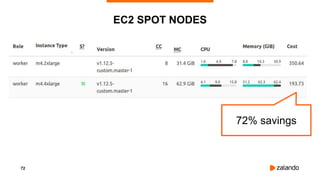
SMALLER CPU PERIOD ⇒ BETTER LATENCY
2018/11/03 16:31:07 [0] burn took 18ms, real time so far: 18ms, cpu time so far: 6ms
2018/11/03 16:31:07 [1] burn took 9ms, real time so far: 128ms, cpu time so far: 8ms
2018/11/03 16:31:07 [2] burn took 9ms, real time so far: 238ms, cpu time so far: 13ms
2018/11/03 16:31:07 [3] burn took 5ms, real time so far: 343ms, cpu time so far: 18ms
2018/11/03 16:31:07 [4] burn took 30ms, real time so far: 488ms, cpu time so far: 24ms
2018/11/03 16:31:07 [5] burn took 19ms, real time so far: 608ms, cpu time so far: 29ms
2018/11/03 16:31:07 [6] burn took 9ms, real time so far: 718ms, cpu time so far: 34ms
2018/11/03 16:31:08 [7] burn took 5ms, real time so far: 824ms, cpu time so far: 40ms
2018/11/03 16:31:08 [8] burn took 5ms, real time so far: 943ms, cpu time so far: 45ms
2018/11/03 16:31:08 [9] burn took 9ms, real time so far: 1068ms, cpu time so far: 48ms
38
LIMITS: VISIBILITY
docker run --cpus 1 -m 200m --rm -it busybox top
Mem: 7369128K used, 726072K free, 128164K shrd, 303924K buff, 1208132K cached
CPU0: 14.8% usr 8.4% sys 0.2% nic 67.6% idle 8.2% io 0.0% irq 0.6% sirq
CPU1: 8.8% usr 10.3% sys 0.0% nic 75.9% idle 4.4% io 0.0% irq 0.4% sirq
CPU2: 7.3% usr 8.7% sys 0.0% nic 63.2% idle 20.1% io 0.0% irq 0.6% sirq
CPU3: 9.3% usr 9.9% sys 0.0% nic 65.7% idle 14.5% io 0.0% irq 0.4% sirq
39
• Container-aware memory configuration
• JVM MaxHeap
• Container-aware processor configuration
• Thread pools
• GOMAXPROCS
• node.js cluster module
LIMITS: VISIBILITY
40
KUBERNETES RESOURCES
41
ZALANDO: DECISION
1. Forbid Memory Overcommit
• Implement mutating admission webhook
• Set requests = limits
2. Disable CPU CFS Quota in all clusters
• --cpu-fs-quota=false
42
INGRESS LATENCY IMPROVEMENT
43
CLUSTER AUTOSCALER
Simulates the Kubernetes scheduler internally to find out..
• ..if any of the pods wouldn’t fit on existing nodes
⇒ upscale is needed
• ..if it’s possible to fit some of the pods on existing nodes
⇒ downscale is needed
⇒ Cluster size is determined by resource requests
(+ constraints)
github.com/kubernetes/autoscaler/tree/master/cluster-autoscaler
44
AUTOSCALING BUFFER
• Cluster Autoscaler only triggers on Pending Pods
• Node provisioning is slow
⇒ Reserve extra capacity via low priority Pods
"Autoscaling Buffer Pods"
45
AUTOSCALING BUFFER
kubectl describe pod autoscaling-buffer-..zjq5 -n kube-system
...
Namespace: kube-system
Priority: -1000000
PriorityClassName: autoscaling-buffer
Containers:
pause:
Image: teapot/pause-amd64:3.1
Requests:
cpu: 1600m
memory: 6871947673
Evict if higher
priority (default)
Pod needs
capacity
46
ALLOCATABLE
Reserve resources for
system components,
Kubelet, and container runtime:
--system-reserved=
cpu=100m,memory=164Mi
--kube-reserved=
cpu=100m,memory=282Mi
47
CPU/memory requests "block" resources on nodes.
Difference between actual usage and requests → Slack
SLACK
CPU
Memory
Node
"Slack"
48
STRANDED RESOURCES
Stranded
CPU
Memory
CPU
Memory
Node 1
Node 2
Some available capacity
can become unusable /
stranded.
⇒ Reschedule, bin packing
49
MONITORING
COST EFFICIENCY
50
KUBERNETES RESOURCE REPORT
github.com/hjacobs/kube-resource-report
51
RESOURCE REPORT: TEAMS
Sorting teams by
Slack Costs
github.com/hjacobs/kube-resource-report
52
RESOURCE REPORT: APPLICATIONS
"Slack"
53
RESOURCE REPORT: CLUSTERS
github.com/hjacobs/kube-resource-report
"Slack"
54
RESOURCE REPORT METRICS
github.com/hjacobs/kube-resource-report
55
KUBERNETES APPLICATION DASHBOARD
https://github.com/hjacobs/kube-ops-view
requested
vs used
58
OPTIMIZING
COST EFFICIENCY
59
VERTICAL POD AUTOSCALER (VPA)
"Some 2/3 of the (Google) Borg
users use autopilot."
- Tim Hockin
VPA: Set resource requests
automatically based on usage.
60
VPA FOR PROMETHEUS
apiVersion: poc.autoscaling.k8s.io/v1alpha1
kind: VerticalPodAutoscaler
metadata:
name: prometheus-vpa
namespace: kube-system
spec:
selector:
matchLabels:
application: prometheus
updatePolicy:
updateMode: Auto
CPU/memory
61
VERTICAL POD AUTOSCALER
limit/requests adapted by VPA
62
HORIZONTAL POD AUTOSCALER
apiVersion: autoscaling/v2beta1
kind: HorizontalPodAutoscaler
metadata:
name: myapp
spec:
scaleTargetRef:
apiVersion: apps/v1
kind: Deployment
name: myapp
minReplicas: 3
maxReplicas: 5
metrics:
- type: Resource
resource:
name: cpu
targetAverageUtilization: 100
target: ~100% of
CPU requests
...
63
HORIZONTAL POD AUTOSCALING (CUSTOM METRICS)
Queue Length
Prometheus Query
Ingress Req/s
ZMON Check
github.com/zalando-incubator/kube-metrics-adapter
64
DOWNSCALING DURING OFF-HOURS
github.com/hjacobs/kube-downscaler
Weekend
65
DOWNSCALING DURING OFF-HOURS
DEFAULT_UPTIME="Mon-Fri 07:30-20:30 CET"
annotations:
downscaler/exclude: "true"
github.com/hjacobs/kube-downscaler
66
ACCUMULATED WASTE
● Prototypes
● Personal test environments
● Trial runs
● Decommissioned services
● Learning/training deployments
Sounds familiar?
Example: Getting started
with Zalenium & UI Tests
Example: Step by step guide to the first UI test with Zalenium running in the
Continuous Delivery Platform. I was always afraid of UI tests because it looked too
difficult to get started, Zalenium solved this problem for me.
68
HOUSEKEEPING
● Delete prototypes
after X days
● Clean up temporary
deployments
● Remove resources
without owner
69
KUBERNETES JANITOR
● TTL and expiry date annotations, e.g.
○ set time-to-live for your test deployment
● Custom rules, e.g.
○ delete everything without "app" label after 7 days
github.com/hjacobs/kube-janitor
70
JANITOR TTL ANNOTATION
# let's try out nginx, but only for 1 hour
kubectl run nginx --image=nginx
kubectl annotate deploy nginx janitor/ttl=1h
github.com/hjacobs/kube-janitor
71
CUSTOM JANITOR RULES
# require "app" label for new pods starting April 2019
- id: require-app-label-april-2019
resources:
- deployments
- statefulsets
jmespath: "!(spec.template.metadata.labels.app) &&
metadata.creationTimestamp > '2019-04-01'"
ttl: 7d
github.com/hjacobs/kube-janitor
72
EC2 SPOT NODES
72% savings
73
SPOT ASG / LAUNCH TEMPLATE
Not upstream in cluster-autoscaler (yet)
74
CLUSTER OVERHEAD: CONTROL PLANE
● GKE cluster: free
● EKS cluster: $146/month
● Zalando prod cluster: $635/month
(etcd nodes + master nodes + ELB)
Potential: fewer etcd nodes, no HA, shared control plane.
75
WHAT WORKED FOR US
● Disable CPU CFS Quota in all clusters
● Prevent memory overcommit
● Kubernetes Resource Report
● Downscaling during off-hours
● EC2 Spot
76
STABILITY ↔ EFFICIENCY
Slack
Autoscaling
Buffer
Disable
Overcommit
Cluster
Overhead
Resource
Report
HPA
VPA
Downscaler
Janitor
EC2 Spot
77
OPEN SOURCE
Kubernetes on AWS
github.com/zalando-incubator/kubernetes-on-aws
AWS ALB Ingress controller
github.com/zalando-incubator/kube-ingress-aws-controller
External DNS
github.com/kubernetes-incubator/external-dns
Postgres Operator
github.com/zalando/postgres-operator
Kubernetes Resource Report
github.com/hjacobs/kube-resource-report
Kubernetes Downscaler
github.com/hjacobs/kube-downscaler
Kubernetes Janitor
github.com/hjacobs/kube-janitor
78
OTHER TALKS/POSTS
• Everything You Ever Wanted to Know About Resource Scheduling
• Inside Kubernetes Resource Management (QoS) - KubeCon 2018
• Setting Resource Requests and Limits in Kubernetes (Best Practices)
• Effectively Managing Kubernetes Resources with Cost Monitoring
QUESTIONS?
HENNING JACOBS
HEAD OF
DEVELOPER PRODUCTIVITY
henning@zalando.de
@try_except_
Illustrations by @01k

Ensuring Kubernetes Cost Efficiency across (many) Clusters - DevOps Gathering 2019

  • 1.
    DEVOPS GATHERING BOCHUM 2019-03-13 HENNING JACOBS @try_except_ EnsuringKubernetes Cost Efficiency across (many) Clusters
  • 2.
    2 ZALANDO AT AGLANCE ~ 5.4billion EUR revenue 2018 > 250 million visits per month > 15.000 employees in Europe > 79% of visits via mobile devices > 26 million active customers > 300.000 product choices ~ 2.000 brands 17 countries
  • 3.
  • 4.
  • 5.
  • 6.
    6 Is this alot? Is this cost efficient?
  • 7.
    7 ¯_(ツ)_/¯ Do you knowyour per unit costs?
  • 8.
    8 THE MAGIC DIAL Speed Stability Overprovision HigherCost Efficiency Risk Overcommit Lower Cost
  • 9.
  • 10.
    10 KUBERNETES: IT'S ALLABOUT RESOURCES Node Node Pods demand capacity Nodes offer capacity Scheduler
  • 11.
    11 COMPUTE RESOURCE TYPES ●CPU ● Memory ● Local ephemeral storage (1.12+) ● Extended Resources ○ GPU ○ TPU? Node
  • 12.
    12 KUBERNETES RESOURCES CPU ○ Base:1 AWS vCPU (or GCP Core or ..) ○ Example: 100m (0.1 vCPU, "100 Millicores") Memory ○ Base: 1 Byte ○ Example: 500Mi (500 MiB memory)
  • 13.
    13 REQUESTS / LIMITS Requests ○Affect Scheduling Decision ○ Priority (CPU, OOM adjust) Limits ○ Limit maximum container usage resources: requests: cpu: 100m memory: 300Mi limits: cpu: 1 memory: 300Mi
  • 14.
    14 Pod 1 REQUESTS: PODSCHEDULING CPU Memory Pod 2CPU Memory Node 1 Node 2 CPU Memory Pod 3 Requests
  • 15.
  • 16.
    16 POD SCHEDULING: TRYTO FIT CPU Memory CPU Memory Node 1 Node 2
  • 17.
    17 POD SCHEDULING: NOCAPACITY CPU Memory CPU Memory Node 1 Node 2 Pod 4 "PENDING"
  • 18.
    18 REQUESTS: CPU SHARES kubectlrun --requests=cpu=10m/5m ..sha512().. cat /sys/fs/cgroup/cpu/kubepods/burstable/pod5d5..0d/cpu.shares 10 // relative share of CPU time cat /sys/fs/cgroup/cpu/kubepods/burstable/pod6e0..0d/cpu.shares 5 // relative share of CPU time cat /sys/fs/cgroup/cpuacct/kubepods/burstable/pod5d5..0d/cpuacct.usage /sys/fs/cgroup/cpuacct/kubepods/burstable/pod6e0..0d/cpuacct.usage 13432815283 // total CPU time in nanoseconds 7528759332 // total CPU time in nanoseconds
  • 19.
    19 LIMITS: COMPRESSIBLE RESOURCES Canbe taken away quickly, "only" cause slowness CPU Throttling 200m CPU limit ⇒ container can use 0.2s of CPU time per second
  • 20.
    20 CPU THROTTLING docker run--cpus CPUS -it python python -m timeit -s 'import hashlib' -n 10000 -v 'hashlib.sha512().update(b"foo")' CPUS=1.0 3.8 - 4ms CPUS=0.5 3.8 - 52ms CPUS=0.2 6.8 - 88ms CPUS=0.1 5.7 - 190ms more CPU throttling, slower hash computation
  • 21.
    21 LIMITS: NON-COMPRESSIBLE RESOURCES Holdstate, are slower to take away. ⇒ Killing (OOMKill)
  • 22.
    22 MEMORY LIMITS: OUTOF MEMORY kubectl get pod NAME READY STATUS RESTARTS AGE kube-ops-view-7bc-tcwkt 0/1 CrashLoopBackOff 3 2m kubectl describe pod kube-ops-view-7bc-tcwkt ... Last State: Terminated Reason: OOMKilled Exit Code: 137
  • 23.
    23 QUALITY OF SERVICE(QOS) Guaranteed: all containers have limits == requests Burstable: some containers have limits > requests BestEffort: no requests/limits set kubectl describe pod … Limits: memory: 100Mi Requests: cpu: 100m memory: 100Mi QoS Class: Burstable
  • 24.
    24 OVERCOMMIT Limits > Requests⇒ Burstable QoS ⇒ Overcommit For CPU: fine, running into completely fair scheduling For memory: fine, as long as demand < node capacity https://code.fb.com/production-engineering/oomd/ Might run into unpredictable OOM situations when demand reaches node's memory capacity (Kernel OOM Killer)
  • 25.
    25 LIMITS: CGROUPS docker run--cpus 1 -m 200m --rm -it busybox cat /sys/fs/cgroup/cpu/docker/8ab25..1c/cpu.{shares,cfs_*} 1024 // cpu.shares (default value) 100000 // cpu.cfs_period_us (100ms period length) 100000 // cpu.cfs_quota_us (total CPU time in µs consumable per period) cat /sys/fs/cgroup/memory/docker/8ab25..1c/memory.limit_in_bytes 209715200
  • 26.
    26 LIMITS: PROBLEMS 1. CPUCFS Quota: Latency 2. Memory: accounting, OOM behavior
  • 27.
  • 28.
  • 29.
  • 30.
    30 NOW IN KUBERNETES1.12 https://github.com/kubernetes/kubernetes/pull/63437
  • 31.
    31 OVERLY AGGRESSIVE CFS Usage< Limit, but heavy throttling
  • 32.
    32 OVERLY AGGRESSIVE CFS:EXPERIMENT #1 CPU Period: 100ms CPU Quota: None Burn 5ms and sleep 100ms ⇒ Quota disabled ⇒ No Throttling expected! https://gist.github.com/bobrik/2030ff040fad360327a5fab7a09c4ff1
  • 33.
    33 EXPERIMENT #1: NOQUOTA, NO THROTTLING 2018/11/03 13:04:02 [0] burn took 5ms, real time so far: 5ms, cpu time so far: 6ms 2018/11/03 13:04:03 [1] burn took 5ms, real time so far: 510ms, cpu time so far: 11ms 2018/11/03 13:04:03 [2] burn took 5ms, real time so far: 1015ms, cpu time so far: 17ms 2018/11/03 13:04:04 [3] burn took 5ms, real time so far: 1520ms, cpu time so far: 23ms 2018/11/03 13:04:04 [4] burn took 5ms, real time so far: 2025ms, cpu time so far: 29ms 2018/11/03 13:04:05 [5] burn took 5ms, real time so far: 2530ms, cpu time so far: 35ms 2018/11/03 13:04:05 [6] burn took 5ms, real time so far: 3036ms, cpu time so far: 40ms 2018/11/03 13:04:06 [7] burn took 5ms, real time so far: 3541ms, cpu time so far: 46ms 2018/11/03 13:04:06 [8] burn took 5ms, real time so far: 4046ms, cpu time so far: 52ms 2018/11/03 13:04:07 [9] burn took 5ms, real time so far: 4551ms, cpu time so far: 58ms
  • 34.
    34 OVERLY AGGRESSIVE CFS:EXPERIMENT #2 CPU Period: 100ms CPU Quota: 20ms Burn 5ms and sleep 500ms ⇒ No 100ms intervals where possibly 20ms is burned ⇒ No Throttling expected!
  • 35.
    35 EXPERIMENT #2: OVERLYAGGRESSIVE CFS 2018/11/03 13:05:05 [0] burn took 5ms, real time so far: 5ms, cpu time so far: 5ms 2018/11/03 13:05:06 [1] burn took 99ms, real time so far: 690ms, cpu time so far: 9ms 2018/11/03 13:05:06 [2] burn took 99ms, real time so far: 1290ms, cpu time so far: 14ms 2018/11/03 13:05:07 [3] burn took 99ms, real time so far: 1890ms, cpu time so far: 18ms 2018/11/03 13:05:07 [4] burn took 5ms, real time so far: 2395ms, cpu time so far: 24ms 2018/11/03 13:05:08 [5] burn took 94ms, real time so far: 2990ms, cpu time so far: 27ms 2018/11/03 13:05:09 [6] burn took 99ms, real time so far: 3590ms, cpu time so far: 32ms 2018/11/03 13:05:09 [7] burn took 5ms, real time so far: 4095ms, cpu time so far: 37ms 2018/11/03 13:05:10 [8] burn took 5ms, real time so far: 4600ms, cpu time so far: 43ms 2018/11/03 13:05:10 [9] burn took 5ms, real time so far: 5105ms, cpu time so far: 49ms
  • 36.
    36 OVERLY AGGRESSIVE CFS:EXPERIMENT #3 CPU Period: 10ms CPU Quota: 2ms Burn 5ms and sleep 100ms ⇒ Same 20% CPU (200m) limit, but smaller period ⇒ Throttling expected!
  • 37.
    37 SMALLER CPU PERIOD⇒ BETTER LATENCY 2018/11/03 16:31:07 [0] burn took 18ms, real time so far: 18ms, cpu time so far: 6ms 2018/11/03 16:31:07 [1] burn took 9ms, real time so far: 128ms, cpu time so far: 8ms 2018/11/03 16:31:07 [2] burn took 9ms, real time so far: 238ms, cpu time so far: 13ms 2018/11/03 16:31:07 [3] burn took 5ms, real time so far: 343ms, cpu time so far: 18ms 2018/11/03 16:31:07 [4] burn took 30ms, real time so far: 488ms, cpu time so far: 24ms 2018/11/03 16:31:07 [5] burn took 19ms, real time so far: 608ms, cpu time so far: 29ms 2018/11/03 16:31:07 [6] burn took 9ms, real time so far: 718ms, cpu time so far: 34ms 2018/11/03 16:31:08 [7] burn took 5ms, real time so far: 824ms, cpu time so far: 40ms 2018/11/03 16:31:08 [8] burn took 5ms, real time so far: 943ms, cpu time so far: 45ms 2018/11/03 16:31:08 [9] burn took 9ms, real time so far: 1068ms, cpu time so far: 48ms
  • 38.
    38 LIMITS: VISIBILITY docker run--cpus 1 -m 200m --rm -it busybox top Mem: 7369128K used, 726072K free, 128164K shrd, 303924K buff, 1208132K cached CPU0: 14.8% usr 8.4% sys 0.2% nic 67.6% idle 8.2% io 0.0% irq 0.6% sirq CPU1: 8.8% usr 10.3% sys 0.0% nic 75.9% idle 4.4% io 0.0% irq 0.4% sirq CPU2: 7.3% usr 8.7% sys 0.0% nic 63.2% idle 20.1% io 0.0% irq 0.6% sirq CPU3: 9.3% usr 9.9% sys 0.0% nic 65.7% idle 14.5% io 0.0% irq 0.4% sirq
  • 39.
    39 • Container-aware memoryconfiguration • JVM MaxHeap • Container-aware processor configuration • Thread pools • GOMAXPROCS • node.js cluster module LIMITS: VISIBILITY
  • 40.
  • 41.
    41 ZALANDO: DECISION 1. ForbidMemory Overcommit • Implement mutating admission webhook • Set requests = limits 2. Disable CPU CFS Quota in all clusters • --cpu-fs-quota=false
  • 42.
  • 43.
    43 CLUSTER AUTOSCALER Simulates theKubernetes scheduler internally to find out.. • ..if any of the pods wouldn’t fit on existing nodes ⇒ upscale is needed • ..if it’s possible to fit some of the pods on existing nodes ⇒ downscale is needed ⇒ Cluster size is determined by resource requests (+ constraints) github.com/kubernetes/autoscaler/tree/master/cluster-autoscaler
  • 44.
    44 AUTOSCALING BUFFER • ClusterAutoscaler only triggers on Pending Pods • Node provisioning is slow ⇒ Reserve extra capacity via low priority Pods "Autoscaling Buffer Pods"
  • 45.
    45 AUTOSCALING BUFFER kubectl describepod autoscaling-buffer-..zjq5 -n kube-system ... Namespace: kube-system Priority: -1000000 PriorityClassName: autoscaling-buffer Containers: pause: Image: teapot/pause-amd64:3.1 Requests: cpu: 1600m memory: 6871947673 Evict if higher priority (default) Pod needs capacity
  • 46.
    46 ALLOCATABLE Reserve resources for systemcomponents, Kubelet, and container runtime: --system-reserved= cpu=100m,memory=164Mi --kube-reserved= cpu=100m,memory=282Mi
  • 47.
    47 CPU/memory requests "block"resources on nodes. Difference between actual usage and requests → Slack SLACK CPU Memory Node "Slack"
  • 48.
    48 STRANDED RESOURCES Stranded CPU Memory CPU Memory Node 1 Node2 Some available capacity can become unusable / stranded. ⇒ Reschedule, bin packing
  • 49.
  • 50.
  • 51.
    51 RESOURCE REPORT: TEAMS Sortingteams by Slack Costs github.com/hjacobs/kube-resource-report
  • 52.
  • 53.
  • 54.
  • 55.
  • 56.
  • 57.
  • 58.
  • 59.
    59 VERTICAL POD AUTOSCALER(VPA) "Some 2/3 of the (Google) Borg users use autopilot." - Tim Hockin VPA: Set resource requests automatically based on usage.
  • 60.
    60 VPA FOR PROMETHEUS apiVersion:poc.autoscaling.k8s.io/v1alpha1 kind: VerticalPodAutoscaler metadata: name: prometheus-vpa namespace: kube-system spec: selector: matchLabels: application: prometheus updatePolicy: updateMode: Auto CPU/memory
  • 61.
  • 62.
    62 HORIZONTAL POD AUTOSCALER apiVersion:autoscaling/v2beta1 kind: HorizontalPodAutoscaler metadata: name: myapp spec: scaleTargetRef: apiVersion: apps/v1 kind: Deployment name: myapp minReplicas: 3 maxReplicas: 5 metrics: - type: Resource resource: name: cpu targetAverageUtilization: 100 target: ~100% of CPU requests ...
  • 63.
    63 HORIZONTAL POD AUTOSCALING(CUSTOM METRICS) Queue Length Prometheus Query Ingress Req/s ZMON Check github.com/zalando-incubator/kube-metrics-adapter
  • 64.
  • 65.
    65 DOWNSCALING DURING OFF-HOURS DEFAULT_UPTIME="Mon-Fri07:30-20:30 CET" annotations: downscaler/exclude: "true" github.com/hjacobs/kube-downscaler
  • 66.
    66 ACCUMULATED WASTE ● Prototypes ●Personal test environments ● Trial runs ● Decommissioned services ● Learning/training deployments Sounds familiar?
  • 67.
    Example: Getting started withZalenium & UI Tests Example: Step by step guide to the first UI test with Zalenium running in the Continuous Delivery Platform. I was always afraid of UI tests because it looked too difficult to get started, Zalenium solved this problem for me.
  • 68.
    68 HOUSEKEEPING ● Delete prototypes afterX days ● Clean up temporary deployments ● Remove resources without owner
  • 69.
    69 KUBERNETES JANITOR ● TTLand expiry date annotations, e.g. ○ set time-to-live for your test deployment ● Custom rules, e.g. ○ delete everything without "app" label after 7 days github.com/hjacobs/kube-janitor
  • 70.
    70 JANITOR TTL ANNOTATION #let's try out nginx, but only for 1 hour kubectl run nginx --image=nginx kubectl annotate deploy nginx janitor/ttl=1h github.com/hjacobs/kube-janitor
  • 71.
    71 CUSTOM JANITOR RULES #require "app" label for new pods starting April 2019 - id: require-app-label-april-2019 resources: - deployments - statefulsets jmespath: "!(spec.template.metadata.labels.app) && metadata.creationTimestamp > '2019-04-01'" ttl: 7d github.com/hjacobs/kube-janitor
  • 72.
  • 73.
    73 SPOT ASG /LAUNCH TEMPLATE Not upstream in cluster-autoscaler (yet)
  • 74.
    74 CLUSTER OVERHEAD: CONTROLPLANE ● GKE cluster: free ● EKS cluster: $146/month ● Zalando prod cluster: $635/month (etcd nodes + master nodes + ELB) Potential: fewer etcd nodes, no HA, shared control plane.
  • 75.
    75 WHAT WORKED FORUS ● Disable CPU CFS Quota in all clusters ● Prevent memory overcommit ● Kubernetes Resource Report ● Downscaling during off-hours ● EC2 Spot
  • 76.
  • 77.
    77 OPEN SOURCE Kubernetes onAWS github.com/zalando-incubator/kubernetes-on-aws AWS ALB Ingress controller github.com/zalando-incubator/kube-ingress-aws-controller External DNS github.com/kubernetes-incubator/external-dns Postgres Operator github.com/zalando/postgres-operator Kubernetes Resource Report github.com/hjacobs/kube-resource-report Kubernetes Downscaler github.com/hjacobs/kube-downscaler Kubernetes Janitor github.com/hjacobs/kube-janitor
  • 78.
    78 OTHER TALKS/POSTS • EverythingYou Ever Wanted to Know About Resource Scheduling • Inside Kubernetes Resource Management (QoS) - KubeCon 2018 • Setting Resource Requests and Limits in Kubernetes (Best Practices) • Effectively Managing Kubernetes Resources with Cost Monitoring
  • 79.
    QUESTIONS? HENNING JACOBS HEAD OF DEVELOPERPRODUCTIVITY henning@zalando.de @try_except_ Illustrations by @01k