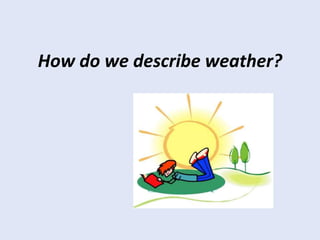
How do we describe weather
•Download as PPTX, PDF•
0 likes•840 views
Temperature is a key way to describe weather, as it indicates how hot or cold it is. The thermometer is used to measure temperature. Temperature is an important factor in describing weather conditions.
Report
Share
Report
Share

Recommended
Notes yb 01 temperature scales
This document describes three common temperature scales: Fahrenheit, Celsius, and Kelvin. It explains that the Fahrenheit scale is based on human body temperature and the freezing/boiling points of water. The Celsius scale focuses on the freezing point of water being 0 degrees and the boiling point being 100 degrees. The Kelvin scale measures temperature from absolute zero, which is -273 degrees Celsius when all molecular motion stops. The document provides conversions between the different scales and instructs students to complete a lab investigating temperature measurements.
Temperature | Convertion of Celsius to Fahrenheit and vice versa
ACCEPTING COMMISSIONED POWERPOINT SLIDES
ACCEPTING COMMISSIONED POWERPOINT SLIDES
ACCEPTING COMMISSIONED POWERPOINT SLIDES
EMAIL queenyedda@gmail.com
This preview may not appear the same on the actual version of the PPT slides.
Some formats may change due to font and size settings available on the audience's device.
To get/buy a soft copy, please send a request to queenyedda@gmail.com
Inclusions of the file attachment:
* Fonts used
* Soft copy of the WHOLE ppt slides with effects
- - - - - - - - - - - - -
How to convert temperatures in Celsius, Fahrenheit, and Kelvin.
Lesson 2.9 measuring temperature
1. The document discusses different temperature scales and how to convert between Celsius and Fahrenheit units. It introduces the Celsius scale developed by Anders Celsius in 1742 and the Fahrenheit scale developed earlier by Gabriel Fahrenheit.
2. Formulas are provided to convert between Celsius and Fahrenheit: Celsius = 5/9 (Fahrenheit - 32) and Fahrenheit = 9/5 Celsius + 32.
3. Examples are given applying the formulas to convert specific temperatures like 80°C to F° and 98.6°F to C°.
CONVERSION OF TEMPERATURE
This document discusses temperature scales and converting between Celsius, Fahrenheit, and Kelvin scales. It provides information on key reference points for freezing and boiling water in each scale and the formulas for converting between them. Examples are given for using the formulas to solve temperature conversion problems.
Weather1
Weather can be measured by temperature, which indicates how hot or cold it is, and this is typically done using a thermometer to take temperature readings. Temperature is an important factor to consider when deciding what clothes to wear for the day, as heavier or lighter outfits may be needed depending on whether the expected weather will be warmer or cooler.
What tools do we use to measure the
There are three main tools used to measure the weather: the thermometer, which measures temperature and how hot or cold it is; the wind vane, which shows the direction of the wind; and the rain gauge, which measures the amount of rain falling from the sky. Each tool has a specific purpose in measuring aspects of the weather.
Weather and temperature
The document discusses different types of weather and temperature scales. It describes common weather conditions like sunny, windy, rainy. It then explains the three main temperature scales - Celsius, Fahrenheit and Kelvin - including who invented them and how they work. Formulas are provided for converting between the different scales. Finally, there is a brief overview of different world climates.
Temperature
1) The document defines temperature and different ways of measuring it, including various temperature scales like Celsius, Fahrenheit, and Kelvin.
2) Methods of temperature measurement are discussed, including thermometers, thermocouples, and pyrometers. Conversion formulas between temperature scales are also provided.
3) Several problems are presented involving converting temperatures between Celsius, Fahrenheit, and Kelvin scales and calculating temperature changes. Absolute zero is defined as the lowest possible temperature where entropy reaches its minimum value.
CONVERSION OF TEMPERATURE
This document discusses different temperature scales and converting between them. It covers:
- The Fahrenheit, Celsius, and Kelvin scales and their reference points for water freezing and boiling.
- Formulas for converting between Fahrenheit, Celsius and Kelvin scales.
- Examples of converting specific temperatures between the different scales.
Instruments for measuring temperature and Relative humidity
This document summarizes instruments for measuring temperature and humidity. It describes how temperature is measured using thermometers calibrated to the Celsius, Fahrenheit, and Kelvin scales. Relative humidity is defined as the percentage of water vapor present compared to the maximum possible at a given temperature. Common instruments are described, including the instantaneous thermometer for single temperature readings, totalizer thermometer for minimum and maximum over time, and psychrometer using dry and wet bulb thermometers to calculate relative humidity by comparing the temperature drop from evaporation. The psychrometer consists of the two thermometers, a reservoir, and stocking to wet the wet bulb.
weather instruments and maps, no video ppt
PPT over weather instruments (barometer, anemometer, sling psycrometer, thermometer, and weather maps) and the data they collect.
Temperature
Temperature is a physical quantity that expresses the degree of hotness or coldness of a substance. It is measured using a thermometer and represents the average kinetic energy of particles in a system. The three main scales used are Celsius, Fahrenheit, and Kelvin, with Celsius being used for most common temperature measurements like weather reports. The freezing and boiling points of water are used as standard reference temperatures to calibrate thermometers across the different scales.
Scales and methords of temperature
There are three main temperature scales: Celsius, Fahrenheit, and Kelvin. The Kelvin scale is the base unit in the International System of Units and defines absolute zero as 0 K. The Celsius scale uses 0°C for the freezing point of water and 100°C for the boiling point. The Fahrenheit scale uses 32°F and 212°F as these points. Common methods of temperature measurement include bimetallic strip thermometers, which use the differing expansion rates of two bonded metals, and liquid-in-glass thermometers, where the expansion of liquid in a glass tube indicates the temperature.
Power Notes -Measurements and Dealing with Data. Day 2
This document provides instructions and information for a chemistry class. Students are asked to bring specific materials to class including pencil/pen, colored pencils/markers, and completed power note papers. An assignment log is included listing upcoming assignments and due dates. The class will then focus on completing a set of power notes on measurements and dealing with data. These notes cover topics like units, the international system of units, prefixes, zero kelvin, accuracy vs precision, variables in experiments, and analyzing data through graphs. Students are instructed to paraphrase, abbreviate and highlight the notes. Homework includes completing any past due assignments and the power notes.
Htc thermo hygro meter 103-cth & 411-cth
The document describes two thermo-hygrometers, models 103-CTH and 411-CTH. Both devices measure temperature from -50 to 70 degrees Celsius, humidity from 10 to 99% RH, and keep maximum and minimum readings and time with an alarm clock. The 103-CTH has a larger display and measures temperature in Fahrenheit and Celsius, while the 411-CTH also displays comfort levels and measures humidity up to 90%. Both devices require AAA batteries and are distributed by Monarch Controls in Bangalore, India.
Temperature
The document discusses temperature measurement and different temperature scales. It defines temperature and describes how thermometers are used to measure temperature. It explains the Celsius, Fahrenheit and Kelvin temperature scales, including their lower and upper fixed points which define freezing and boiling temperatures. Formulas are provided for converting between the different scales.
Weather instruments and maps
The document describes several common weather instruments: thermometers measure air temperature, sling psychrometers measure humidity, anemometers measure wind speed, barometers measure air pressure, and weather charts synthesize multiple data points. Thermometers contain a liquid that expands with heat, allowing users to read the temperature. Psychrometers measure humidity by comparing the temperature of a wet bulb to a dry bulb. Anemometers have spinning cups or vanes moved by wind. Barometers measure air pressure in millibars using a column of liquid. Weather charts depict fronts, pressure systems, and symbols to convey current and predicted conditions.
Measuring temperature
The document discusses different temperature scales and how thermometers work. It explains that the Fahrenheit scale was invented first and sets water's freezing point at 32 degrees and boiling point at 212 degrees. Later, Celsius was invented and set water's freezing point at 0 degrees and boiling point at 100 degrees. Thermometers work by measuring how the volume of a liquid changes with temperature in a bulb and narrow tube.
Ella's Temperature Project
Ella completed a temperature project comparing Wellington, New Zealand and Helsinki, Finland. She recorded the daily temperatures over five days for each city and calculated the mean temperature by adding up the values and dividing by five. The mean temperature was 59 degrees for Wellington and 26 degrees for Helsinki. Ella listed what clothing items she would pack for each city based on the differences in climate.
Ecological basis of IPM - degree day
The document describes the degree-day model, which uses temperature thresholds to estimate insect development rates. It accumulates "degree days" based on daily temperatures between lower and upper thresholds. Each life stage requires a certain number of degree days. By tracking accumulation from a biofix date, the model can predict when a life stage will be reached. It discusses different calculation methods that estimate degree days from minimum and maximum temperatures to approximate real temperatures. The model is useful for predicting sampling times but does not replace scouting.
Weather instruments
Weather instruments are used to collect climatic data and prepare maps and charts. Common elements measured include temperature, humidity, atmospheric pressure, rainfall, and wind speed. Temperature is measured using a thermometer, maximum/minimum thermometer, and Stevenson screen. Humidity is measured with a wet and dry bulb thermometer or hygrometer. Atmospheric pressure is measured with a simple barometer in units of millibars. Rainfall is measured using a rain gauge in centimeters or millimeters. Wind speed is measured with an anemometer in knots, and wind direction is determined using a wind vane.
Power Notes Mmeasurements and Dealing with Data + Quickwrite. day 2
This document provides instructions and assignments for a chemistry class. It includes a checklist of assignments with due dates, instructions for an in-class quick write assessment, notes on extra credit opportunities, corrections to a crossword puzzle, and directions for completing power notes on measurements and dealing with data. Students are asked to have materials ready, log into an online system, and work on completing their power notes during class. Homework includes finishing any past due assignments and completing the power notes by the following Tuesday.
Ch.13.measurements
Three key measurements are length, mass, and time. Measurements are made using standardized units, with scientists worldwide using the International System of Units (SI units). The standard SI units are the meter for length, kilogram for mass, and second for time. Various instruments are used to accurately measure these quantities, including rulers, balances, and stopwatches. Temperature is also an important measurement, with the most common scale being Celsius and key reference points of 0°C and 100°C. Liquids like mercury and alcohol are commonly used in thermometers due to their freezing and boiling points.
10.2 - First law of Thermodynamics and PV graphs
Pressure and temperature are directly proportional to one another as long as temperature is measured in Kelvins, according to Boyle's law. The first law of thermodynamics states that the heat added to a gas must equal the work done by the gas plus any change in internal energy. There are four main thermodynamic processes: (1) isobaric, where pressure is constant and temperature increases as volume expands; (2) isochoric, where volume is constant and temperature increases with rising pressure; (3) isothermal, where temperature is constant and heat enables gas to do work through expansion; and (4) adiabatic, where no heat is exchanged and work is done on the gas, increasing its
Sci5 lesson thermometers
1. The document discusses a lesson on measuring temperature that aims to explain temperature, different units of measurement, and types of thermometers.
2. It describes several types of thermometers including clinical, laboratory, digital, minimum/maximum, alcohol, and mercury thermometers.
3. The lesson objectives are for students to understand temperature, measurement units, thermometer features and functions, and how different thermometers are used.
per 3 group 66
An isotherm is a line on a weather map connecting points of equal temperature, showing temperature patterns. An isobar is an imaginary line connecting places of equal barometric pressure, which can indicate wind speed and pressure in an area. Isotherms and isobars are lines used on weather maps and charts to depict temperature and pressure conditions.
Oil Bath Exp
here u can got the ppt of of determination of energy band gap of Si diode dipped in oil bath with the help of temperature controlled oven by usin the forward bias characteristics
The weather[1]
The document discusses different types of weather including sunny, rainy, windy, snowy and cloudy. It also contains a short dialogue between Cathy and Mrs. Gibson about the rainy weather on San Andres Island in May rather than the expected sunny weather in December. The document prompts the reader to write about the weather in March and August in their city.
Animals From Zoo
This short document describes three animals from a zoo - a colorful bird, a water animal, and a very tall animal.
Can D8breaking the rules
This document discusses rules and obligations in various contexts such as school, home, and extracurricular activities. It contains exercises that require matching vocabulary words with their definitions, completing sentences about rules using grammar structures like "have to" and "can't", and writing short paragraphs about different rules. Sample rules mentioned include requirements to wear uniforms, do homework, and be on time to school. The purpose seems to be to practice and demonstrate understanding of vocabulary, grammar structures, and concepts related to rules and obligations.
More Related Content
What's hot
CONVERSION OF TEMPERATURE
This document discusses different temperature scales and converting between them. It covers:
- The Fahrenheit, Celsius, and Kelvin scales and their reference points for water freezing and boiling.
- Formulas for converting between Fahrenheit, Celsius and Kelvin scales.
- Examples of converting specific temperatures between the different scales.
Instruments for measuring temperature and Relative humidity
This document summarizes instruments for measuring temperature and humidity. It describes how temperature is measured using thermometers calibrated to the Celsius, Fahrenheit, and Kelvin scales. Relative humidity is defined as the percentage of water vapor present compared to the maximum possible at a given temperature. Common instruments are described, including the instantaneous thermometer for single temperature readings, totalizer thermometer for minimum and maximum over time, and psychrometer using dry and wet bulb thermometers to calculate relative humidity by comparing the temperature drop from evaporation. The psychrometer consists of the two thermometers, a reservoir, and stocking to wet the wet bulb.
weather instruments and maps, no video ppt
PPT over weather instruments (barometer, anemometer, sling psycrometer, thermometer, and weather maps) and the data they collect.
Temperature
Temperature is a physical quantity that expresses the degree of hotness or coldness of a substance. It is measured using a thermometer and represents the average kinetic energy of particles in a system. The three main scales used are Celsius, Fahrenheit, and Kelvin, with Celsius being used for most common temperature measurements like weather reports. The freezing and boiling points of water are used as standard reference temperatures to calibrate thermometers across the different scales.
Scales and methords of temperature
There are three main temperature scales: Celsius, Fahrenheit, and Kelvin. The Kelvin scale is the base unit in the International System of Units and defines absolute zero as 0 K. The Celsius scale uses 0°C for the freezing point of water and 100°C for the boiling point. The Fahrenheit scale uses 32°F and 212°F as these points. Common methods of temperature measurement include bimetallic strip thermometers, which use the differing expansion rates of two bonded metals, and liquid-in-glass thermometers, where the expansion of liquid in a glass tube indicates the temperature.
Power Notes -Measurements and Dealing with Data. Day 2
This document provides instructions and information for a chemistry class. Students are asked to bring specific materials to class including pencil/pen, colored pencils/markers, and completed power note papers. An assignment log is included listing upcoming assignments and due dates. The class will then focus on completing a set of power notes on measurements and dealing with data. These notes cover topics like units, the international system of units, prefixes, zero kelvin, accuracy vs precision, variables in experiments, and analyzing data through graphs. Students are instructed to paraphrase, abbreviate and highlight the notes. Homework includes completing any past due assignments and the power notes.
Htc thermo hygro meter 103-cth & 411-cth
The document describes two thermo-hygrometers, models 103-CTH and 411-CTH. Both devices measure temperature from -50 to 70 degrees Celsius, humidity from 10 to 99% RH, and keep maximum and minimum readings and time with an alarm clock. The 103-CTH has a larger display and measures temperature in Fahrenheit and Celsius, while the 411-CTH also displays comfort levels and measures humidity up to 90%. Both devices require AAA batteries and are distributed by Monarch Controls in Bangalore, India.
Temperature
The document discusses temperature measurement and different temperature scales. It defines temperature and describes how thermometers are used to measure temperature. It explains the Celsius, Fahrenheit and Kelvin temperature scales, including their lower and upper fixed points which define freezing and boiling temperatures. Formulas are provided for converting between the different scales.
Weather instruments and maps
The document describes several common weather instruments: thermometers measure air temperature, sling psychrometers measure humidity, anemometers measure wind speed, barometers measure air pressure, and weather charts synthesize multiple data points. Thermometers contain a liquid that expands with heat, allowing users to read the temperature. Psychrometers measure humidity by comparing the temperature of a wet bulb to a dry bulb. Anemometers have spinning cups or vanes moved by wind. Barometers measure air pressure in millibars using a column of liquid. Weather charts depict fronts, pressure systems, and symbols to convey current and predicted conditions.
Measuring temperature
The document discusses different temperature scales and how thermometers work. It explains that the Fahrenheit scale was invented first and sets water's freezing point at 32 degrees and boiling point at 212 degrees. Later, Celsius was invented and set water's freezing point at 0 degrees and boiling point at 100 degrees. Thermometers work by measuring how the volume of a liquid changes with temperature in a bulb and narrow tube.
Ella's Temperature Project
Ella completed a temperature project comparing Wellington, New Zealand and Helsinki, Finland. She recorded the daily temperatures over five days for each city and calculated the mean temperature by adding up the values and dividing by five. The mean temperature was 59 degrees for Wellington and 26 degrees for Helsinki. Ella listed what clothing items she would pack for each city based on the differences in climate.
Ecological basis of IPM - degree day
The document describes the degree-day model, which uses temperature thresholds to estimate insect development rates. It accumulates "degree days" based on daily temperatures between lower and upper thresholds. Each life stage requires a certain number of degree days. By tracking accumulation from a biofix date, the model can predict when a life stage will be reached. It discusses different calculation methods that estimate degree days from minimum and maximum temperatures to approximate real temperatures. The model is useful for predicting sampling times but does not replace scouting.
Weather instruments
Weather instruments are used to collect climatic data and prepare maps and charts. Common elements measured include temperature, humidity, atmospheric pressure, rainfall, and wind speed. Temperature is measured using a thermometer, maximum/minimum thermometer, and Stevenson screen. Humidity is measured with a wet and dry bulb thermometer or hygrometer. Atmospheric pressure is measured with a simple barometer in units of millibars. Rainfall is measured using a rain gauge in centimeters or millimeters. Wind speed is measured with an anemometer in knots, and wind direction is determined using a wind vane.
Power Notes Mmeasurements and Dealing with Data + Quickwrite. day 2
This document provides instructions and assignments for a chemistry class. It includes a checklist of assignments with due dates, instructions for an in-class quick write assessment, notes on extra credit opportunities, corrections to a crossword puzzle, and directions for completing power notes on measurements and dealing with data. Students are asked to have materials ready, log into an online system, and work on completing their power notes during class. Homework includes finishing any past due assignments and completing the power notes by the following Tuesday.
Ch.13.measurements
Three key measurements are length, mass, and time. Measurements are made using standardized units, with scientists worldwide using the International System of Units (SI units). The standard SI units are the meter for length, kilogram for mass, and second for time. Various instruments are used to accurately measure these quantities, including rulers, balances, and stopwatches. Temperature is also an important measurement, with the most common scale being Celsius and key reference points of 0°C and 100°C. Liquids like mercury and alcohol are commonly used in thermometers due to their freezing and boiling points.
10.2 - First law of Thermodynamics and PV graphs
Pressure and temperature are directly proportional to one another as long as temperature is measured in Kelvins, according to Boyle's law. The first law of thermodynamics states that the heat added to a gas must equal the work done by the gas plus any change in internal energy. There are four main thermodynamic processes: (1) isobaric, where pressure is constant and temperature increases as volume expands; (2) isochoric, where volume is constant and temperature increases with rising pressure; (3) isothermal, where temperature is constant and heat enables gas to do work through expansion; and (4) adiabatic, where no heat is exchanged and work is done on the gas, increasing its
Sci5 lesson thermometers
1. The document discusses a lesson on measuring temperature that aims to explain temperature, different units of measurement, and types of thermometers.
2. It describes several types of thermometers including clinical, laboratory, digital, minimum/maximum, alcohol, and mercury thermometers.
3. The lesson objectives are for students to understand temperature, measurement units, thermometer features and functions, and how different thermometers are used.
per 3 group 66
An isotherm is a line on a weather map connecting points of equal temperature, showing temperature patterns. An isobar is an imaginary line connecting places of equal barometric pressure, which can indicate wind speed and pressure in an area. Isotherms and isobars are lines used on weather maps and charts to depict temperature and pressure conditions.
Oil Bath Exp
here u can got the ppt of of determination of energy band gap of Si diode dipped in oil bath with the help of temperature controlled oven by usin the forward bias characteristics
What's hot (19)
Instruments for measuring temperature and Relative humidity
Instruments for measuring temperature and Relative humidity
Power Notes -Measurements and Dealing with Data. Day 2
Power Notes -Measurements and Dealing with Data. Day 2
Power Notes Mmeasurements and Dealing with Data + Quickwrite. day 2
Power Notes Mmeasurements and Dealing with Data + Quickwrite. day 2
Viewers also liked
The weather[1]
The document discusses different types of weather including sunny, rainy, windy, snowy and cloudy. It also contains a short dialogue between Cathy and Mrs. Gibson about the rainy weather on San Andres Island in May rather than the expected sunny weather in December. The document prompts the reader to write about the weather in March and August in their city.
Animals From Zoo
This short document describes three animals from a zoo - a colorful bird, a water animal, and a very tall animal.
Can D8breaking the rules
This document discusses rules and obligations in various contexts such as school, home, and extracurricular activities. It contains exercises that require matching vocabulary words with their definitions, completing sentences about rules using grammar structures like "have to" and "can't", and writing short paragraphs about different rules. Sample rules mentioned include requirements to wear uniforms, do homework, and be on time to school. The purpose seems to be to practice and demonstrate understanding of vocabulary, grammar structures, and concepts related to rules and obligations.
Animals at the zoo
The document appears to list animals that can be found at a zoo using their first letter, including giraffe, lions, and foxes. It also mentions wolves. However, the formatting makes it difficult to discern all of the animals mentioned.
The present progressive tense, information questions, short answer questions
This English as a second or foreign language handout and worksheet teaches the present progressive tense, information questions and short answer questions in the present progressive, and short answer formation in the context of everyday activities.
Power point the present progressive tense
The document discusses the present progressive tense in English, which is used to describe actions that are in progress or happening now. It provides examples of verbs in the -ing form in the present progressive, discusses time expressions that can be used with the tense, provides questions and negative forms, and discusses some verbs that cannot be used in the present progressive because they describe a state of being rather than an action. It also notes some verbs that can be used either statively or actively.
Talking about past events
The document provides examples of regular and irregular past tense verbs in sentences. For regular verbs like clean, danced, listened, played, stayed, studied, talked, washed, and worked are used. Irregular past tense verbs like broke, bought, did, drank, ate, fell, went, had, listened, made, and wrote are also examples. Each sentence provides a context clue for when or what the subject did in the past tense.
Asking for and giving direction
The document provides instructions for an activity where students work in groups to cut out pictures and arrange them according to directions. Each group receives a set of cut out pictures and the teacher will provide directions telling the students where to place each picture, such as "take the second turning on the left". The goal is for the students to correctly arrange the pictures based on the directions. Ten different directions are provided as examples.
Animal Zoo
This document lists various animals from A to Z that can be found at a zoo, including alligators, bears, camels, dolphins, elephants, flamingos, giraffes, hippopotamuses, iguanas, jaguars, koalas, lions, monkeys, nightingales, ostriches, penguins, quails, rhinoceroses, seals, tigers, vultures, walruses, X-ray fish, yaks and zebras.
Must mustn't class rules
The document provides vocabulary and model sentences about classroom rules using "must" and "mustn't", including instructions to raise your hand to speak, keep the class clean, be creative, ask teachers, help each other, and bring books, but not be late. It then has a hidden picture activity for students to practice the rules by removing phrases.
SIMPLE PAST TENSE
This document provides information about regular and irregular verbs in the simple past tense. Regular verbs form the past tense by adding "-ed" to the base verb, such as pulled, listened, used, and changed. Irregular verbs have unique past tense forms that do not follow a predictable pattern, including was/were, went, did, and saw.
Ordering a meal
During this English lesson you will learn what fast food is and how to buy and order fast food at three of most common takeaways in the UK. The lesson shows several examples of how to order at a fast food restaurant.
School Rules
This document discusses school rules and their importance. It identifies common rules like not smoking, interrupting teachers, being punctual, and not fighting. The most common rule violations are not doing homework, being late, and using phones in class. Some proposed new rules would allow eating, drinking, sleeping in class and using phones, as well as eliminating homework. The document was prepared by several students.
Asking and giving directions
This document provides expressions for asking for and giving directions. To ask for directions, one can say "How can I get to...", "Where is the...", or "How far is the..." and be sure to use polite expressions like "excuse me" or "Can you tell me...". When giving directions, one can say "Go to the corner of...", "Turn left", "Turn right", "Pass the...", or "Go straight ahead on..." followed by transitions like "After that", "Then", or "When you get to..." to connect ideas clearly. An example uses these expressions to give directions from a current location to a hospital.
Restaurant English
The document outlines the typical stages of dining at a restaurant, including being seated, ordering starters and main courses, eating the meal, dessert, and paying the bill. It discusses interactions between waiters/waitresses and customers at each stage, such as being seated, taking orders, serving food and drinks, clearing dishes, handling complaints, and paying. The document also includes a menu listing sample appetizers, main dishes, sides, and desserts that may be available at a restaurant.
Personality adjectives
This document provides a list of personality adjectives that could be used to describe people, including both positive traits like charming, affectionate, ambitious, reliable, sensible, hard-working, assertive, well-balanced, curious, creative, enthusiastic, sociable, sympathetic, and organized as well as negative traits such as aggressive, moody, jealous, selfish, bossy, lazy, spoilt, untidy, impatient, bad-tempered, vain, rude, rebellious, and critical.
Endangered Animals Powerpoint[1]
This document provides information about endangered animals and ways to help protect them. It begins with definitions of extinct and endangered animals. It then lists the basic needs of animals and some reasons why animals are becoming endangered, such as hunting, pollution, and loss of habitat. The document encourages learning how to help endangered animals survive and lists specific actions people can take like picking up trash, planting trees, and joining conservation organizations. It concludes by thanking the reader.
Let's go to a Restaurant
This document contains a list of food and drink options at a restaurant, organized into categories including meats, sides, drinks, seafood, salads, fast food, healthy food, and desserts. It concludes by asking the reader what they would like to order from the options presented.
Asking and giving directions
The document contains a series of directions for navigating a map with various landmarks such as a theatre, cinema, school, park, bank, church, hotel, museum, restaurant, hospital, post office, cafes, and streets. At each step, the directions provide instructions to move between the landmarks and streets, with occasional questions about the current location. The overall document plays out like a game with the goal of navigating from one location to another by following the text-based directions.
Describing people
This document describes how to summarize people based on their physical appearance and personality characteristics. Physical appearance can be described through height, weight, age, eye color, hair, and skin. Personality characteristics include traits like lazy, talkative, cruel, easygoing, happy, sad, funny, brave, charming, bad-tempered, careless, and annoying. The document provides examples of describing specific people and prompts the reader to describe themselves.
Viewers also liked (20)
The present progressive tense, information questions, short answer questions
The present progressive tense, information questions, short answer questions
More from roshanrm
2 b project
The document discusses the benefits of exercise for mental health. Regular physical activity can help reduce anxiety and depression and improve mood and cognitive function. Exercise causes chemical changes in the brain that may help protect against developing mental illness and improve symptoms for those who already suffer from conditions like anxiety and depression.
1 b project
The document discusses the benefits of exercise for mental health. Regular physical activity can help reduce anxiety and depression and improve mood and cognitive functioning. Exercise causes chemical changes in the brain that may help boost feelings of calmness, happiness and focus.
1 a project
The document discusses the benefits of exercise for mental health. Regular physical activity can help reduce anxiety and depression and improve mood and cognitive function. Exercise causes chemical changes in the brain that may help protect against mental illness and improve symptoms.
Magnets 3
Poles are the points on Earth where the axis of rotation meets the surface. The north pole is located in the Arctic and the south pole is located in Antarctica. Magnets have poles that attract or repel other magnets and objects, and a compass needle points north because of Earth's magnetic field and poles.
Seeds 2 a
The document discusses the benefits of exercise for mental health. Regular physical activity can help reduce anxiety and depression and improve mood and cognitive function. Exercise causes chemical changes in the brain that may help protect against mental illness and improve symptoms for those who already suffer from conditions like anxiety and depression.
Plants life cycles
The flowering plant life cycle begins with a seed that germinates when it receives water and heat, sprouting into a seedling. The seedling grows into an adult plant with roots, stem, leaves, and flowers. Pollen moves between flowers via bees, water, wind, and other animals, fertilizing the flowers and causing them to develop into fruits containing new seeds, completing the cycle to begin anew.
Butterfly life cycle
The butterfly goes through distinct life cycle stages of egg, caterpillar, pupa, and adult butterfly. The egg hatches into a caterpillar that eats leaves to grow large, then forms a hard shell called a pupa where it transforms into an adult butterfly, which emerges from the pupa fully formed to complete the cycle.
Deer life cycle
White-tailed deer have a life cycle where fawns are born and drink milk from their mothers to grow. The fawns then become yearlings after one year, still resembling the mother. Finally, the yearlings mature into adult deer after further growth.
Earth changes slowly
The earth changes slowly through natural processes like moving water, wind, and ice. Moving water and wind can break down and carry away rocks and soil. Ice forms in cracks in rocks when water freezes, and the expansion of freezing water pushes rocks further apart, breaking them down over time.
More from roshanrm (20)
Recently uploaded
Shallowest Oil Discovery of Turkiye.pptx
The Petroleum System of the Çukurova Field - the Shallowest Oil Discovery of Türkiye, Adana
11.1 Role of physical biological in deterioration of grains.pdf
Storagedeteriorationisanyformoflossinquantityandqualityofbio-materials.
Themajorcausesofdeteriorationinstorage
•Physical
•Biological
•Mechanical
•Chemical
Storageonlypreservesquality.Itneverimprovesquality.
Itisadvisabletostartstoragewithqualityfoodproduct.Productwithinitialpoorqualityquicklydepreciates
Authoring a personal GPT for your research and practice: How we created the Q...
Thematic analysis in qualitative research is a time-consuming and systematic task, typically done using teams. Team members must ground their activities on common understandings of the major concepts underlying the thematic analysis, and define criteria for its development. However, conceptual misunderstandings, equivocations, and lack of adherence to criteria are challenges to the quality and speed of this process. Given the distributed and uncertain nature of this process, we wondered if the tasks in thematic analysis could be supported by readily available artificial intelligence chatbots. Our early efforts point to potential benefits: not just saving time in the coding process but better adherence to criteria and grounding, by increasing triangulation between humans and artificial intelligence. This tutorial will provide a description and demonstration of the process we followed, as two academic researchers, to develop a custom ChatGPT to assist with qualitative coding in the thematic data analysis process of immersive learning accounts in a survey of the academic literature: QUAL-E Immersive Learning Thematic Analysis Helper. In the hands-on time, participants will try out QUAL-E and develop their ideas for their own qualitative coding ChatGPT. Participants that have the paid ChatGPT Plus subscription can create a draft of their assistants. The organizers will provide course materials and slide deck that participants will be able to utilize to continue development of their custom GPT. The paid subscription to ChatGPT Plus is not required to participate in this workshop, just for trying out personal GPTs during it.
THEMATIC APPERCEPTION TEST(TAT) cognitive abilities, creativity, and critic...
THEMATIC APPERCEPTION TEST(TAT) cognitive abilities, creativity, and critic...Abdul Wali Khan University Mardan,kP,Pakistan
hematic appreciation test is a psychological assessment tool used to measure an individual's appreciation and understanding of specific themes or topics. This test helps to evaluate an individual's ability to connect different ideas and concepts within a given theme, as well as their overall comprehension and interpretation skills. The results of the test can provide valuable insights into an individual's cognitive abilities, creativity, and critical thinking skillsThe cost of acquiring information by natural selection
This is a short talk that I gave at the Banff International Research Station workshop on Modeling and Theory in Population Biology. The idea is to try to understand how the burden of natural selection relates to the amount of information that selection puts into the genome.
It's based on the first part of this research paper:
The cost of information acquisition by natural selection
Ryan Seamus McGee, Olivia Kosterlitz, Artem Kaznatcheev, Benjamin Kerr, Carl T. Bergstrom
bioRxiv 2022.07.02.498577; doi: https://doi.org/10.1101/2022.07.02.498577
Immersive Learning That Works: Research Grounding and Paths Forward
We will metaverse into the essence of immersive learning, into its three dimensions and conceptual models. This approach encompasses elements from teaching methodologies to social involvement, through organizational concerns and technologies. Challenging the perception of learning as knowledge transfer, we introduce a 'Uses, Practices & Strategies' model operationalized by the 'Immersive Learning Brain' and ‘Immersion Cube’ frameworks. This approach offers a comprehensive guide through the intricacies of immersive educational experiences and spotlighting research frontiers, along the immersion dimensions of system, narrative, and agency. Our discourse extends to stakeholders beyond the academic sphere, addressing the interests of technologists, instructional designers, and policymakers. We span various contexts, from formal education to organizational transformation to the new horizon of an AI-pervasive society. This keynote aims to unite the iLRN community in a collaborative journey towards a future where immersive learning research and practice coalesce, paving the way for innovative educational research and practice landscapes.
(June 12, 2024) Webinar: Development of PET theranostics targeting the molecu...
(June 12, 2024) Webinar: Development of PET theranostics targeting the molecu...Scintica Instrumentation
Targeting Hsp90 and its pathogen Orthologs with Tethered Inhibitors as a Diagnostic and Therapeutic Strategy for cancer and infectious diseases with Dr. Timothy Haystead.Direct Seeded Rice - Climate Smart Agriculture
Direct Seeded Rice - Climate Smart AgricultureInternational Food Policy Research Institute- South Asia Office
PPT on Direct Seeded Rice presented at the three-day 'Training and Validation Workshop on Modules of Climate Smart Agriculture (CSA) Technologies in South Asia' workshop on April 22, 2024.
Equivariant neural networks and representation theory
Or: Beyond linear.
Abstract: Equivariant neural networks are neural networks that incorporate symmetries. The nonlinear activation functions in these networks result in interesting nonlinear equivariant maps between simple representations, and motivate the key player of this talk: piecewise linear representation theory.
Disclaimer: No one is perfect, so please mind that there might be mistakes and typos.
dtubbenhauer@gmail.com
Corrected slides: dtubbenhauer.com/talks.html
The debris of the ‘last major merger’ is dynamically young
The Milky Way’s (MW) inner stellar halo contains an [Fe/H]-rich component with highly eccentric orbits, often referred to as the
‘last major merger.’ Hypotheses for the origin of this component include Gaia-Sausage/Enceladus (GSE), where the progenitor
collided with the MW proto-disc 8–11 Gyr ago, and the Virgo Radial Merger (VRM), where the progenitor collided with the
MW disc within the last 3 Gyr. These two scenarios make different predictions about observable structure in local phase space,
because the morphology of debris depends on how long it has had to phase mix. The recently identified phase-space folds in Gaia
DR3 have positive caustic velocities, making them fundamentally different than the phase-mixed chevrons found in simulations
at late times. Roughly 20 per cent of the stars in the prograde local stellar halo are associated with the observed caustics. Based
on a simple phase-mixing model, the observed number of caustics are consistent with a merger that occurred 1–2 Gyr ago.
We also compare the observed phase-space distribution to FIRE-2 Latte simulations of GSE-like mergers, using a quantitative
measurement of phase mixing (2D causticality). The observed local phase-space distribution best matches the simulated data
1–2 Gyr after collision, and certainly not later than 3 Gyr. This is further evidence that the progenitor of the ‘last major merger’
did not collide with the MW proto-disc at early times, as is thought for the GSE, but instead collided with the MW disc within
the last few Gyr, consistent with the body of work surrounding the VRM.
Bob Reedy - Nitrate in Texas Groundwater.pdf
Presented at June 6-7 Texas Alliance of Groundwater Districts Business Meeting
ESR spectroscopy in liquid food and beverages.pptx
With increasing population, people need to rely on packaged food stuffs. Packaging of food materials requires the preservation of food. There are various methods for the treatment of food to preserve them and irradiation treatment of food is one of them. It is the most common and the most harmless method for the food preservation as it does not alter the necessary micronutrients of food materials. Although irradiated food doesn’t cause any harm to the human health but still the quality assessment of food is required to provide consumers with necessary information about the food. ESR spectroscopy is the most sophisticated way to investigate the quality of the food and the free radicals induced during the processing of the food. ESR spin trapping technique is useful for the detection of highly unstable radicals in the food. The antioxidant capability of liquid food and beverages in mainly performed by spin trapping technique.
Applied Science: Thermodynamics, Laws & Methodology.pdf
When I was asked to give a companion lecture in support of ‘The Philosophy of Science’ (https://shorturl.at/4pUXz) I decided not to walk through the detail of the many methodologies in order of use. Instead, I chose to employ a long standing, and ongoing, scientific development as an exemplar. And so, I chose the ever evolving story of Thermodynamics as a scientific investigation at its best.
Conducted over a period of >200 years, Thermodynamics R&D, and application, benefitted from the highest levels of professionalism, collaboration, and technical thoroughness. New layers of application, methodology, and practice were made possible by the progressive advance of technology. In turn, this has seen measurement and modelling accuracy continually improved at a micro and macro level.
Perhaps most importantly, Thermodynamics rapidly became a primary tool in the advance of applied science/engineering/technology, spanning micro-tech, to aerospace and cosmology. I can think of no better a story to illustrate the breadth of scientific methodologies and applications at their best.
The binding of cosmological structures by massless topological defects
Assuming spherical symmetry and weak field, it is shown that if one solves the Poisson equation or the Einstein field
equations sourced by a topological defect, i.e. a singularity of a very specific form, the result is a localized gravitational
field capable of driving flat rotation (i.e. Keplerian circular orbits at a constant speed for all radii) of test masses on a thin
spherical shell without any underlying mass. Moreover, a large-scale structure which exploits this solution by assembling
concentrically a number of such topological defects can establish a flat stellar or galactic rotation curve, and can also deflect
light in the same manner as an equipotential (isothermal) sphere. Thus, the need for dark matter or modified gravity theory is
mitigated, at least in part.
Describing and Interpreting an Immersive Learning Case with the Immersion Cub...
Current descriptions of immersive learning cases are often difficult or impossible to compare. This is due to a myriad of different options on what details to include, which aspects are relevant, and on the descriptive approaches employed. Also, these aspects often combine very specific details with more general guidelines or indicate intents and rationales without clarifying their implementation. In this paper we provide a method to describe immersive learning cases that is structured to enable comparisons, yet flexible enough to allow researchers and practitioners to decide which aspects to include. This method leverages a taxonomy that classifies educational aspects at three levels (uses, practices, and strategies) and then utilizes two frameworks, the Immersive Learning Brain and the Immersion Cube, to enable a structured description and interpretation of immersive learning cases. The method is then demonstrated on a published immersive learning case on training for wind turbine maintenance using virtual reality. Applying the method results in a structured artifact, the Immersive Learning Case Sheet, that tags the case with its proximal uses, practices, and strategies, and refines the free text case description to ensure that matching details are included. This contribution is thus a case description method in support of future comparative research of immersive learning cases. We then discuss how the resulting description and interpretation can be leveraged to change immersion learning cases, by enriching them (considering low-effort changes or additions) or innovating (exploring more challenging avenues of transformation). The method holds significant promise to support better-grounded research in immersive learning.
Recently uploaded (20)
11.1 Role of physical biological in deterioration of grains.pdf
11.1 Role of physical biological in deterioration of grains.pdf
aziz sancar nobel prize winner: from mardin to nobel
aziz sancar nobel prize winner: from mardin to nobel
GBSN - Biochemistry (Unit 6) Chemistry of Proteins
GBSN - Biochemistry (Unit 6) Chemistry of Proteins
Authoring a personal GPT for your research and practice: How we created the Q...
Authoring a personal GPT for your research and practice: How we created the Q...
THEMATIC APPERCEPTION TEST(TAT) cognitive abilities, creativity, and critic...
THEMATIC APPERCEPTION TEST(TAT) cognitive abilities, creativity, and critic...
The cost of acquiring information by natural selection
The cost of acquiring information by natural selection
Immersive Learning That Works: Research Grounding and Paths Forward
Immersive Learning That Works: Research Grounding and Paths Forward
(June 12, 2024) Webinar: Development of PET theranostics targeting the molecu...
(June 12, 2024) Webinar: Development of PET theranostics targeting the molecu...
Equivariant neural networks and representation theory
Equivariant neural networks and representation theory
The debris of the ‘last major merger’ is dynamically young
The debris of the ‘last major merger’ is dynamically young
ESR spectroscopy in liquid food and beverages.pptx
ESR spectroscopy in liquid food and beverages.pptx
Applied Science: Thermodynamics, Laws & Methodology.pdf
Applied Science: Thermodynamics, Laws & Methodology.pdf
The binding of cosmological structures by massless topological defects
The binding of cosmological structures by massless topological defects
Describing and Interpreting an Immersive Learning Case with the Immersion Cub...
Describing and Interpreting an Immersive Learning Case with the Immersion Cub...
How do we describe weather
- 1. How do we describe weather?
- 2. Temperature • How hot or cold the weather is.
- 3. • We can measure the temperature using the thermometer Temperature