Hourly Precipitation Prediction
•Download as PPTX, PDF•
0 likes•299 views

This document summarizes the development of a model to predict hourly precipitation. It discusses variable selection using correlation analysis, time-lagged correlations between stations, and simulation results to determine the best combination of variables. The model was trained on data from 2011-2013 and tested on random sample data from the same period. Output is a probability prediction for precipitation in each of the next 4 hours. Example output graphs show the model accurately capturing periods of low and average rainfall.

Recommended
Recommended
More Related Content
Viewers also liked
Viewers also liked (20)
Similar to Hourly Precipitation Prediction
Similar to Hourly Precipitation Prediction (20)
Hourly Precipitation Prediction
- 2. Agenda • Model • Variable Selection • Correlation • Time Lagged Correlations • Simulation Result • Variable selection Vs Mean Error • Input -Neighbor Stations Selections • Stations which can be used as good predictors • Cross Correlation Between Stations for Hourly Precipitation • Correlation Plots • Results • Error Plot • Hourly System output
- 3. Model Data Collection Train Network Predict Data Web Interface Train Network Normalize Data. . Neural Network Training Section Cubic Spline Interpolation Multiple Sections Online Prediction and Web Section Trained Neural Network Aggregate Data
- 4. Variable Selection-Correlation • Output • 4 hours of Probability data for Hourly Precipitation http://10.39.8.247/predict/correlation.php#div-1 All Variables Temperature Humidity Dew point Pressure Wind Speed Wind Speed Gust Wind Direction Wind Direction Degree Daily Rain Hourly Precipitation Selected Variables Hourly Precipitation Humidity Wind Direction Daily Rain Solar Radiation Temperature
- 5. Cross Correlation Between Variables HP Vs Humidity HP Vs Pressure HP Vs Solar Radiation HP Vs Temperature HP Vs Wind Direction Degree HP Vs Wind Speed *HP- Hourly Precipitation
- 6. Variable Selection-Cross Correlation HP Vs Humidity HP Vs Pressure HP Vs Solar Radiation HP Vs Temperature HP Vs Wind Direction Degree HP Vs Wind Speed Selected Variables Hourly Precipitation Humidity Wind Direction Daily Rain Solar Radiation Temperature All Variables Temperature Humidity Dew point Pressure Wind Speed Wind Speed Gust Wind Direction Wind Direction Degree Daily Rain Hourly Precipitation Selected Variables Hourly Precipitation Humidity Daily Rain Wind Direction Correlation Cross Correlation
- 7. Simulation –Variable Combination 0 0.01 0.02 0.03 0.04 0.05 0.06 0.07 HP-WD-DR-T HP-P-WD-H-T HP-P-WD-T HP-WD-H-T HP-SR-P-WS HP-P-WD-DR-T HP-SR-P-WD-WS HP-P-WS-DR HP-T HP-H-T HP-SR-WS-H-DR T-HP-SR-P-WD-WS-DR HP-SR-WS-H-T HP-SR-P-WS-H HP-WS-DR-T HP-WD-DR HP-SR-T T-HP-SR-P-WD-H-DR HP-P-WD HP-SR-WD-WS-DR-T HP-SR-P-WD-WS-T HP-SR-P-WD-H-T HP-WS-H-DR-T HP-SR-H-DR-T HP-SR-P-H-T HP-P-WD-H HP-P-WS HP-SR-P-H HP-P-T HP-SR-P HP-P-WD-WS-H-T HP-SR-WD-H-DR-T MeanAbsoluteError Mean Absolute Error 0 0.002 0.004 0.006 0.008 0.01 0.012 0.014 0 1 2 3 4 5 6 7 8 MeanAbsoluteError Number of Variables used Mean Absolute Error • List of Selected Variables Combinations • HP-WD-H-DR • HP-WD-DR-T • HP-WD-H-DR-T • HP-P-WD-WS-DR • HP-P-WD-H-T • Legend • T- Temperature • HP- Hourly Precipitation • WD- Wind Direction • WS- Wind Speed • P- Pressure • H- Humidity • DR- Daily Rain • SR- Solar Radiation • HP-SR-WD-DR • HP-P-WD-DR • HP-P-WD-WS-H • HP-P-WD-T • HP-WD-WS-H-T
- 8. Variable Selection-Simulation 0 0.01 0.02 0.03 0.04 0.05 0.06 0.07 HP-WD-DR-T HP-P-WD-WS-DR HP-P-WD-DR HP-WD-WS-H-T HP-WD-H-T HP-WD-WS-DR-T HP-P-WD-H-DR HP-SR-H-DR HP-SR-P-WD-WS HP-SR-DR-T HP-SR HP-SR-WS-DR HP-H-T HP-SR-WS-DR-T HP-SR-WD-WS HP-H HP-SR-WS-H-T HP-SR-WD-H-DR T-HP-SR-P-WS-… HP-SR-P-WD-H HP-WD-DR HP-SR-P-WD-… HP-SR-WS-H-DR-T HP-P-WS-H-T HP-P-WD HP-SR-H HP-SR-P-WD-DR-T HP-SR-WD-WS-… HP-SR-P-WD-H-T HP-WD-WS HP-P-H-DR HP-SR-P-H-DR HP-SR-P-H-T HP-WD-WS-H-DR HP-WD-WS-H HP-SR-WS-H HP-SR-P-H HP-H-DR HP-P-H-DR-T HP-WD HP-P-WD-WS-H-T HP-SR-P-WS-DR-T MeanAbsoluteError Mean Absolute Error 0 0.002 0.004 0.006 0.008 0.01 0.012 0.014 0 1 2 3 4 5 6 7 8 MeanAbsoluteError Number of Variables used Mean Absolute ErrorSelected Variables Hourly Precipitation Humidity Wind Direction Daily Rain Solar Radiation Temperature All Variables Temperature Humidity Dew point Pressure Wind Speed Wind Speed Gust Wind Direction Wind Direction Degree Daily Rain Hourly Precipitation Selected Variables Hourly Precipitation Humidity Daily Rain Wind Direction Selected Variables Hourly Precipitation Humidity Daily Rain Wind Direction Correlation Cross Correlation Simulation
- 9. Number of Hours of input data 0 0.02 0.04 0.06 0.08 0.1 0.12 0.14 0.16 0 5 10 15 20 25 30 MAE Number of hours Number of Input hours of data required 1 1.1 1.2 1.3 1.4 1.5 1.6 1.7 1.8 1.9 0 5 10 15 20 25 30 35 MAE Number of Neurons Number of Neurons • Number of Hours input data- 24 • Number of hidden Neurons=7
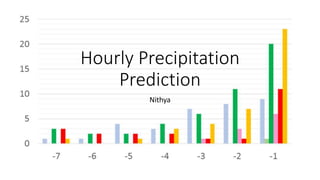
- 10. Stations which can be used as good predictors 0 5 10 15 20 25 -18 -17 -16 -14 -13 -12 -11 -10 -9 -8 -7 -6 -5 -4 -3 -2 -1 COUNT NUMBER HOURS AHEAD Number of Times Rainfall occured at stations before IBSURRE21 Burna10 CWWK Ibccoqui5 Ibcpittm3 Surre10 Surre6
- 11. Possible Predictor Burna 10, Coqui5, Surre6 0 5 10 15 20 25 -7 -6 -5 -4 -3 -2 -1 Burna10 CWWK Ibccoqui5 Ibcpittm3 Surre10 Surre6
- 12. Cross Correlation Between Stations for Hourly Precipitation SURRE21-COQUI5 SURRE21-SURRE6 SURRE21-PITTM3 SURRE21-BURNA 10 SURRE21-SURRE10
- 13. Cross Correlation Between Stations for Hourly Precipitation- Daily Rain SURRE21-Surre10 SURRE21-Surre6 SURRE21-COQUI5 SURRE21-BURNA10
- 14. Cross Correlation Between Stations for Hourly Precipitation- Humidity SURRE21-BURNA10 SURRE21-CWMM SURRE21-CWWK SURRE21-COQUI5 SURRE21-SURRE6 SURRE21-SURRE10
- 15. Input Selection –Station Combination 0 0.02 0.04 0.06 0.08 0.1 0.12 0.14 0 1 2 3 4 5 6 7 MAE Number of Input Variables MEAN Absolute Error Best Combination Surre21,Burna 10, Ibccoqui5 Surre21,Burna 10, PITM3 Surre21,PITM3, Surre6 0 0.05 0.1 0.15 0.2 0.25 0.3 Sur21-NA10-IBC5 Sur21-PIT3-Sur10-CWMM Sur21-NA10-IBC5-PIT3-Sur6 Sur21-NA10-PIT3-Sur10-CWMM-CWWK Sur21-NA10-IBC5-Sur10-Sur6 Sur21-NA10-IBC5-PIT3-Sur6-CWWK Sur21-NA10-PIT3-Sur6-CWMM-CWWK Sur21-NA10-IBC5-Sur6-CWWK Sur21-IBC5-Sur10-Sur6 Sur21-IBC5-Sur6 Sur21-IBC5-PIT3-Sur10-Sur6 Sur21-NA10-IBC5-PIT3-Sur6-CWMM Sur21-IBC5-Sur10-Sur6-CWWK Sur21-Sur10-CWMM-CWWK Sur21-PIT3-Sur10-CWWK Sur21-IBC5 Sur21-NA10-IBC5-PIT3-Sur10 Sur21-NA10-PIT3-CWMM Sur21-IBC5-PIT3-Sur10-CWWK Sur21-IBC5-CWMM Sur21-NA10-PIT3-Sur10-CWWK Sur21-Sur10-Sur6-CWWK Sur21-IBC5-PIT3-Sur6 Sur21-Sur6-CWMM Sur21-IBC5-Sur10-CWWK Sur21-PIT3-Sur10-Sur6-CWMM Sur21-IBC5-Sur6-CWMM Sur21-NA10-Sur10-CWWK Sur21-IBC5-Sur6-CWWK Sur21-IBC5-Sur6-CWMM-CWWK Sur21-Sur10-Sur6-CWMM Sur21-NA10-Sur10-CWMM-CWWK Sur21-NA10-IBC5-PIT3-CWMM Sur21-Sur10-CWMM Sur21-PIT3 MeanAbsoluteError Combination Plot for Stations
- 16. Input Selection –Station Combination 0 0.05 0.1 0.15 0.2 0.25 0.3 Sur21-NA10-IBC5 Sur21-PIT3-Sur6 Sur21-NA10-PIT3 Sur21-NA10-IBC5-PIT3-Sur6 Sur21-NA10-IBC5-Sur10-CWMM-CWWK Sur21-IBC5-CWMM-CWWK Sur21-NA10-IBC5-Sur10-Sur6 Sur21-NA10-IBC5-Sur6-CWMM Sur21-PIT3-Sur10-CWMM-CWWK Sur21-NA10-PIT3-Sur6-CWMM-CWWK Sur21-IBC5-PIT3 Sur21-NA10-IBC5-PIT3-CWWK Sur21-IBC5-Sur10-Sur6 Sur21-NA10-IBC5-PIT3-Sur10-CWWK Sur21-NA10-IBC5-Sur10-CWMM Sur21-IBC5-PIT3-Sur10-Sur6 Sur21-PIT3-Sur6-CWWK Sur21-IBC5-PIT3-CWWK Sur21-IBC5-Sur10-Sur6-CWWK Sur21-NA10-Sur10-Sur6-CWMM Sur21-NA10 Sur21-PIT3-Sur10-CWWK Sur21-PIT3-CWWK Sur21-NA10-Sur10-Sur6 Sur21-NA10-IBC5-PIT3-Sur10 Sur21-Sur6 Sur21-NA10-IBC5-Sur6-CWMM-CWWK Sur21-IBC5-PIT3-Sur10-CWWK Sur21-NA10-IBC5-CWMM-CWWK Sur21-IBC5-CWWK Sur21-NA10-PIT3-Sur10-CWWK Sur21-NA10-PIT3-CWMM-CWWK Sur21-IBC5-PIT3-Sur10-CWMM Sur21-IBC5-PIT3-Sur6 Sur21-Sur6-CWMM-CWWK Sur21-Sur10-Sur6-CWMM-CWWK Sur21-IBC5-Sur10-CWWK Sur21-PIT3-Sur10-Sur6 Sur21-NA10-Sur6-CWMM-CWWK Sur21-IBC5-Sur6-CWMM Sur21-NA10-CWWK Sur21-PIT3-Sur6-CWMM Sur21-IBC5-Sur6-CWWK Sur21-NA10-CWMM Sur21-IBC5-Sur10-CWMM Sur21-Sur10-Sur6-CWMM Sur21-Sur10-CWWK Sur21-NA10-PIT3-Sur10-Sur6-CWMM Sur21-NA10-IBC5-PIT3-CWMM Sur21-NA10-IBC5-Sur10-Sur6-CWWK Sur21-PIT3-Sur10-Sur6-CWWK Sur21-PIT3 MeanAbsoluteError Combination Plot for Stations
- 17. Input/output Representation • Input is 24 hour Normalized data from three stations and 3 variables from the stations. • Output is 4 variable. Each variable indicating probability of rain for every hour ahead. Date Time Hour1 Hour2 Hour3 Hour4 … 0 0 0 0 …. 0 1 0 0 … 1 0 0 0 …. 0 0 0 1 • Sample Actual OutputData Used for Training • Rainfall>1(mm) ? Output=1 : Output =0 We Have 2^4= 16 different Combinations of possible Output Distribution of Actual Output Classes 2011-2013
- 18. Error Plot Predicted Error Computed for Random Sample data 2011-2013 *This data was not used for Training Value 0 1 2 3 4 5 6 7 8 9 10 11 12 13 14 15 Output Class 0000 0001 0010 0011 0100 0101 0110 0111 1000 1001 1010 1011 1100 1101 1110 1111 Predicted actual actual counts percentage
- 19. Hourly Precipitation Results 0 0.5 1 1.5 2 2.5 3 0 10 20 30 40 50 60 70 80 90 100 12:00AM 1:00AM 2:00AM 3:00AM 4:00AM 5:00AM 6:00AM 7:00AM 8:00AM 9:00AM 10:00AM 11:00AM 12:00PM 1:00PM 2:00PM 3:00PM 4:00PM 5:00PM 6:00PM Precipitation(mm) Probability(%) Low Rain 1/7/2014 0 0.5 1 1.5 2 2.5 3 3.5 4 0 10 20 30 40 50 60 70 80 90 100 2:00AM 3:00AM 4:00AM 5:00AM 6:00AM 7:00AM 8:00AM 9:00AM 10:00AM 11:00AM 12:00PM 1:00PM 2:00PM 3:00PM 4:00PM 5:00PM 6:00PM 7:00PM 8:00PM Precipitation(mm) Probability(%) Average Rain 1/2/2014 0 1 2 3 4 5 6 7 8 0 20 40 60 80 100 Precipitation(mm) Probability(%) Heavy Rain 1/11/2014 0 0.5 1 1.5 2 2.5 3 0 10 20 30 40 50 60 70 80 90 100 6:00AM 7:00AM 8:00AM 9:00AM 10:00AM 11:00AM 12:00PM 1:00PM 2:00PM 3:00PM 4:00PM 5:00PM 6:00PM 7:00PM 8:00PM 9:00PM 10:00PM 11:00PM Precipitation(mm) Probability(%) Snow Fall 2/22/2014
- 20. Hourly Precipitation – Low rain 0 0.5 1 1.5 2 2.5 3 0 10 20 30 40 50 60 70 80 90 100 12:00 AM 1:00 AM 2:00 AM 3:00 AM 4:00 AM 5:00 AM 6:00 AM 7:00 AM 8:00 AM 9:00 AM 10:00 AM 11:00 AM 12:00 PM 1:00 PM 2:00 PM 3:00 PM 4:00 PM 5:00 PM 6:00 PM Precipitation(mm) Probability(%) Rainfall Prediction 1/7/2014 Predict 1 Predict 2 Predict 3 Predict 4 Predict 5 Predict 6 Preict 7 Predict 8 Precipitation
- 21. Hourly Precipitation – Average rain 0 0.5 1 1.5 2 2.5 3 3.5 4 0 10 20 30 40 50 60 70 80 90 100 2:00 AM 3:00 AM 4:00 AM 5:00 AM 6:00 AM 7:00 AM 8:00 AM 9:00 AM 10:00 AM 11:00 AM 12:00 PM 1:00 PM 2:00 PM 3:00 PM 4:00 PM 5:00 PM 6:00 PM 7:00 PM 8:00 PM PRECIPITATION(MM) PROBABILITY(%) Rainfall Prediction 1/2/2014 Predict 1 Predict 2 Predict 3 Predict 4 Predict 5 Predict 6 Preict 7 Predict 8 Precipitation
- 22. Hourly Precipitation – Heavy rain 0 1 2 3 4 5 6 7 8 0 20 40 60 80 100 4:00 PM 5:00 PM 6:00 PM 7:00 PM 8:00 PM 9:00 PM 10:00 PM 11:00 PM 12:00 AM 1:00 AM 2:00 AM 3:00 AM 4:00 AM 5:00 AM 6:00 AM 7:00 AM 8:00 AM 9:00 AM 8:00 PM Precipitation(mm) Probability(%) Rainfall Prediction 1/11/2014 Predict 1 Predict 2 Predict 3 Predict 4 Predict 5 Predict 6 Preict 7 Predict 8 Precipitation
- 23. Hourly Precipitation – Snow Fall 0 0.5 1 1.5 2 2.5 3 0 10 20 30 40 50 60 70 80 90 100 6:00 AM 7:00 AM 8:00 AM 9:00 AM 10:00 AM 11:00 AM 12:00 PM 1:00 PM 2:00 PM 3:00 PM 4:00 PM 5:00 PM 6:00 PM 7:00 PM 8:00 PM 9:00 PM 10:00 PM 11:00 PM PRECIPITATION(MM) PROBABILITY(%) Rainfall Prediction 2/22/2014 Predict 1 Predict 2 Predict 3 Predict 4 Predict 5 Predict 6 Preict 7 Predict 8 Precipitation
- 25. Hourly Precipitation Vs Humidity 6-23-13 5-11-13 1-3-13
- 26. Hourly Precipitation Vs Pressure 6-23-13 5-11-13 1-3-13
- 27. Hourly Precipitation Vs Solar Radiation 6-23-13 5-25-13 1-3-13
- 28. Hourly Precipitation Vs Temperature 6-23-13 5-25-13 1-3-13
- 29. Hourly Precipitation Vs Wind Direction 6-23-13 5-25-13 1-3-13 Back time lagged correlation
- 30. Hourly Precipitation Vs Wind Direction Back time lagged correlation 0 50 100 150 200 250 300 350 Degree Direction Vs Degress 2013- 6 Hours Prior to Rainfall- Wind Direction Distribution
- 31. Correlation Matrix 1. SURRE 21 2. CWWK *Everything Variable with a number suffix belongs to corresponding station listed Back To Station Correlation>>
- 32. Correlation Matrix 1. SURRE 21 2. SURRE6 *Everything Variable with a number suffix belongs to corresponding station listed Back To Station Correlation>>
- 33. Correlation Matrix 1. SURRE 21 2. CWMM *Everything Variable with a number suffix belongs to corresponding station listed Back To Station Correlation>>
- 34. Correlation Matrix 1. SURRE 21 2. SURRE10 *Everything Variable with a number suffix belongs to corresponding station listed Back To Station Correlation>>
- 35. Correlation Matrix 1. SURRE 21 2. PITM3 *Daily Rain and Wind Direction Deg are dropped, because more 80% of the data is NA Back To Station Correlation>>
- 36. Correlation Matrix 1. SURRE 21 2. IBCCOQUI5 *Daily Rain and Wind Direction Deg are dropped, because more 80% of the data is NA Back To Station Correlation>>
- 37. Correlation Matrix 1. SURRE 21 2. BURNA10 *Daily Rain and Wind Direction Deg are dropped, because more 80% of the data is NA Back To Station Correlation>>