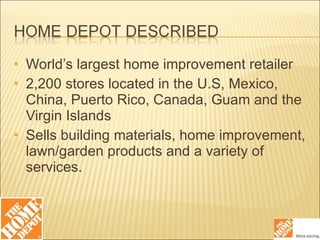
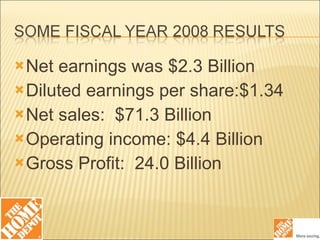
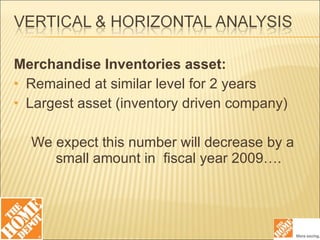
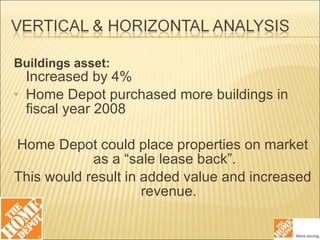
The document analyzes Home Depot's past and future performance as well as providing an investment recommendation. It summarizes that in fiscal year 2008, Home Depot had $71.3 billion in net sales and $2.3 billion in net earnings. While merchandise inventories remained at similar levels over the past two years, building assets increased by 4% as Home Depot purchased more properties. The analyst recommends holding onto the stock if already owned or buying it as a good investment opportunity, as Home Depot is financially sound and will survive the current economic downturn.
A look into Home Depot consumers, its e-commerce website and the interaction between the retail stores and consumers. We will look into homedepot.com as a brand and an avenue for more sales. This document will provide brand marketing suggestions while summarizing Home Depot’s brand and e-commerce platform.
Hubspot Case Presentation - First PlaceConnor Dismer
Each year, Tulane's Freeman School of Business has each senior enter a case competition as part of the capstone course. Our group,Team Orion, won first place in the fall of 2011 with our analysis of Hubspot.
Group members: Evan Nicoll, Jessica Lange, Connor Dismer (me), and Lloyd Walker
Charlton Bate’s great-grandfather formed the Haverwood Furniture Industry in the early 1900’s. The Company are a medium to high-priced and high-quality producer and sell over 1000 high-quality products in stores nationwide. They are very discerning in selecting merchandising outlets to reflect their products, so they are more of a niche corporation, and do not trade with the usual chain stores or markdown outlets rather they are sellers to High-quality specialty stores and
self-governing furniture department stores (Oliveira, 2009). Their quality furnitures include dressers, tables, bedroom and living room suites, with bedroom and dining room furniture being the majority of sales.
This investigation looks at the company Home Depot and provides a SWOT Analysis and PESTEL analysis of the company as it stands. Also included is an analysis of the company’s values, strategy and objectives, and ethical culture. In conclusion a recommendation is provided to further the company’s strategic objectives.
Các Dự án Kinh Doanh của Thái Robbin:
-Giáo Dục trẻ thông minh sớm Glenn Doman:http://hoithaoglenndoman.com/?i=ehKsZHgH7Me
-Thiết Kế web Kiếm tiền: http://thietkeweb.kienthuchay.net/?i=ehIJWyRThgk
-Xây dựng cộng đồng kiến thức hay:http://kienthuchay.net/tuyendung/?i=ehHaCNMeG
-Xây Dựng Chuỗi Cafe Kiến Thức hay
-Kinh doanh đồng phục cho cộng đồng Kiến Thức Hay.
Và Những dự án lớn khác,các anh chị nào muốn hợp tác và đồng hành tìm hiểu theo thông tin:
Liên Hệ HotLine: 090.678.5753 (Manager & Director Thái Robbin)
Facebook: http://www.facebook.com/ThaiRobbin
Web: http://thairobbin.blogspot.com
Home Depot Integrated Marketing Campaign Plan for IMC 610Genifer Snipes
This campaign plan was for the first class I completed in West Virginia University's Integrated Marketing Communication masters' program. In six weeks, I completed a preliminary environmental audit and marketing campaign encompassing PR, advertising, and sales promotions in addition to learning about many of these topics for the first time.
The Home Depot Visual Merchandising, Signage, POP and Fixture Design portfolioaaroninsel
A collection of projects in which I managed and led a team of graphic designers, fixture designers, merchants, store planners, suppliers and vendors to concept and execute in my role as Associate Visual Merchandiser at The Home Depot.
Value chain analysis helps only in identifying the strengths and weaknesses of each elements of firm’s value chain. SWOT can not be used to identify external opportunities and threats. It is a situation analysis of the organization. It is a groundwork for matching the strategy both to the external market and internal resources. It is away to analyze a firm’s internal and external situations.
There are 76 red xxx’s – each worth 1.18 points. You only need to.docxchristalgrieg
There are 76 red xxx’s – each worth 1.18 points. You only need to fill in where you see red xxx’s (big or small)
CHAPTER 1
THE McGEE CAKE COMPANY
1. The advantages to a LLC are: xxxx
The biggest disadvantage is: xxxx
2. .xxxx
C-2 CASE SOLUTIONS
3. .xxxx
CHAPTER 2
CASH FLOWS AND FINANCIAL STATEMENTS
Below are the financial statements that you are asked to prepare.
1. The income statement for each year will look like this:
Income Statement
2010
2011
Sales
xxxx
xxxx
Cost of goods sold
163,849
206,886
Selling and administrative
xxxx
xxxx
Depreciation
46,255
52,282
EBIT
$79,110
$90,584
Interest
10,056
11,526
EBT
$69,054
$79,058
Taxes (use the problem to figure
This amount out
xxxx
xxxx
Net income
$55,243
$63,246
Dividends(read the case to find out how much this is)
xxxx
xxxx
Addition to retained earnings
(this would be whatever the net income is less the dividends paid out)
xxxx
xxxx
2. The balance sheet for each year will be:
Balance Sheet as of Dec. 31, 2010
Cash
xxxx
Accounts payable
xxxx
Accounts receivable
xxxx
Notes payable
xxxx
Inventory
xxxx
Current liabilities
$60,832
Current assets
$72,651
Long-term debt
xxxxx
Net fixed assets
xxxxxx
Owners' equity
xxxxx
Total assets
$276,719
Total liab. and equity
$276,719
In the first year, equity is not given. Therefore, we must calculate equity as a plug variable. Since total liabilities and equity is equal to total assets, equity can be calculated as:
Equity = $276,719 – 60,832 – 103,006
Equity = $112,881
Balance Sheet as of Dec. 31, 2011
Cash
xxxx
Accounts payable
xxxx
Accounts receivable
xxxx
Notes payable
xxxx
Inventory
xxxx
Current liabilities
$68,121
Current assets
$100,834
Long-term debt
xxxx
Net fixed assets
xxxx
Owners' equity
Xxxx(see below)
Total assets
$349,459
Total liab. and equity
$349,459
The owner’s equity for 2011 is the beginning of year owner’s equity, plus the addition to retained earnings, plus the new equity, so:
Equity = $112,881 + 31,623 + 20,500
Equity = $165,004
3-6 are completed for you so you can answer the questions
3. Using the OCF equation: (
OCF = EBIT + Depreciation – Taxes
The OCF for each year is:
OCF2010 = $79,110 + 46,255 – 13,811
OCF2010 = $111,554
OCF2011 = $90,584 + 52,282 – 15,812
OCF2011 = $127,054
4.
To calculate the cash flow from assets, we need to find the capital spending and change in net working capital. The capital spending for the year was:
Capital spending
Ending net fixed assets
$248,625
– Beginning net fixed assets
204,068
+ Depreciation
52,282
Net capital spending
$96,839
And the change in net working capital was:
Change in net working capital
Ending NWC
$32,713
– Beginning NWC
11,819
Change in NWC
$20,894
So, the cash flow from assets was:
Cash flow from assets
Operating cash flow
$127,054
– Net capital spending
96,839
– Change in NWC
...
Take Assessment Exam 3Top of FormNameExam 3 Ins.docxmattinsonjanel
Take Assessment: Exam 3
Top of Form
Name
Exam 3
Instructions
Multiple Attempts
This Test allows 2 attempts. This is attempt number 1.
Force Completion
This Test can be saved and resumed later.
Question Completion Status:
1
2
3
4
5
6
7
8
9
10
11
12
13
14
15
16
17
18
19
20
21
22
23
24
25
26
27
28
29
30
31
32
33
34
35
36
37
38
39
40
41
42
43
44
45
46
47
48
49
50
51
52
53
54
55
56
57
58
59
60
61
62
63
64
65
66
67
68
69
70
71
72
73
74
75
76
77
78
79
80
81
82
83
84
85
86
87
88
89
90
91
92
93
94
95
96
97
98
99
100
Question 1
1 points
Save
The tendency of the rate earned on stockholders' equity to vary disproportionately from the rate earned on total assets is sometimes referred to as
leverage.
solvency.
yield.
quick assets.
Question 2
1 points
Save
The independent auditor's report does which of the following?
Describes which financial statements are covered by the audit
Gives the auditor's opinion regarding the fairness of the financial statements
Summarizes what the auditor did
States that the financial statements are truthful
Question 3
1 points
Save
The relationship of 120 to 100 can be expressed as 1.2, 1.2:1, or 120%.
True
False
Question 4
1 points
Save
The terms acid-test ratio and quick ratio refer to the same ratio--the instant debt-paying ability of a company.
True
False
Question 5
1 points
Save
The percentage analysis of increases and decreases in corresponding items in comparative financial statements is referred to as vertical analysis.
True
False
Question 6
1 points
Save
The relationship of each asset item as a percent of total assets is an example of horizontal analysis.
True
False
Question 7
1 points
Save
A balance sheet shows cash, $75,000; marketable securities, $110,000; receivables, $90,000; and $225,000 of inventories. Current liabilities are $200,000. The current ratio is 1.375 to 1.
True
False
Question 8
1 points
Save
What type of analysis is indicated by the following?
Increase (Decrease*)
2011
2010
Amount
Percent
Current assets
$ 380,000
$ 500,000
$(120,000*)
(24%)*
Fixed assets
1,680,000
1,500,000
180,000
12%
Vertical analysis
Horizontal analysis
Liquidity analysis
Common-size analysis
Question 9
1 points
Save
Current position analysis indicates a company's ability to liquidate current liabilities.
True
False
Question 10
1 points
Save
Which of the following is NOT included in the computation of the quick ratio?
Inventory
Marketable securities
Accounts receivable
Cash
Question 11
1 points
Save
Based on the following data for the current year, what is the number of days' sales in inventory (rounded to the nearest whole day)?
Net sales on account during year
$1,204,000
Cost of merchandise sold during year
630,000
Accounts receivable, beginning of ...
Rexnord Corporation (RXN) Q3 Fiscal Year 2020 Financial ResultsRexnord
This presentation and discussion contains certain forward-looking statements that are subject to the Safe Harbor and Cautionary language contained in the press release we issued on January 28, 2020, as well as other factors that could cause actual results to differ materially from those discussed and that are disclosed in our filings with the Securities and Exchange Commission.
Some comparisons will refer to certain non-GAAP measures. Our earnings release and SEC filings contain additional information about these non-GAAP measures, why we use them and why we believe they are helpful to investors, and contain reconciliations to GAAP data.
Due Tues., May 2- 7 questions Big Time Picture Frames h.docxsagarlesley
Due Tues., May 2- 7 questions
Big Time Picture Frames has asked you to determine whether the company's ability to pay current
liabilities and total liabilities improved or deteriorated during 2009. To answer this question, you gather the
following data:
______________________________________________2009__________2008
Cash $52, 000 51, 000
Short-term investments 30,000 --
Net receivables 110,000 120, 000
Inventory 217,000 262,000
Total assets 540,000 490,000
Total current liabilities 265,000 202,000
Long-term note payable 44,000 54,000
Income from operations 165,000 153,000
Interest expense 44,000 37,000
Requirement
1. Compute the following ratios for 2009 and 2008:
a. Current ratio
b. Acid-test ratio
c. Debt ratio
d. Times-interest-earned ratio
a. Calculate the current ratio for both years. (Round your answers to two decimal places.)
2009: nothing
2008: nothing
The Variline Inc., comparative income statement follows. 2010 data are given as needed.
Variline, Inc.
Comparative Income Statement
Years Ended December 31, 2012 and 2011
(Dollars in thousands) 2012 2011 2010
Net sales $176,000 $160,000
Cost of goods sold 93,600 86,000
Selling and general expenses 46,800 41,400
Interest expense 9,600 10,900
Income tax expense 10,200 9,200
Net income $15,800 $12,500
Additional data:
Total assets $201,000 $192,000 $174,000
Common stockholders' equity $96,900 $89,800 $79,500
Preferred dividends $3,400 $3,400 $0
Common shares outstanding during the
year 20,000 20,000 18,000
Requirements
1. Calculate the rate of return on net sales.
2. Calculate the rate of return on total assets.
3. Calculate the rate of return on common stockholders' equity.
4. Calculate the EPS.
5. Did the company's operating performance improve or deteriorate during 2012?
Requirement 1. Calculate the rates of return on net sales for 2012 and 2011. (Round your answers to
three decimal places.)
2012:
nothing
2011: nothing
The Specialty Department Stores, Inc., chief executive officer (CEO) has asked you to compare the
company's profit performance and financial position with the average for the industry. The CEO has
given you the company's income statement and balance sheet, as well as the industry average data for
retailers.
Specialty Department Stores, Inc.
Income Statement Compared with Industry Average
Year Ended December 31, 2010
Industry
Specialty Average
Net sales $782,000 100.0 %
Cost of goods sold 526,286 65.8
Gross profit 255,714 34.2
Operating expenses 164,220 19.7
Operating income 91,494 14.5
Other expenses 6,256 0.4
Net income $85,238 14.1 %
Specialty Department Stores, Inc.
Balance Sheet Compared with Industry Average
December 31, 2010
...
The first two categories are home owners who either want to complete the project themselves or have Home Depot complete the project for them. The professional customers are usually general contractors, business owners or repairmen.
Analysis the current ratio, though not high, does imply a positive working capital. From this ratio it appears that it is not close to the industry standard. It is, however, in a better working capital position then its' closest competitor. Home Depot's Quick Ratio has been in a decline over recent years. It implies that they are running the risk of becoming dependent on inventory and other "less" current assets to liquidate short term debt. Because they are a retail center, this might not be as big of and issue as in other industries. Their competitor, Lowes is in an even worse position. Currently, Home Depot can pay off 46% of its debt. This percentage has dropped from 2006 (59% ) and seems to be hovering at the less than half number. Because they have been hit hard by the recession, they might have leveraged themselves more until retail sales improves.
This ratio shows that Home Depot is definitely on the low end of the industry scale. However, so is Lowe's. Having the top two industry leaders in this situation definitely illustrates the effect the economy has had on the industry. Even though both Home Depot and Lowe's are considered low price leaders they are not showing this by this ratio. It is our belief that all of the activity ratios are going to be low due to the recessive nature of the current economy. These ratios reinforces the Home depot's statements in the annual report regarding this economy.
The calculation done by our group and the calculation in the Statement of Earnings in the annual report does not match up. They quote a higher number. Based on our findings, Home Depot is showing weaknessin the net income earned per share. Please see the pay out ratio as it relates to the results of this relationship. Home Depot makes up for the lower earnings per share in the percentage dividends that it distributes to its owners. It definitely beats Lowes. Home Depot has been consistent in giving a decent dividend to its' shareholders over the past years.
Home Depot is financed more through equity than debt. Home Depot is well with in the industry standard to meet its interest payments. A weak cash flow generation could be a result of the current economic situation. There are no issues with the book value because the market value is well above this value.