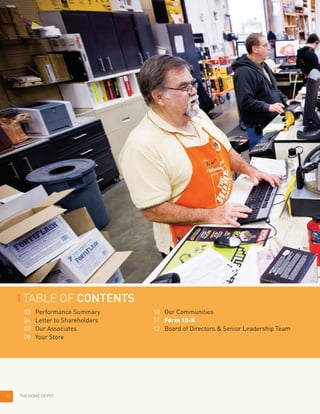
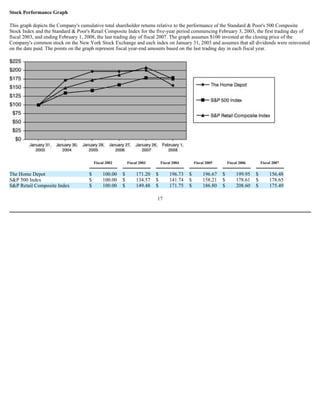
This document is The Home Depot's 2007 Annual Report. It provides a summary of the company's financial performance for 2007, including net sales, net earnings, earnings per share, total assets, liabilities, and store count. It discusses investments made in areas like associate engagement, product excitement, availability, shopping environment, and serving professional customers. It also summarizes international performance, the company strategy of focusing on retail operations, and capital allocation plans. The report is addressed to shareholders, associates, customers, suppliers and communities.


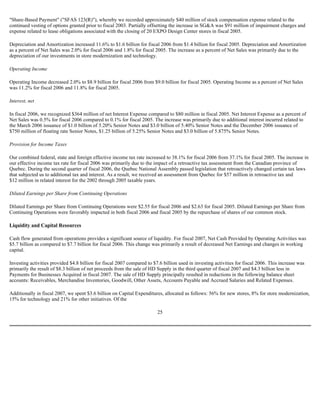


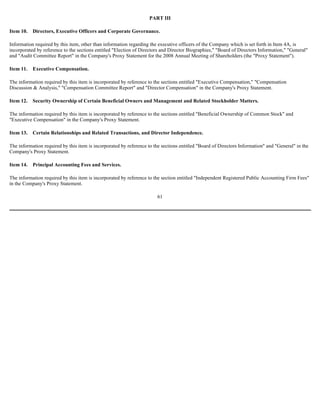
![PART IV
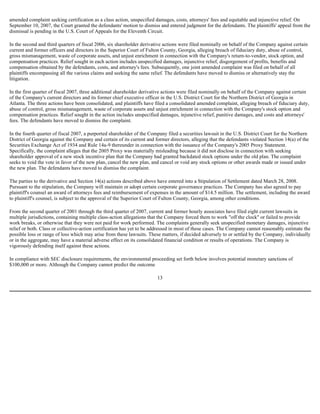
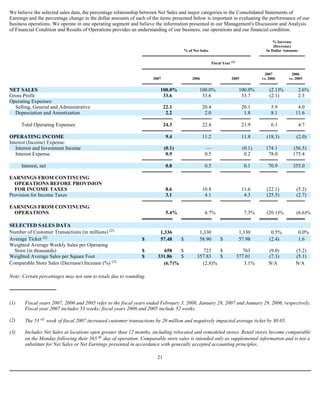
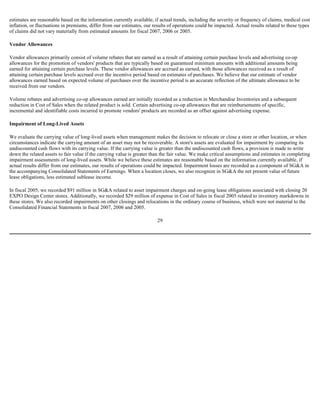
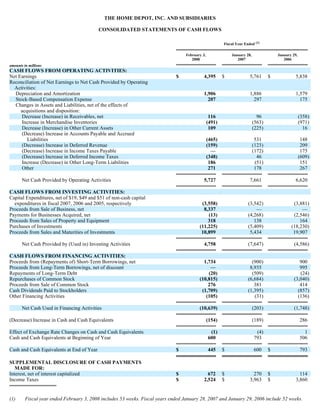
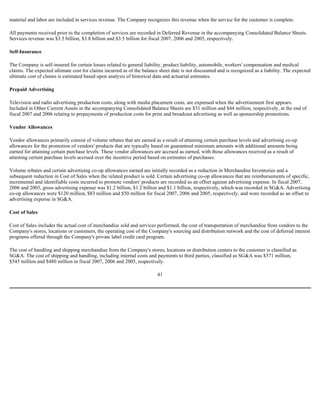
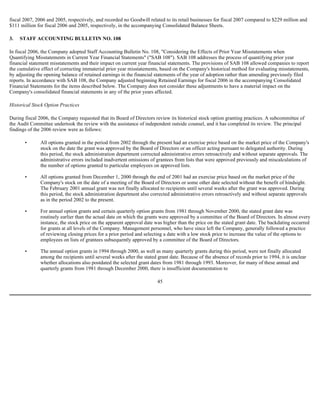
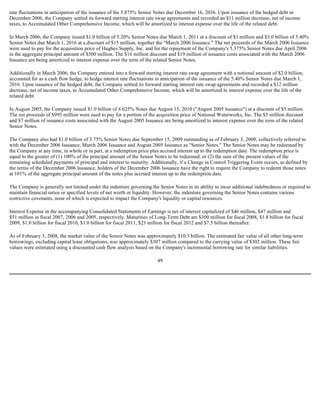
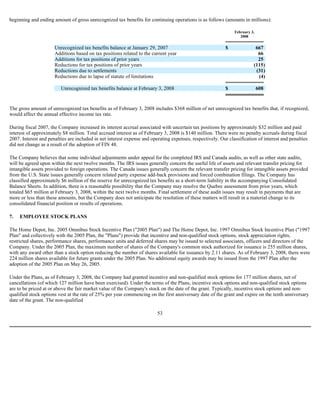
Item 15. Exhibits, Financial Statement Schedules.
(a)(1) Financial Statements
The following financial statements are set forth in Item 8 hereof:
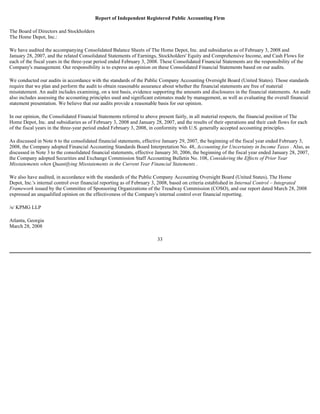
— Consolidated Statements of Earnings for the fiscal years ended February 3, 2008, January 28, 2007 and January 29, 2006;
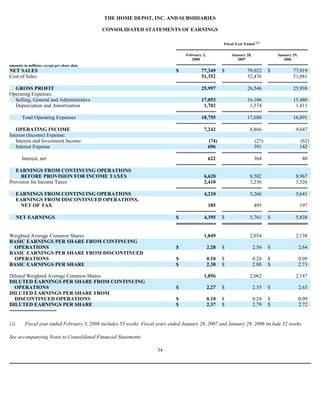
— Consolidated Balance Sheets as of February 3, 2008 and January 28, 2007;
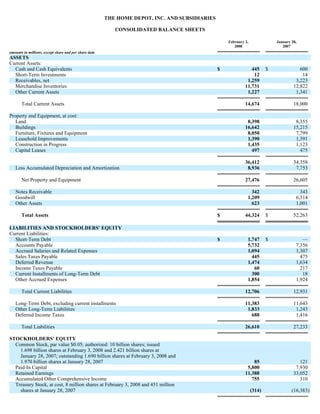
— Consolidated Statements of Stockholders' Equity and Comprehensive Income for the fiscal years ended February 3, 2008,
January 28, 2007 and January 29, 2006;
— Consolidated Statements of Cash Flows for the fiscal years ended February 3, 2008, January 28, 2007 and January 29,
2006;
— Notes to Consolidated Financial Statements;
— Management's Responsibility for Financial Statements and Management's Report on Internal Control Over Financial
Reporting; and
— Reports of Independent Registered Public Accounting Firm.
(2) Financial Statement Schedules
All schedules are omitted as the required information is inapplicable or the information is presented in the consolidated financial statements or
related notes.
(3) Exhibits
Exhibits marked with an asterisk (*) are incorporated by reference to exhibits or appendices previously filed with the Securities and Exchange
Commission, as indicated by the references in brackets. All other exhibits are filed herewith.
62
*2.1 Purchase and Sale Agreement, dated as of June 19, 2007, by and between The Home Depot, Inc., THD Holdings, LLC,
Home Depot International, Inc., Homer TLC, Inc. and Pro Acquisition Corporation. [ Form 8-K filed on June 20, 2007,
Exhibit 2.1 ]
*2.2 Letter agreement, dated August 14, 2007, by and between The Home Depot, Inc., THD Holdings, LLC, Home Depot
International, Inc., Homer TLC, Inc. and Pro Acquisition Corporation. [ Form 8-K filed on August 15, 2007, Exhibit 2.1 ]
*2.3 Amendment, dated August 27, 2007, by and between The Home Depot, Inc., THD Holdings, LLC, Home Depot
International, Inc., Homer TLC, Inc. and Pro Acquisition Corporation. [ Form 10-Q for the fiscal quarter ended July 29,
2007, Exhibit 2.3 ]
*3.1 Amended and Restated Certificate of Incorporation of The Home Depot, Inc. [ Form 10-Q for the fiscal quarter ended
August 4, 2002, Exhibit 3.1 ]
*3.2 By-Laws, as amended and restated. [ Form 8-K filed on May 29, 2007, Exhibit 3.1 ]
*4.1 Indenture dated as of September 16, 2004 between The Home Depot, Inc. and The Bank of New York. [ Form 8-K filed
September 17, 2004, Exhibit 4.1 ]
*4.2 Indenture, dated as of May 4, 2005, between The Home Depot, Inc. and The Bank of New York Trust Company, N.A., as
Trustee. [ Form S-3 (File No. 333-124699) filed May 6, 2005, Exhibit 4.1 ]
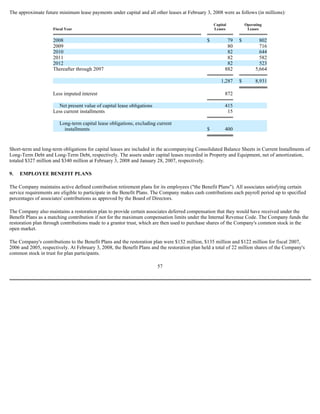
*4.3 Form of 3.75% Senior Note due September 15, 2009. [ Form 8-K filed on September 17, 2004, Exhibit 4.2 ]](https://image.slidesharecdn.com/1015264/85/home-depot-2007-Annual-Report-79-320.jpg)
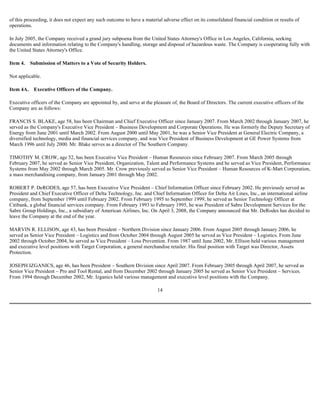
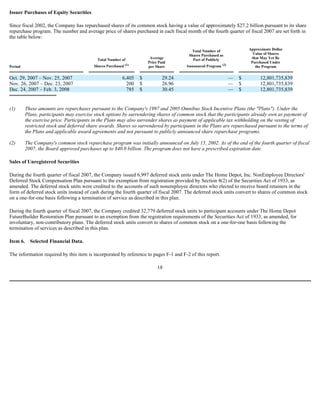
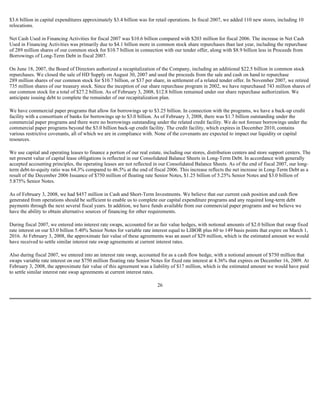
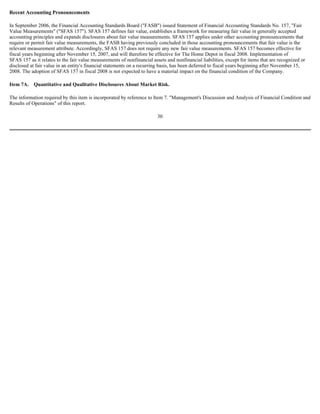
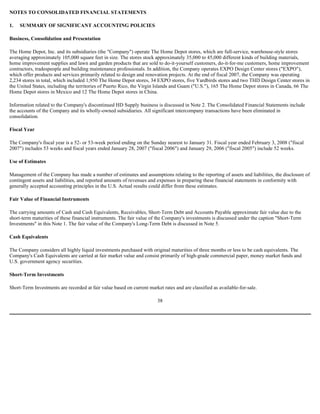
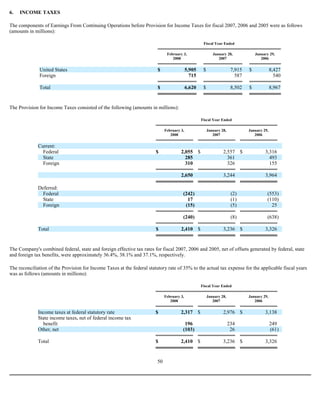
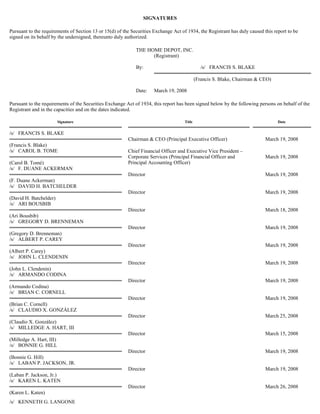
![63
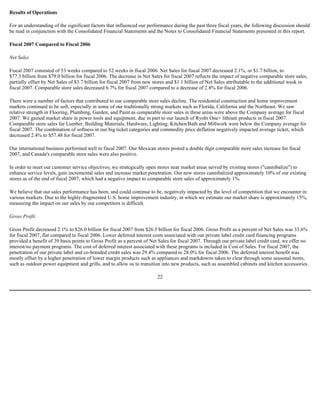
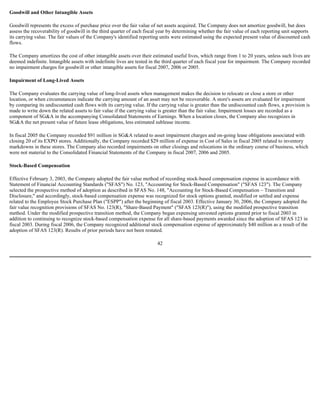
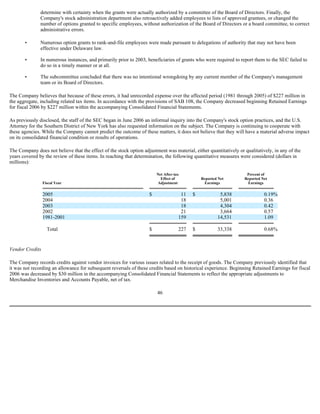
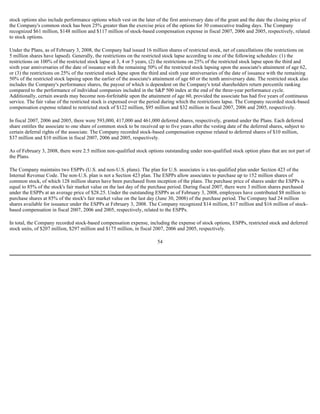
*4.4 Form of 4.625% Senior Note due August 15, 2010. [ Form 10-K for the fiscal year ended January 29, 2006, Exhibit 4.6 ]
*4.5 Form of 5.20% Senior Note due March 1, 2011. [ Form 8-K filed March 23, 2006, Exhibit 4.1 ]
*4.6 Form of 5.40% Senior Note due March 1, 2016. [ Form 8-K filed March 23, 2006, Exhibit 4.2 ]
*4.7 Form of Floating Rate Senior Note due December 16, 2009. [ Form 8-K filed December 19, 2006, Exhibit 4.1 ]
*4.8 Form of 5.250% Senior Note due December 16, 2013. [ Form 8-K filed December 19, 2006, Exhibit 4.2 ]
*4.9 Form of 5.875% Senior Note due December 16, 2036. [ Form 8-K filed December 19, 2006, Exhibit 4.3 ]
*10.1† The Home Depot, Inc. Amended and Restated Employee Stock Purchase Plan, as amended and restated effective July 1,
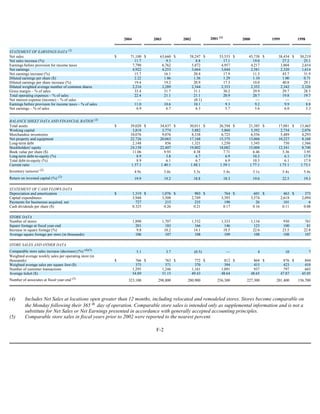
2003. [ Form 10-Q for the fiscal quarter ended November 2, 2003, Exhibit 10.1 ]
*10.2† Amendment No.1 to The Home Depot, Inc. Amended and Restated Employee Stock Purchase Plan, effective July 1, 2004.
[ Form 10-Q for the fiscal quarter ended August 1, 2004, Exhibit 10.2 ]
*10.3† The Home Depot, Inc. Non-U.S. Employee Stock Purchase Plan. [ Form 10-K for the fiscal year ended February 2, 2003,
Exhibit 10.36 ]
*10.4† The Home Depot, Inc. 1997 Omnibus Stock Incentive Plan. [ Form 10-Q for the fiscal quarter ended August 4, 2002,
Exhibit 10.1 ]
*10.5† Form of Executive Officer Restricted Stock Award Pursuant to The Home Depot, Inc. 1997 Omnibus Stock Incentive Plan.
[ Form 10-Q for the fiscal quarter ended October 31, 2004, Exhibit 10.1 ]
*10.6† Form of Executive Officer Nonqualified Stock Option Award Pursuant to The Home Depot, Inc. 1997 Omnibus Stock
Incentive Plan. [ Form 10-Q for the fiscal quarter ended October 31, 2004, Exhibit 10.2 ]
*10.7† Form of Outside Director Nonqualified Stock Option Award Pursuant to The Home Depot, Inc. 1997 Omnibus Stock
Incentive Plan. [ Form 10-Q for the fiscal quarter ended October 31, 2004, Exhibit 10.3 ]
*10.8† Form of Executive Officer Long-Term Incentive Program Performance Unit Award Pursuant to The Home Depot, Inc. 1997
Omnibus Stock Incentive Plan. [ Form 10-Q for the fiscal quarter ended October 31, 2004, Exhibit 10.4 ]
*10.9† The Home Depot, Inc. 2005 Omnibus Stock Incentive Plan. [ Form 8-K filed on May 27, 2005, Exhibit 10.8 ]
*10.10† Form of Restricted Stock Award Pursuant to The Home Depot, Inc. 2005 Omnibus Stock Incentive Plan. [ Form 8-K filed
on March 3, 2008, Exhibit 10.2 ]
*10.11† Form of Deferred Share Award (Non-Employee Director) Pursuant to The Home Depot, Inc. 2005 Omnibus Stock Incentive
Plan. [ Form 8-K filed on March 27, 2007, Exhibit 10.2 ]
*10.12† Form of Deferred Share Award (U.S. Officers) Pursuant to The Home Depot, Inc. 2005 Omnibus Stock Incentive Plan.
[ Form 8-K filed on May 27, 2005, Exhibit 10.3 ]
*10.13† Form of Deferred Share Award (Mexico) Pursuant to The Home Depot, Inc. 2005 Omnibus Stock Incentive Plan. [ Form 8-
K filed on March 3, 2008, Exhibit 10.1 ]
*10.14† Form of Deferred Share Award (Canada) Pursuant to The Home Depot, Inc. 2005 Omnibus Stock Incentive Plan. [ Form 8-
K filed on March 3, 2008, Exhibit 10.3 ]
*10.15† Form of Nonqualified Stock Option (Non-Employee Directors) Pursuant to The Home Depot, Inc. 2005 Omnibus Stock
Incentive Plan. [ Form 8-K filed on March 27, 2007, Exhibit 10.5 ]
*10.16† Form of Nonqualified Stock Option Pursuant to The Home Depot, Inc. 2005 Omnibus Stock Incentive Plan. [ Form 8-K
filed on March 27, 2007, Exhibit 10.6 ]
*10.17† Form of Performance Share Award Pursuant to The Home Depot, Inc. 2005 Omnibus Stock Incentive Plan. [ Form 8-K
filed on March 27, 2007, Exhibit 10.7 ]](https://image.slidesharecdn.com/1015264/85/home-depot-2007-Annual-Report-80-320.jpg)
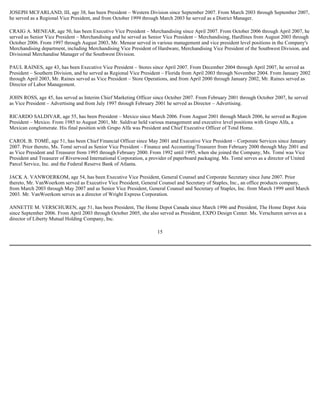
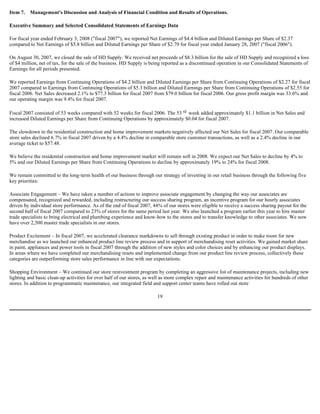
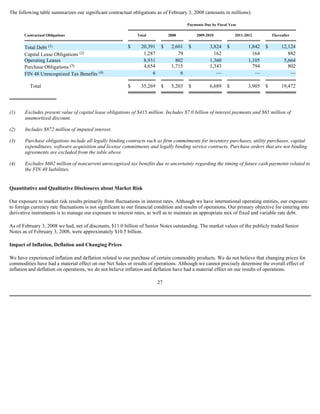
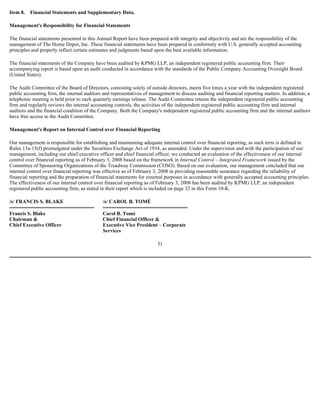
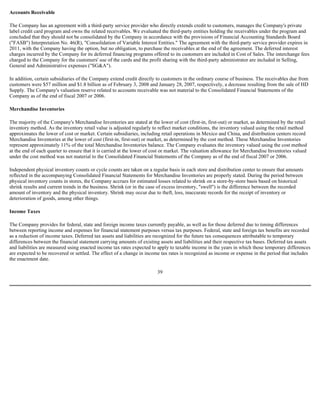
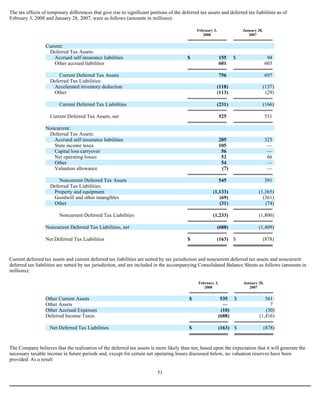
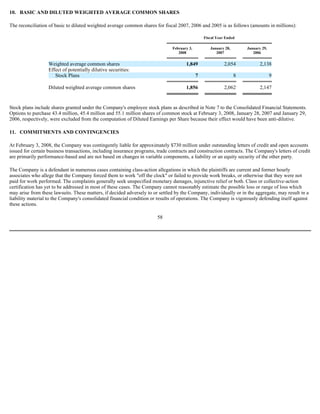
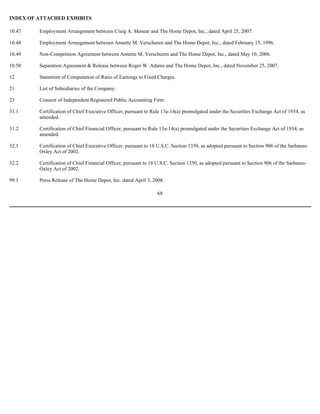
![64
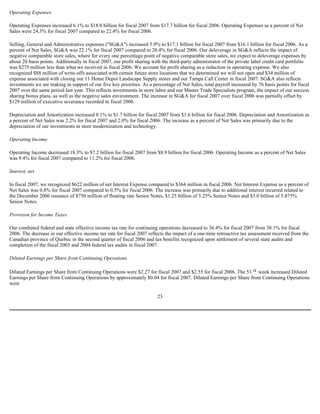
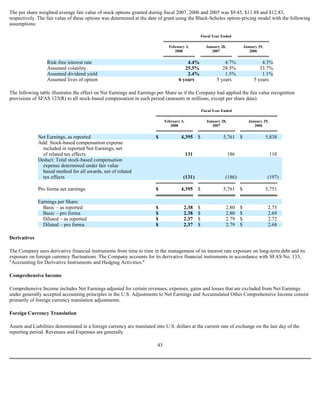
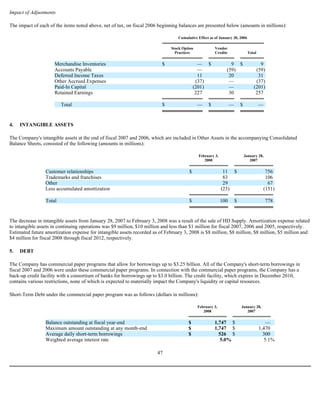
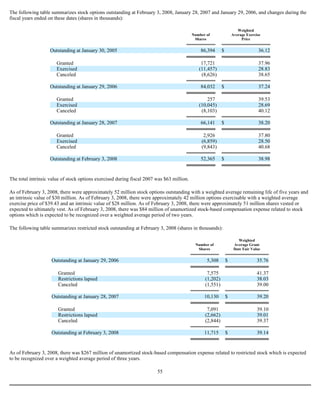
*10.18† Form of Performance Share Award (Mexico) Pursuant to The Home Depot, Inc. 2005 Omnibus Stock Incentive Plan.
[ Form 8-K filed on March 27, 2007, Exhibit 10.8 ]
*10.19† Form of Performance Vested Option Award Pursuant to The Home Depot, Inc. 2005 Omnibus Stock Incentive Plan.
[ Form 8-K filed on March 27, 2007, Exhibit 10.9 ]
*10.20† Form of LTIP Performance Unit Award Pursuant to The Home Depot, Inc. 2005 Omnibus Stock Incentive Plan. [ Form 8-K
filed on March 27, 2007, Exhibit 10.10 ]
*10.21† The Home Depot FutureBuilder Restoration Plan. [ Form 8-K filed on August 20, 2007, Exhibit 10.10 ]
*10.22† Non-Qualified Stock Option and Deferred Stock Unit Plan and Agreement dated as of December 4, 2000. [ Form 10-K for
the fiscal year ended January 28, 2001, Exhibit 10.20 ]
*10.23† The Home Depot FutureBuilder for Puerto Rico. [ Form 10-K for the fiscal year ended February 2, 2003, Exhibit 10.35 ]
*10.24† First Amendment To The Home Depot FutureBuilder for Puerto Rico, effective July 5, 2004. [ Form S-8 (File No. 333-
125332) filed May 27, 2005, Exhibit 10.3 ]
*10.25† The Home Depot FutureBuilder, a 401(k) and Stock Ownership Plan, as amended and restated effective July 1, 2004.
[ Form 10-Q for the fiscal quarter ended October 31, 2004, Exhibit 10.5 ]
*10.26† The Home Depot Long-Term Incentive Plan. [ Form 10-K for the fiscal year ended February 2, 2003, Exhibit 10.42 ]
*10.27† Senior Officers' Bonus Pool Plan, as amended. [ Appendix A to Proxy Statement for the Annual Meeting of
Shareholders held May 26, 1999 ]
*10.28† Executive Officers' Bonus Plan. [ Appendix B to Proxy Statement for the Annual Meeting of Shareholders held
May 27, 1998 ]
*10.29† Supplemental Executive Choice Program, effective January 1, 1999. [ Form 10-K for the fiscal year ended February 3,
2002, Exhibit 10.15 ]
*10.30† Home Depot U.S.A., Inc. Deferred Compensation Plan for Officers. [ Form 10-K for the fiscal year ended February 2,
2003, Exhibit 10.38 ]
*10.31† The Home Depot Executive Life Insurance, Death Benefit Only Plan. [ Form 10-K for the fiscal year ended February 2,
2003, Exhibit 10.39 ]
*10.32† The Home Depot Executive Physical Program. [ Form 10-K for the fiscal year ended February 2, 2003, Exhibit 10.40 ]
*10.33† The Home Depot Management Incentive Plan. [ Appendix A to Proxy Statement for the Annual Meeting of
Shareholders held on May 30, 2003 ]
*10.34† The Home Depot, Inc. Management Incentive Plan Fiscal Year 2007 Performance Measures. [ Form 8-K filed on
March 27, 2007, Exhibit 10.11 ]
*10.35† The Home Depot, Inc. Non-Employee Directors' Deferred Stock Compensation Plan. [ Form 8-K filed on August 20, 2007,
Exhibit 10.3 ]
*10.36† Separation Agreement Between the Company and Robert Nardelli effective as of January 2, 2007. [ Form 10-K for the
fiscal year ended January 28, 2007, Exhibit 10.37 ]
*10.37† Deferred Payment Trust dated as of January 12, 2007. [ Form 10-K for the fiscal year ended January 28, 2007,
Exhibit 10.38 ]
*10.38† Employment Arrangement between Frank Blake and The Home Depot, Inc., dated January 23, 2007. [ Form 8-K/A filed on
January 24, 2007, Exhibit 10.1 ]
*10.39† Employment Arrangement between Carol B. Tomé and The Home Depot, Inc., dated January 22, 2007. [ Form 8- K/A filed
on January 24, 2007, Exhibit 10.2 ]](https://image.slidesharecdn.com/1015264/85/home-depot-2007-Annual-Report-81-320.jpg)
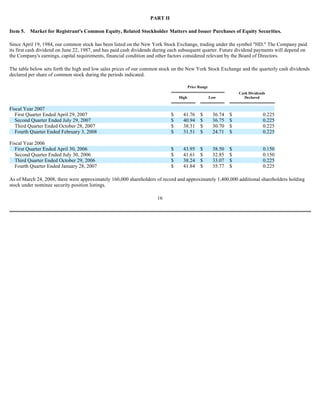
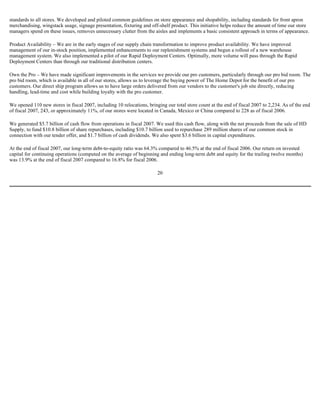
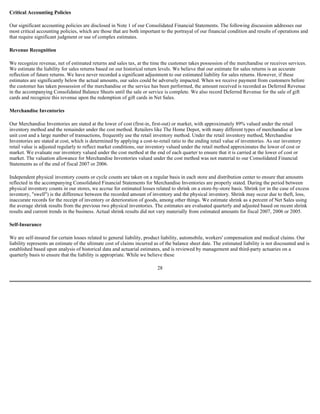
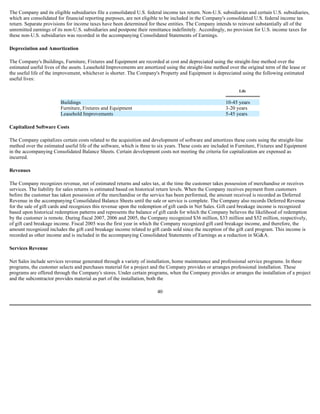
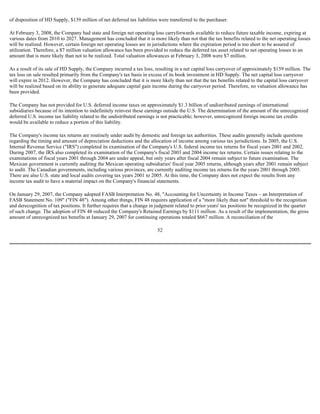
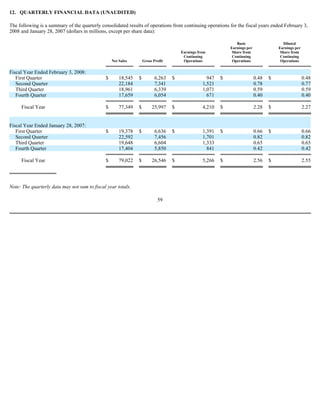
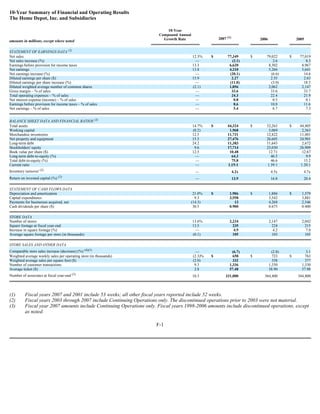
![65
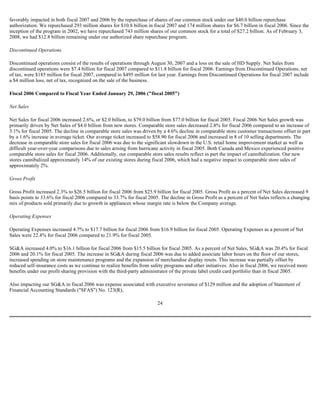
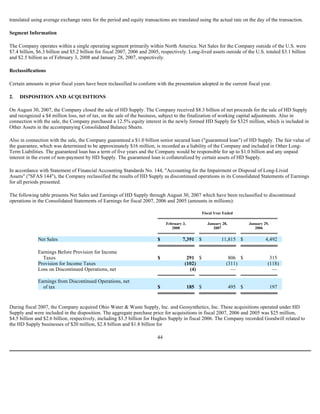
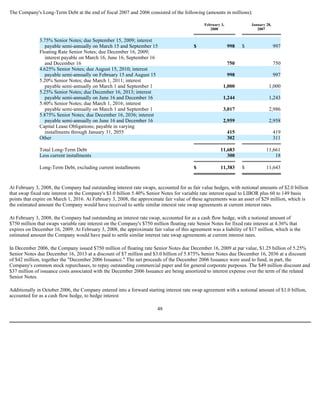
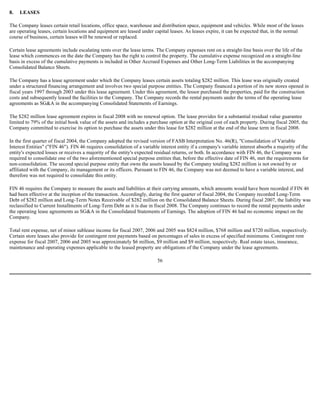
*10.40† Employment Arrangement between Joe DeAngelo and The Home Depot, Inc., dated January 23, 2007. [ Form 8-K/A filed
on January 24, 2007, Exhibit 10.3 ]
*10.41† Letter Agreement between Joseph J. DeAngelo and The Home Depot, Inc. and HD Supply, Inc., dated May 24, 2007
[ Form 10-Q for the fiscal quarter ended July 29, 2007, Exhibit 10.3 ]
*10.42† Employment Agreement between Dennis M. Donovan and The Home Depot, Inc. dated March 16, 2001. [ Form S-4 (File
No. 333- 61548) filed May 24, 2001, Exhibit 10.1 ]
*10.43† Deferred Stock Units Plan and Agreement between Dennis M. Donovan and The Home Depot, Inc. dated as of May 31,
2001.[ Form 10-K for the fiscal year ended February 3, 2002, Exhibit 10.25 ]
*10.44† Employment Agreement between Frank L. Fernandez and The Home Depot, Inc. dated April 2, 2001. [ Form S-4 (File
No. 333- 61548) filed May 24, 2001, Exhibit 10.2 ]
*10.45† Deferred Stock Units Plan and Agreement between Frank L. Fernandez and The Home Depot, Inc. dated April 2, 2001.
[ Form S-4 (File No. 333-61548) filed May 24, 2001, Exhibit 10.3 ]
*10.46† Employment Agreement between Robert DeRodes and The Home Depot, Inc., effective as of February 7, 2002. [ Form 10-
Q for the fiscal quarter ended November 3, 2002, Exhibit 10.2 ]
10.47† Employment Arrangement between Craig A. Menear and The Home Depot, Inc., dated April 25, 2007.
10.48† Employment Arrangement between Annette M. Verschuren and The Home Depot, Inc., dated February 15, 1996.
10.49† Non-Competition Agreement between Annette M. Verschuren and The Home Depot, Inc., dated May 10, 2006.
10.50† Separation Agreement & Release between Roger W. Adams and The Home Depot, Inc., dated November 25, 2007.
*10.51† Separation Agreement & Release by and between The Home Depot, Inc. and John H. Costello, dated September 8, 2005.
[ Form 10-Q for the fiscal quarter ended October 30, 2005, Exhibit 10.1 ]
*10.52 Participation Agreement dated as of October 22, 1998 among The Home Depot, Inc. as Guarantor; Home Depot U.S.A., Inc.
as Lessee; HD Real Estate Funding Corp. II as Facility Lender; Credit Suisse Leasing 92A L.P. as Lessor; The Bank of New
York as Indenture Trustee; and Credit Suisse First Boston Corporation and Invemed Associates, Inc. as Initial Purchasers.
[ Form 10-K for the fiscal year ended January 31, 1999, Exhibit 10.10 ]
*10.53 Master Modification Agreement dated as of April 20, 1998 among The Home Depot, Inc. as Guarantor; Home Depot
U.S.A., Inc., as Lessee and Construction Agent; HD Real Estate Funding Corp., as Facility Lender; Credit Suisse Leasing
92A L.P. as Lessor; the lenders named on the Schedule thereto as Lenders; and Credit Suisse First Boston Corporation as
Agent Bank. [ Form 10-K for the fiscal year ended January 31, 1999, Exhibit 10.13 ]
*10.54 Credit Agreement between The Home Depot, Inc., Lehman Commercial Paper Inc., Merrill Lynch Capital Corporation and
certain of their affiliates, dated August 28, 2007. [ Form 8-K filed on August 31, 2007, Exhibit 10.1 ]
12 Statement of Computation of Ratio of Earnings to Fixed Charges.
21 List of Subsidiaries of the Company.
23 Consent of Independent Registered Public Accounting Firm.
31.1 Certification of Chief Executive Officer, pursuant to Rule 13a-14(a) promulgated under the Securities Exchange Act of
1934, as amended.
31.2 Certification of Chief Financial Officer, pursuant to Rule 13a-14(a) promulgated under the Securities Exchange Act of 1934,
as amended.
32.1 Certification of Chief Executive Officer, pursuant to 18 U.S.C. Section 1350, as adopted pursuant to Section 906 of the
Sarbanes-Oxley Act of 2002.
32.2 Certification of Chief Financial Officer, pursuant to 18 U.S.C. Section 1350, as adopted pursuant to Section 906 of the
Sarbanes-Oxley Act of 2002.](https://image.slidesharecdn.com/1015264/85/home-depot-2007-Annual-Report-82-320.jpg)


![The Value Of HISP Certification [Compatibility Mode]](https://cdn.slidesharecdn.com/ss_thumbnails/thevalueofhispcertificationcompatibilitymode-12940798146442-phpapp02-thumbnail.jpg?width=640&height=640&fit=bounds)


