hlb 028300 Algorithm Investment Report
•
0 likes•20 views

hlb 028300 Algorithm Investment Report
![[Price for scheduled purchasing]
Arbitrarily made
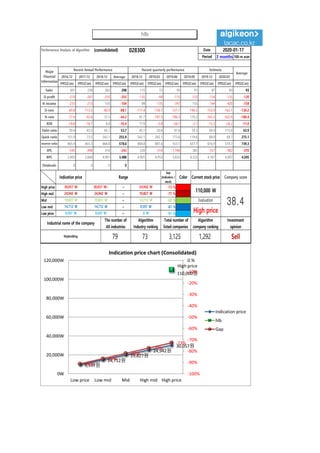
Algorithm stocks Trading Strategies (consolidated) 028300 Date
Period
Gap
(Indication /
stock)
Color
low price 9,597 W 9,597 W ~ 0 W -91 % 270,166 W 28
Low mid 14,712 W 14,712 W ~ 9,597 W -87 % 256,402 W 17
Mid 19,827 W 19,827 W ~ 14,712 W -82 % 242,639 W 12
High mid 24,942 W 24,942 W ~ 19,827 W -77 % 228,875 W 9
Suggested Purchase
Amount 295,988 W
Number of stocks
purchased 3
Indication price Range Buying / Selling Buying / Selling [Stocks]
High price 30,057 W 30,057 W~ ~ 24,942 W -73 % 215,112 W 7
2020-01-17
3 months
Current stock price Evaluation
Stock price rise
probability score
Investment opinion Prospective purchase amount
110,000 W High price 45.7 Sell 1,500,000 W
39.4 30.0 37.5 37.1 41.6 37.4
2019.08.20 2019.09.19 019.10.21 2019.11.18 2019.12.16 2020.01.16
Stock price rise
probability score
A Sector 48.0 46.8 51.3 45.3 48.9 52.3
45.7B Sector 30.8 13.3 23.8 45.3 34.2 22.5
Total average
019.10.21 2019.11.18 2019.12.16 2020.01.16
Total of
increase rate
Total score
A Sector -3 % 9 % -13 % 7 % 6 %
-3 % 43.7B Sector -131 % 44 % 48 % -33 % -52 %
Total average -31 % 20 % -1 % 11 % -11 %
2019.09.19
48 47
51
45
49
52
31
13
24
45
34
23
39
30
38 37
42
37
0
10
20
30
40
50
60
2019.08.20 2019.09.19 019.10.21 2019.11.18 2019.12.16 2020.01.16
Stock price rise probability score
A sector
B sector
Total average
-3%
9%
-13%
7% 6%
-131%
44% 48%
-33%
-52%
-31%
20%
-1%
11%
-11%
-150%
-100%
-50%
0%
50%
100%
2019.09.19 019.10.21 2019.11.18 2019.12.16 2020.01.16
Increase rate of stock price rise
A sector
B sector
Total average
hlb](data:image/gif;base64,R0lGODlhAQABAIAAAAAAAP///yH5BAEAAAAALAAAAAABAAEAAAIBRAA7)
Recommended
Recommended
More Related Content
What's hot
What's hot (20)
Similar to hlb 028300 Algorithm Investment Report
Similar to hlb 028300 Algorithm Investment Report (20)
More from 알고리즘 기업분석 컨설팅-알기컨,algikeon
More from 알고리즘 기업분석 컨설팅-알기컨,algikeon (20)
Recently uploaded
Recently uploaded (20)
hlb 028300 Algorithm Investment Report
- 1. Performance Analysis of Algorithm (consolidated) 028300 Date Period 3 months 100-m won 2016.12 2017.12 2018.12 Average 2018.12 2019.03 2019.06 2019.09 2019.12 2020.03 IFRS(Con) IFRS(Con) IFRS(Con) IFRS(Con) IFRS(Con) IFRS(Con) IFRS(Con) IFRS(Con) IFRS(Con) IFRS(Con) IFRS(Con) Sales 301 230 362 298 115 72 95 91 87 83 93 O-profit -210 -261 -293 -255 -135 -98 -115 -133 -134 -135 -120 N-income -233 -213 135 -104 94 -135 -747 155 -144 -420 -158 O-rate -69.8 -113.5 -80.9 -88.1 -117.4 -136.1 -121.1 -146.2 -153.9 -162.1 -130.2 N-rate -77.4 -92.6 37.3 -44.2 81.7 -187.5 -786.3 170.3 -165.5 -502.9 -180.4 ROE -18.8 -18.7 6.4 -10.4 17.9 -3.8 -56.1 -2.1 -15.3 -26.2 -11.0 Debt-ratio 50.4 65.5 45.1 53.7 45.1 50.8 81.6 78.3 94.9 115.0 63.9 Quick-ratio 151.9 73.5 542.1 255.9 542.1 265.1 173.6 119.6 88.9 69.7 275.1 reserve-ratio 465.9 403.3 864.8 578.0 864.8 881.6 553.1 657.7 616.9 519.7 739.3 EPS -545 -498 316 -243 220 -316 -1,748 363 -337 -982 -370 BPS 2,903 2,660 4,901 3,488 4,901 4,953 3,832 4,333 4,167 4,007 4,505 Dividends 0 0 0 0 Major Financial Information Recent Annual Performance Recent quarterly performance Estimate Average 2020-01-17 Gap (Indication / stock) Color High price ~ -73 % High mid ~ -77 % Mid ~ -82 % Low mid ~ -87 % Low price ~ -91 % Sell 9,597 W 9,597 W 0 W Industrial name of the company The number of All industries Algorithm Industry ranking Total number of listed companies Algorithm company ranking Investment opinion Shipbuilding 79 73 3,125 1,292 24,942 W 24,942 W 19,827 W 19,827 W 19,827 W 14,712 W Evaluation 30,057 W 30,057 W~ 24,942 W 110,000 W 38.414,712 W 14,712 W 9,597 W High price Indication price Range Current stock price Company score 9,597원 14,712원 19,827원 24,942원 30,057원 High price 110,000원 -91% -87% -82% -77% -73% -100% -90% -80% -70% -60% -50% -40% -30% -20% -10% 0.% 0W 20,000W 40,000W 60,000W 80,000W 100,000W 120,000W Low price Low mid Mid High mid High price Indication price chart (Consolidated) Indication price hlb Gap hlb
- 2. [Price for scheduled purchasing] Arbitrarily made Algorithm stocks Trading Strategies (consolidated) 028300 Date Period Gap (Indication / stock) Color low price 9,597 W 9,597 W ~ 0 W -91 % 270,166 W 28 Low mid 14,712 W 14,712 W ~ 9,597 W -87 % 256,402 W 17 Mid 19,827 W 19,827 W ~ 14,712 W -82 % 242,639 W 12 High mid 24,942 W 24,942 W ~ 19,827 W -77 % 228,875 W 9 Suggested Purchase Amount 295,988 W Number of stocks purchased 3 Indication price Range Buying / Selling Buying / Selling [Stocks] High price 30,057 W 30,057 W~ ~ 24,942 W -73 % 215,112 W 7 2020-01-17 3 months Current stock price Evaluation Stock price rise probability score Investment opinion Prospective purchase amount 110,000 W High price 45.7 Sell 1,500,000 W 39.4 30.0 37.5 37.1 41.6 37.4 2019.08.20 2019.09.19 019.10.21 2019.11.18 2019.12.16 2020.01.16 Stock price rise probability score A Sector 48.0 46.8 51.3 45.3 48.9 52.3 45.7B Sector 30.8 13.3 23.8 45.3 34.2 22.5 Total average 019.10.21 2019.11.18 2019.12.16 2020.01.16 Total of increase rate Total score A Sector -3 % 9 % -13 % 7 % 6 % -3 % 43.7B Sector -131 % 44 % 48 % -33 % -52 % Total average -31 % 20 % -1 % 11 % -11 % 2019.09.19 48 47 51 45 49 52 31 13 24 45 34 23 39 30 38 37 42 37 0 10 20 30 40 50 60 2019.08.20 2019.09.19 019.10.21 2019.11.18 2019.12.16 2020.01.16 Stock price rise probability score A sector B sector Total average -3% 9% -13% 7% 6% -131% 44% 48% -33% -52% -31% 20% -1% 11% -11% -150% -100% -50% 0% 50% 100% 2019.09.19 019.10.21 2019.11.18 2019.12.16 2020.01.16 Increase rate of stock price rise A sector B sector Total average hlb
- 3. Compliance notice ① The information provided by The Algorithm Company Analysis Consulting is obtained through reliable data and information and The Algorithm Company Analysis Program (TACAP), but its accuracy or completeness are not guaranteed. Furthermore, it may change over time.Therefore, we are not legally responsible for the results of the data provided by The Algorithm Company Analysis Consulting because of information errors or omissions. ② The Algorithm Company Analysis Consulting and all the information provided on it site are reference materials for investment decisions and the final responsibility of investment is up to users utilizing this information. ③ The Algorithm Company Analysis Consulting and its site do not do anything that violates the related laws such as discretionary transaction. ④ Users can not reallocate and recycle the information provided by The Algorithm Company Analysis Consulting firm let alone the information provided by its Site. ⑤ Be sure to know about application period of this algorithm analysis report in order to improve its accuracy. Tel : 070 - 4667 - 5009 Email : tacac@tacac.co.kr Homepage : tacac.co.kr Blog : tacac.blog.me SERVICES M&A, IPO, RECOVER, CORPORATE RESTRUCTURING, MANAGEMENT OF TECHNOLOGY, BUSINESS STRATEGY, FAMILY BUSINESS Request : http://tacac.co.kr/?page_id=1374 ① Consulting is ob The Algorithm C accuracy or com may change ove for the results o Analysis Consul ② information prov investment decis up ③ do anything tha transaction. ④ by information prov ⑤ analysis report i