This document discusses histograms generated by cell counters. It provides 3 key points:
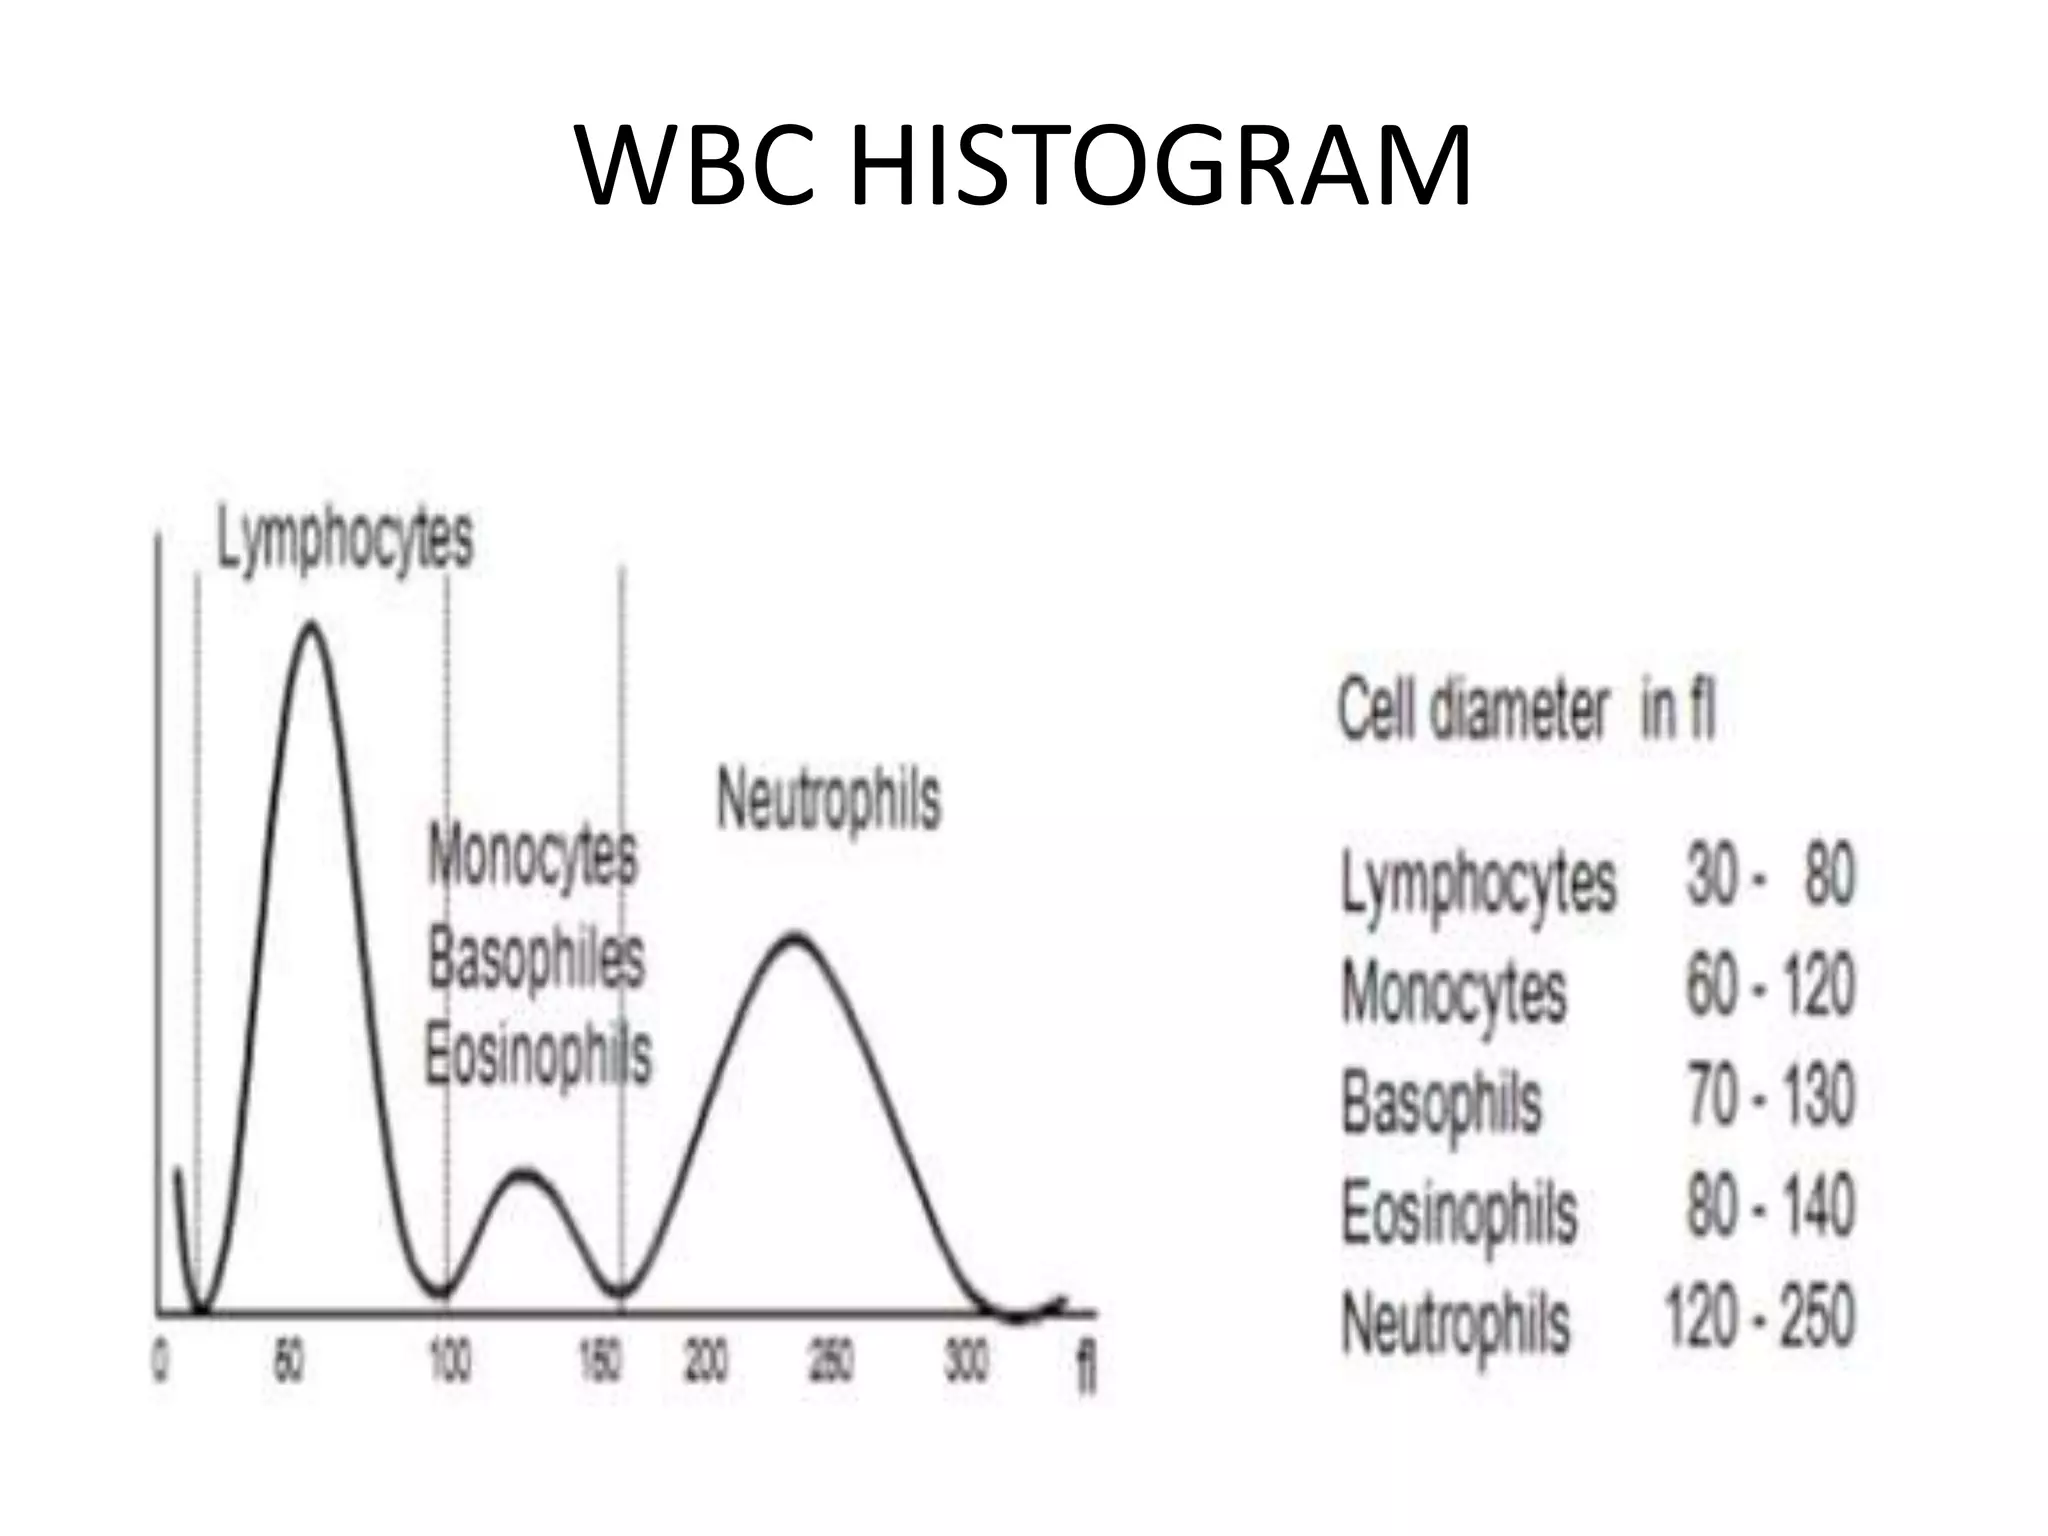
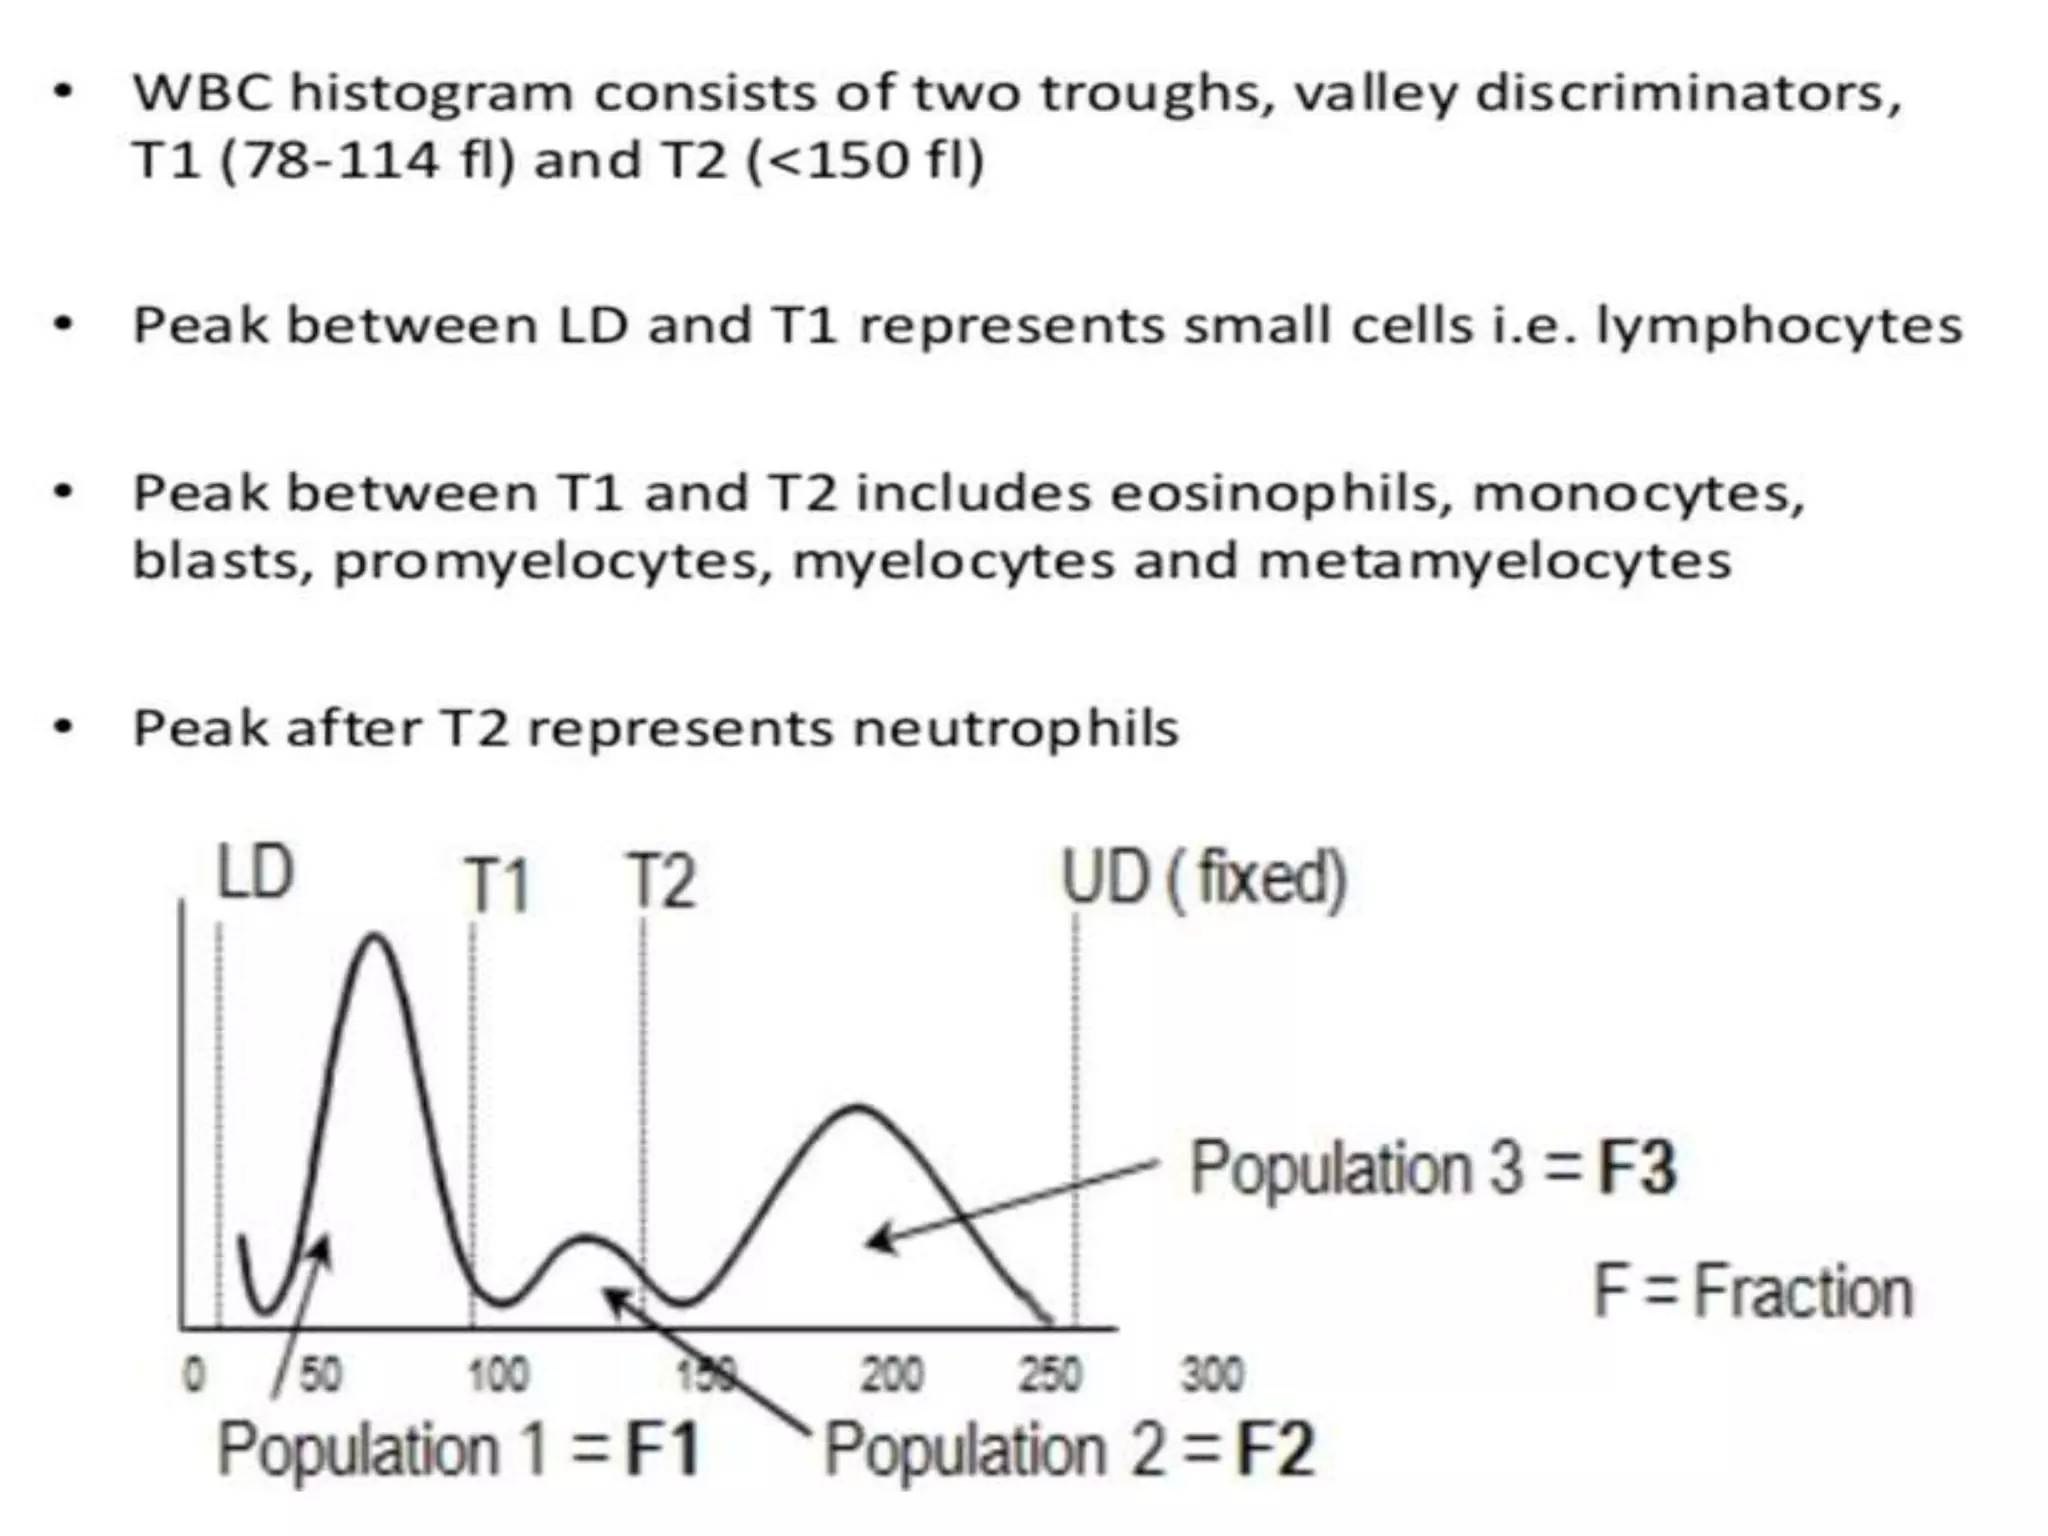
1) Histograms graphically represent the numerical distribution of different cell populations based on cell size, with the y-axis being cell count and x-axis being cell size.
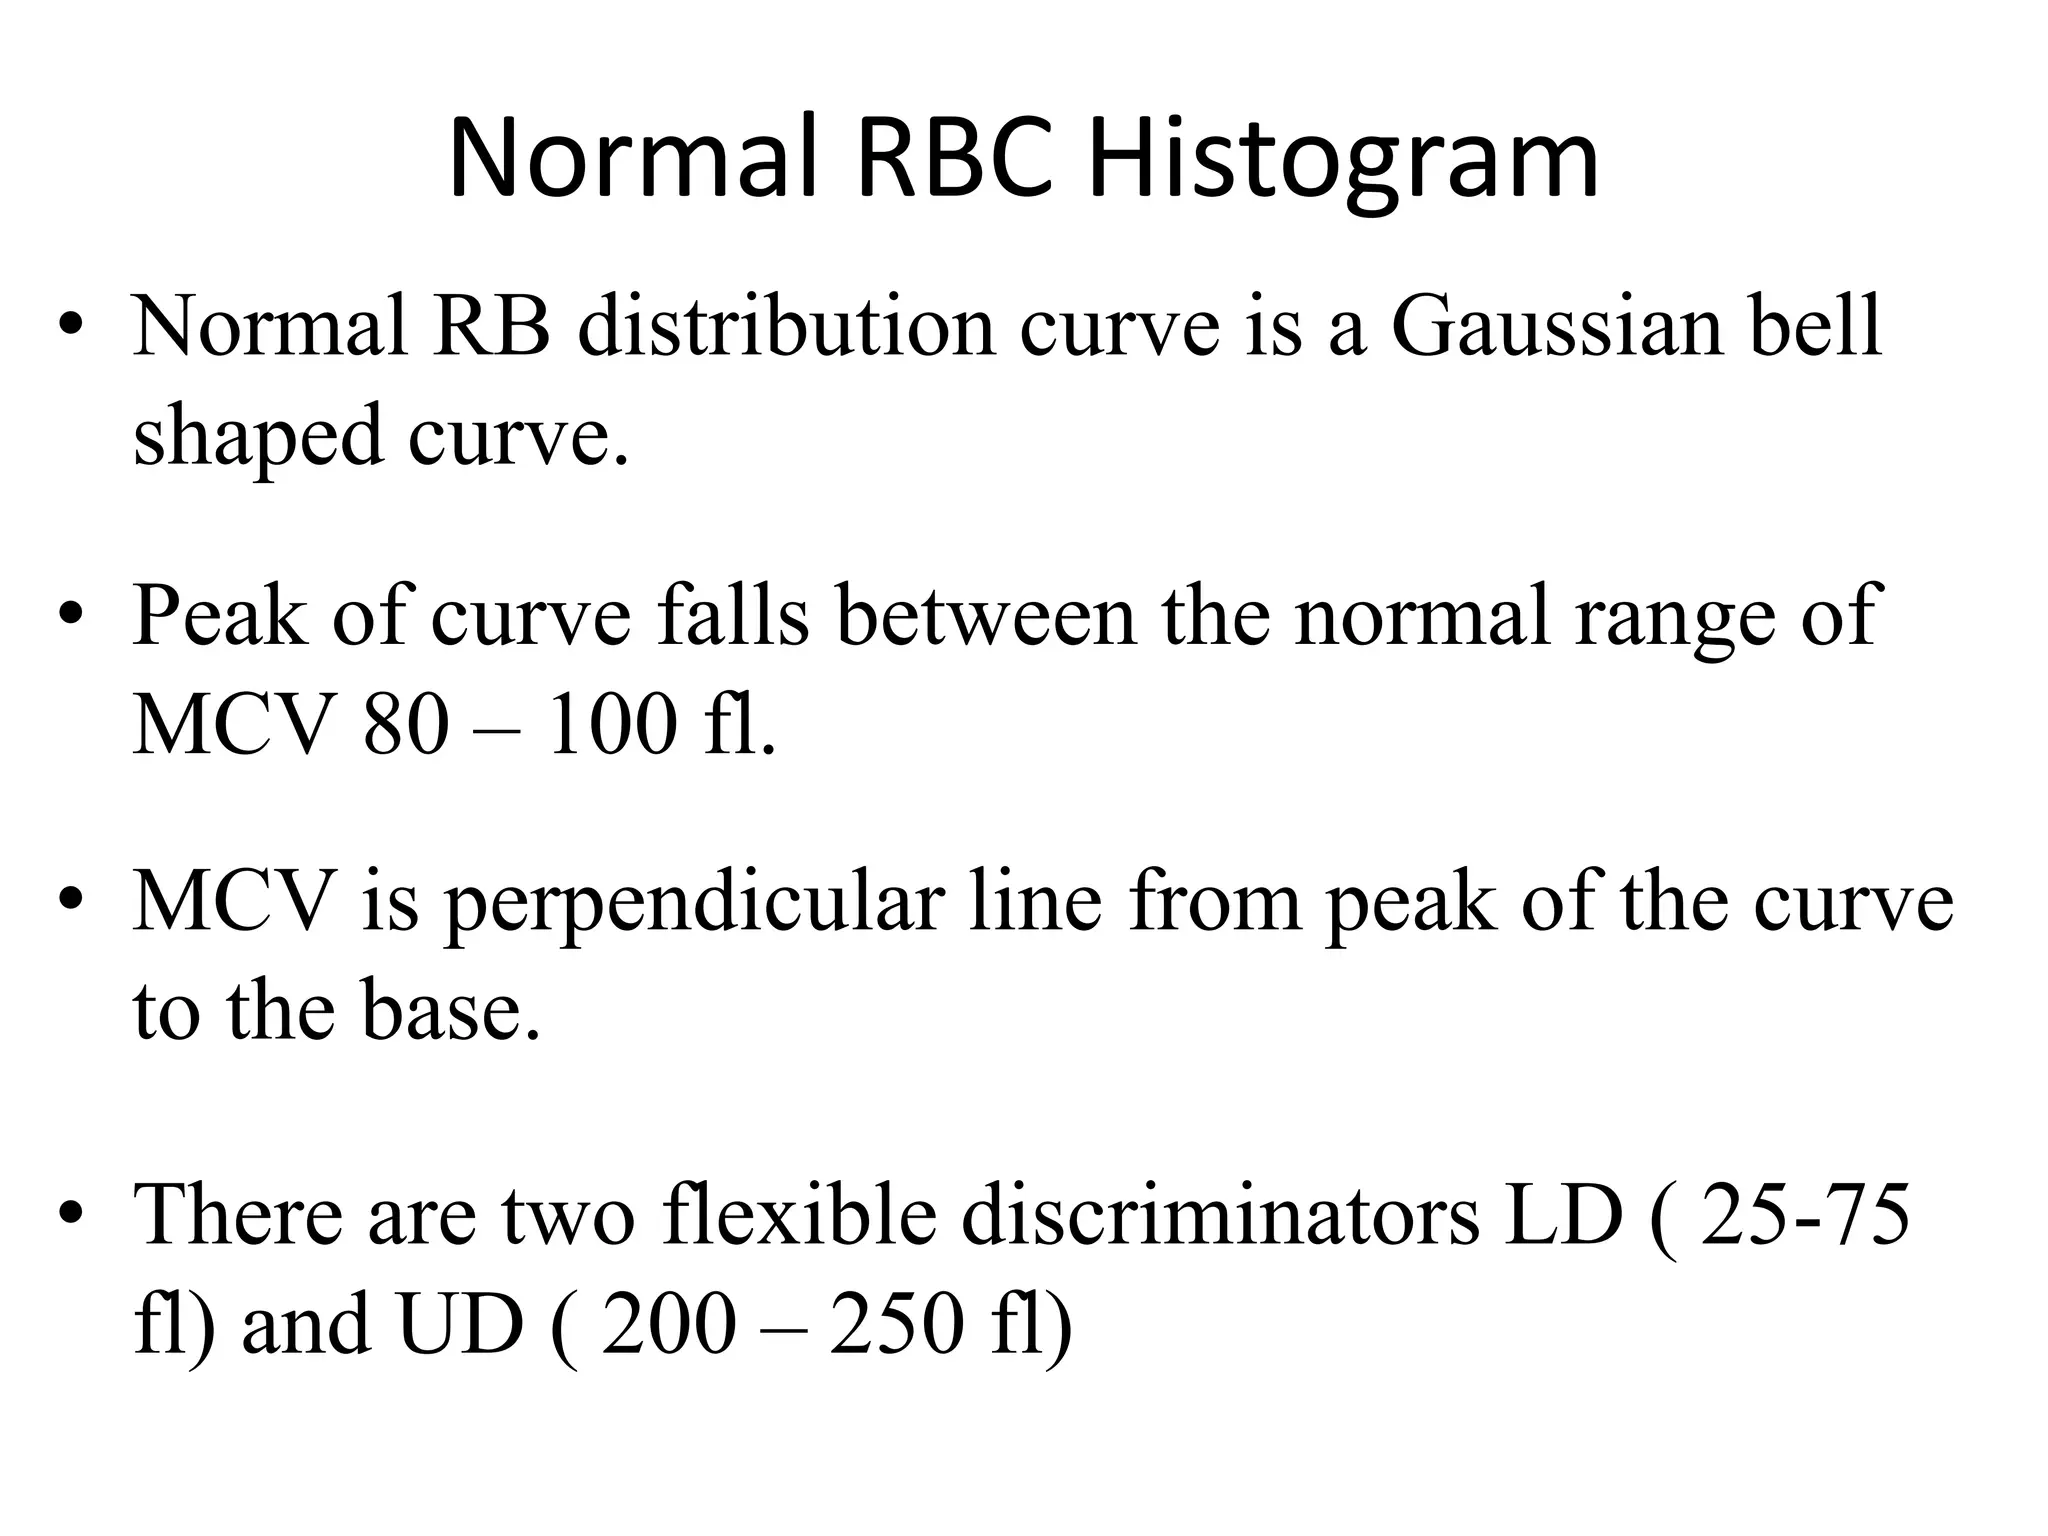
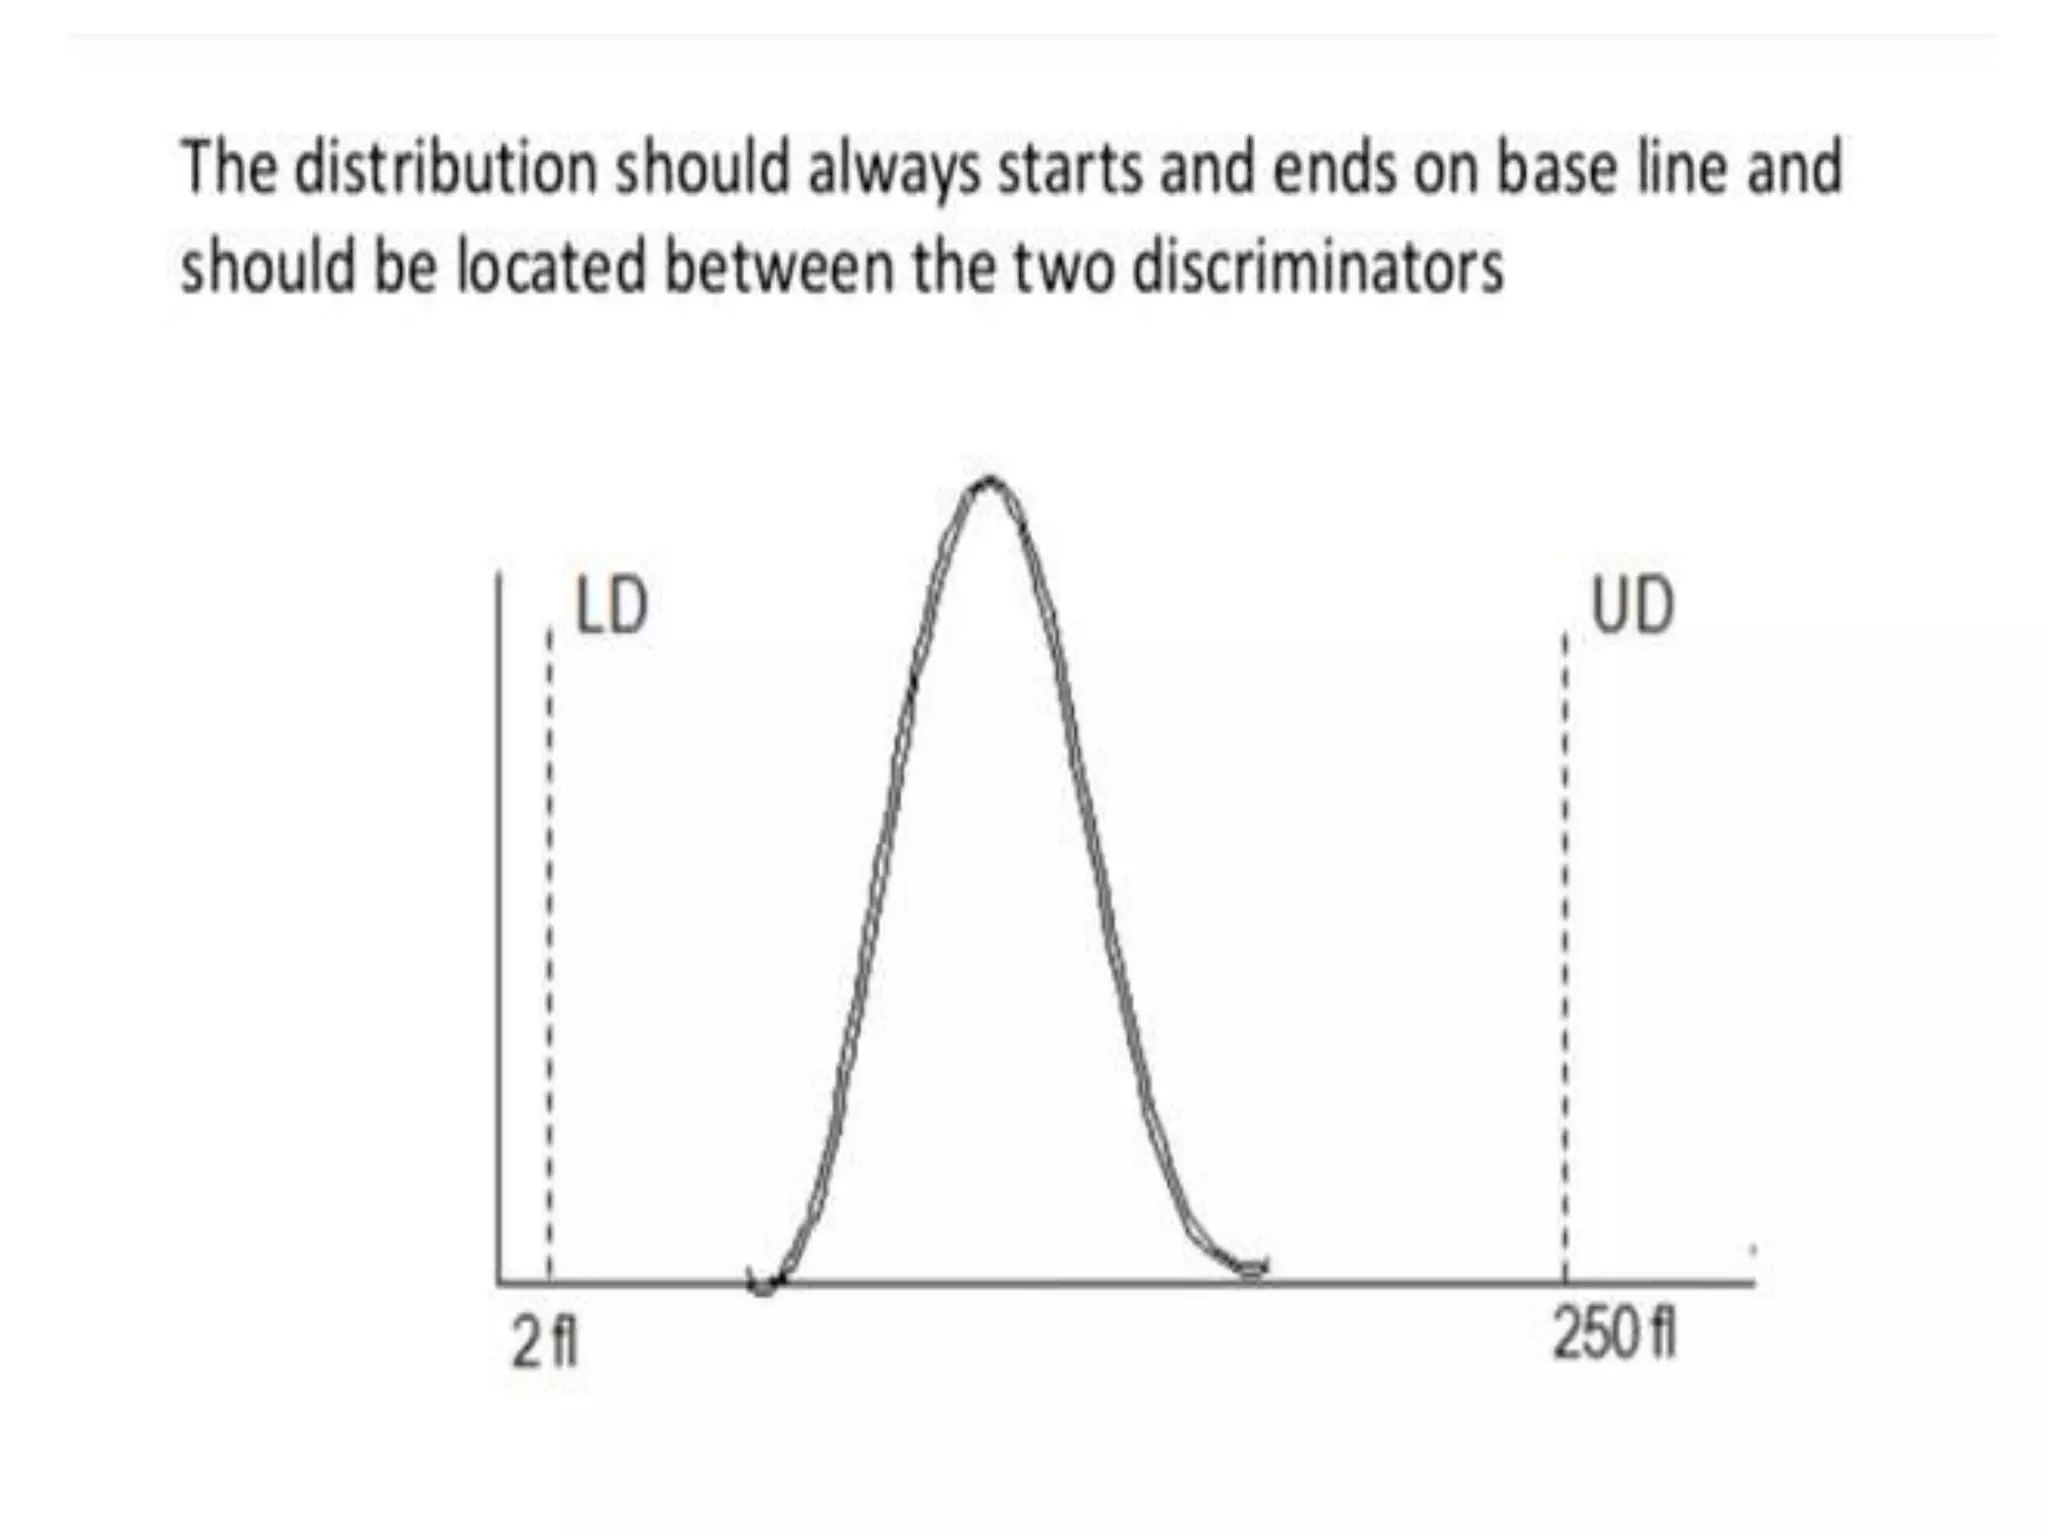
2) A normal red blood cell histogram shows a Gaussian bell-shaped curve with the peak falling within the normal mean corpuscular volume range of 80-100 fL.
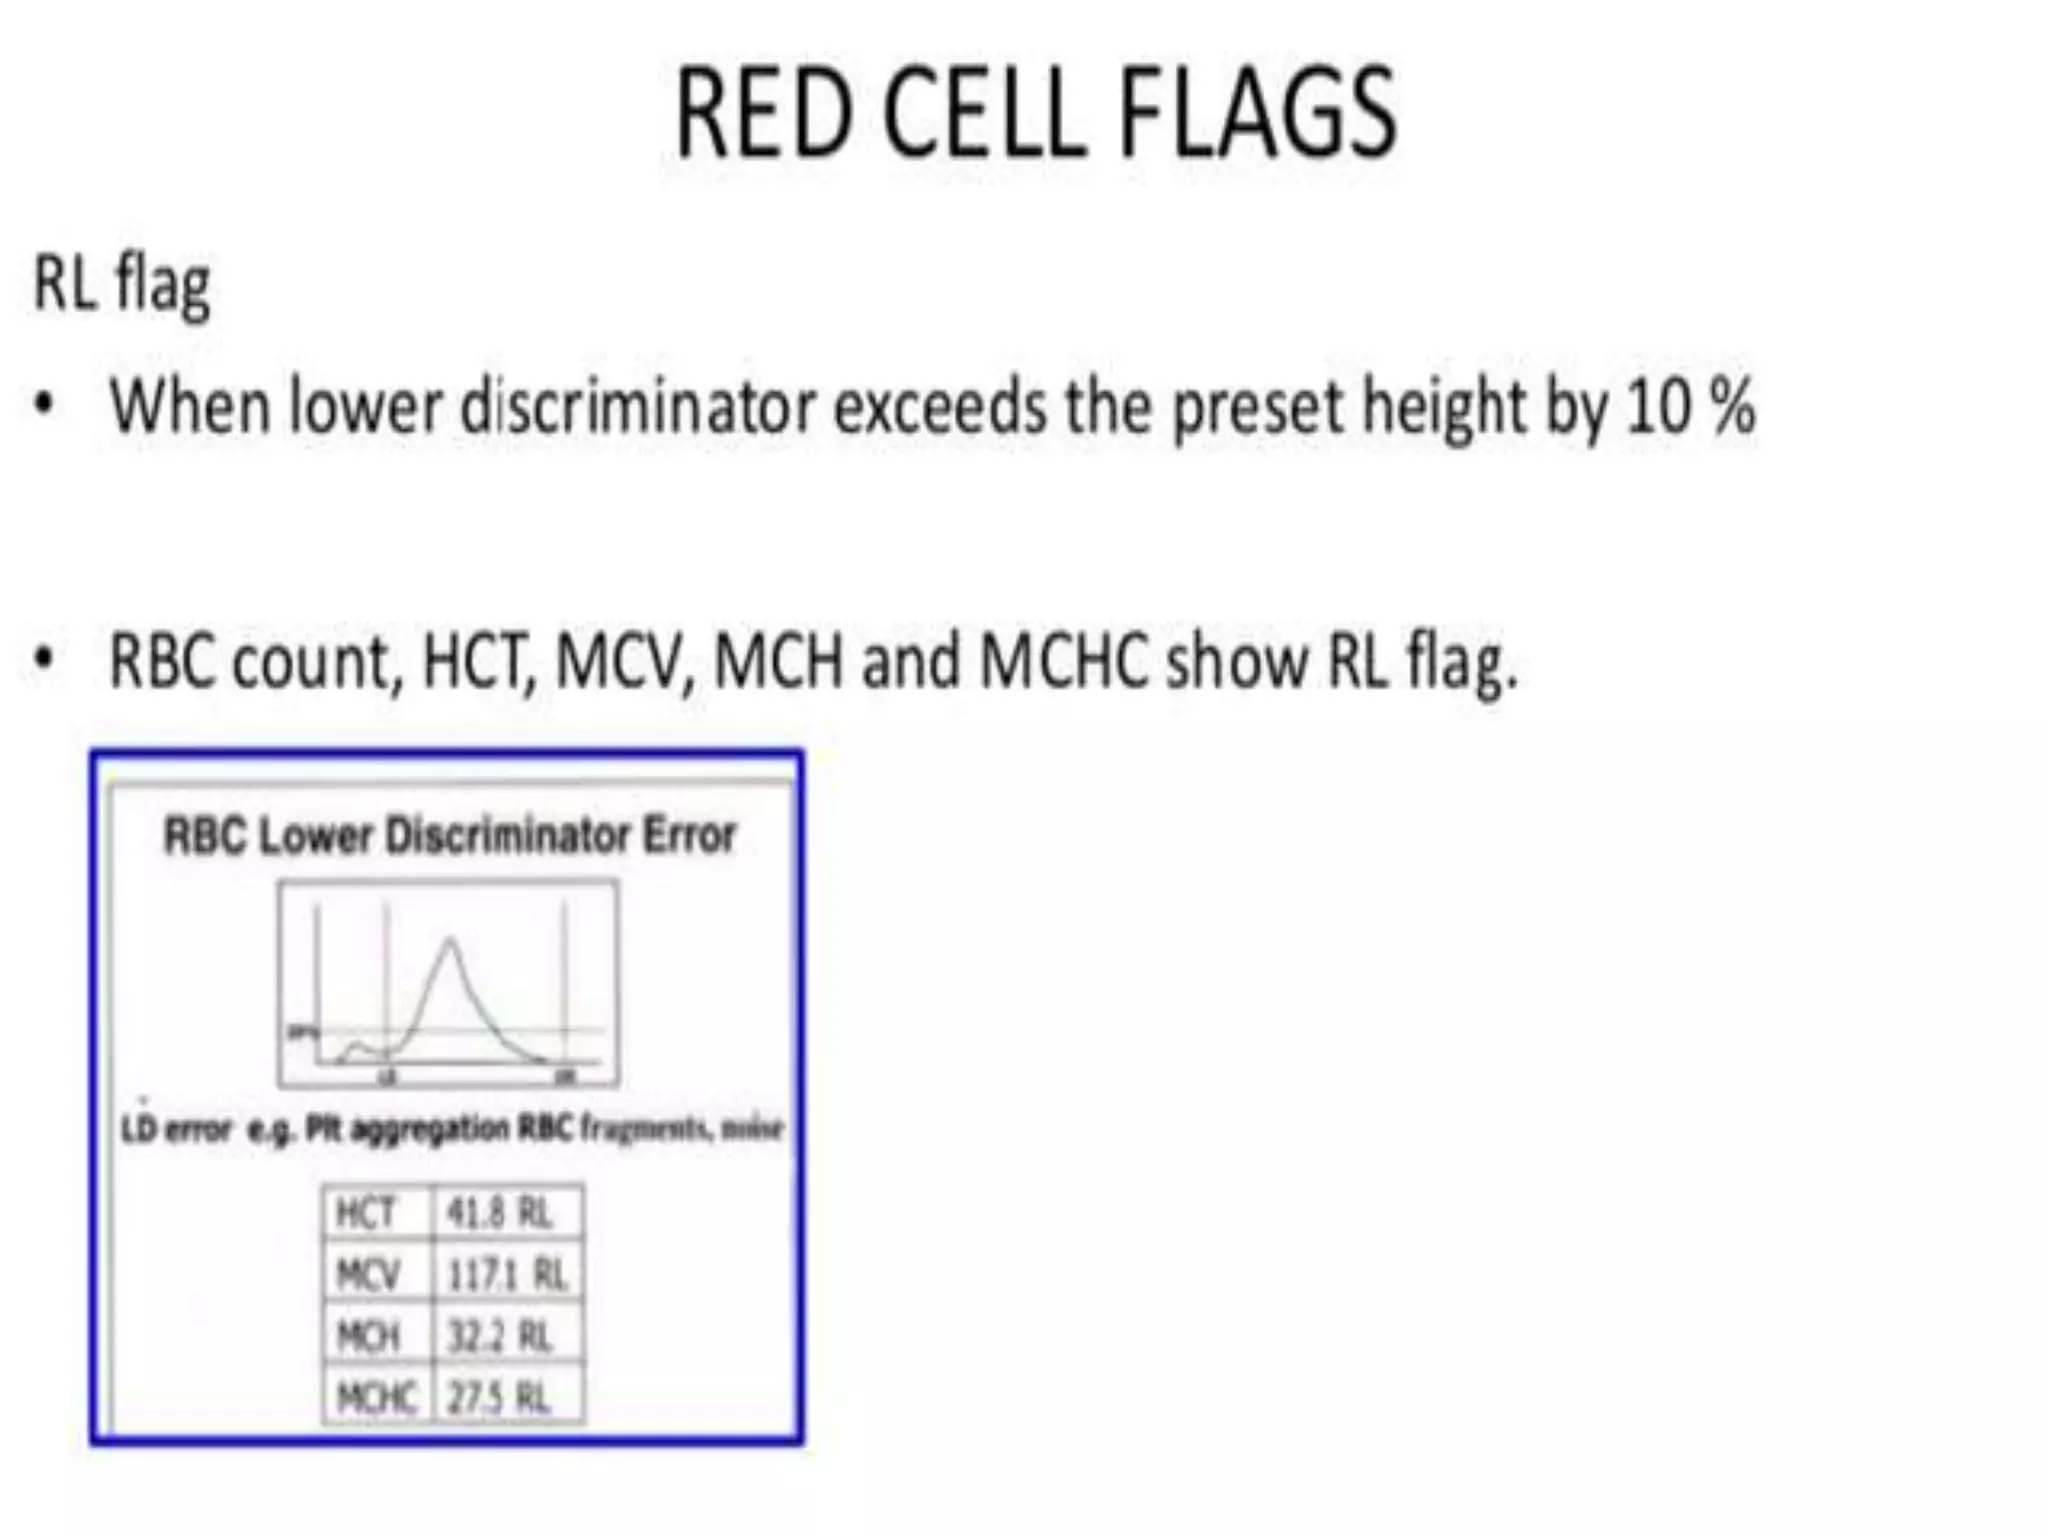
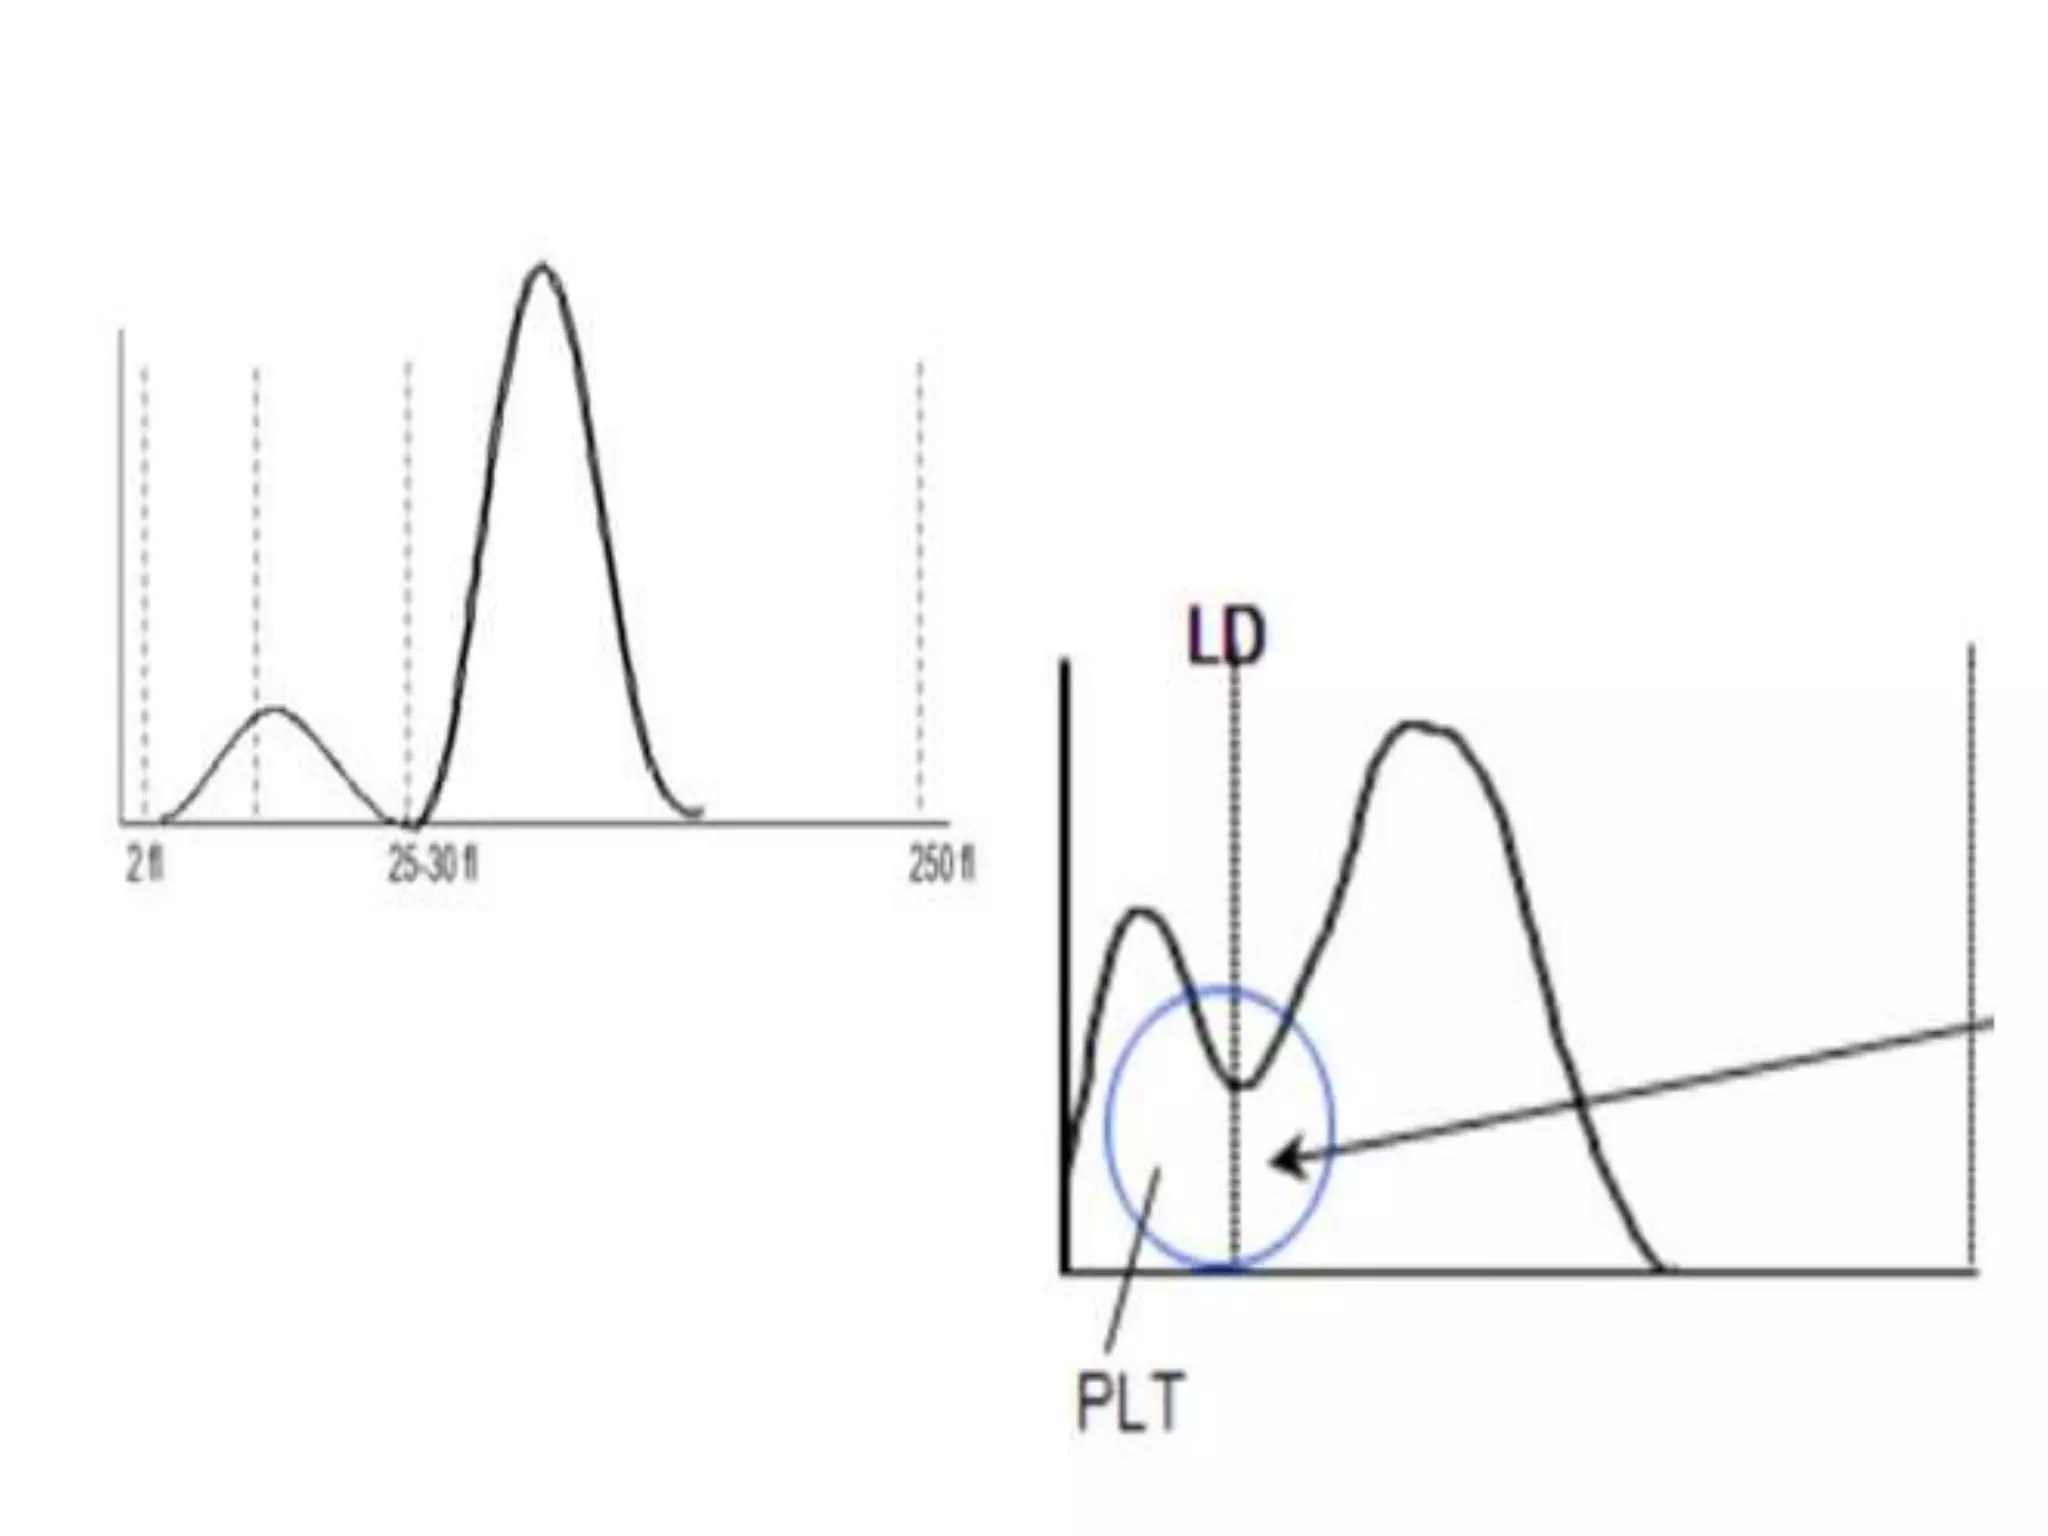
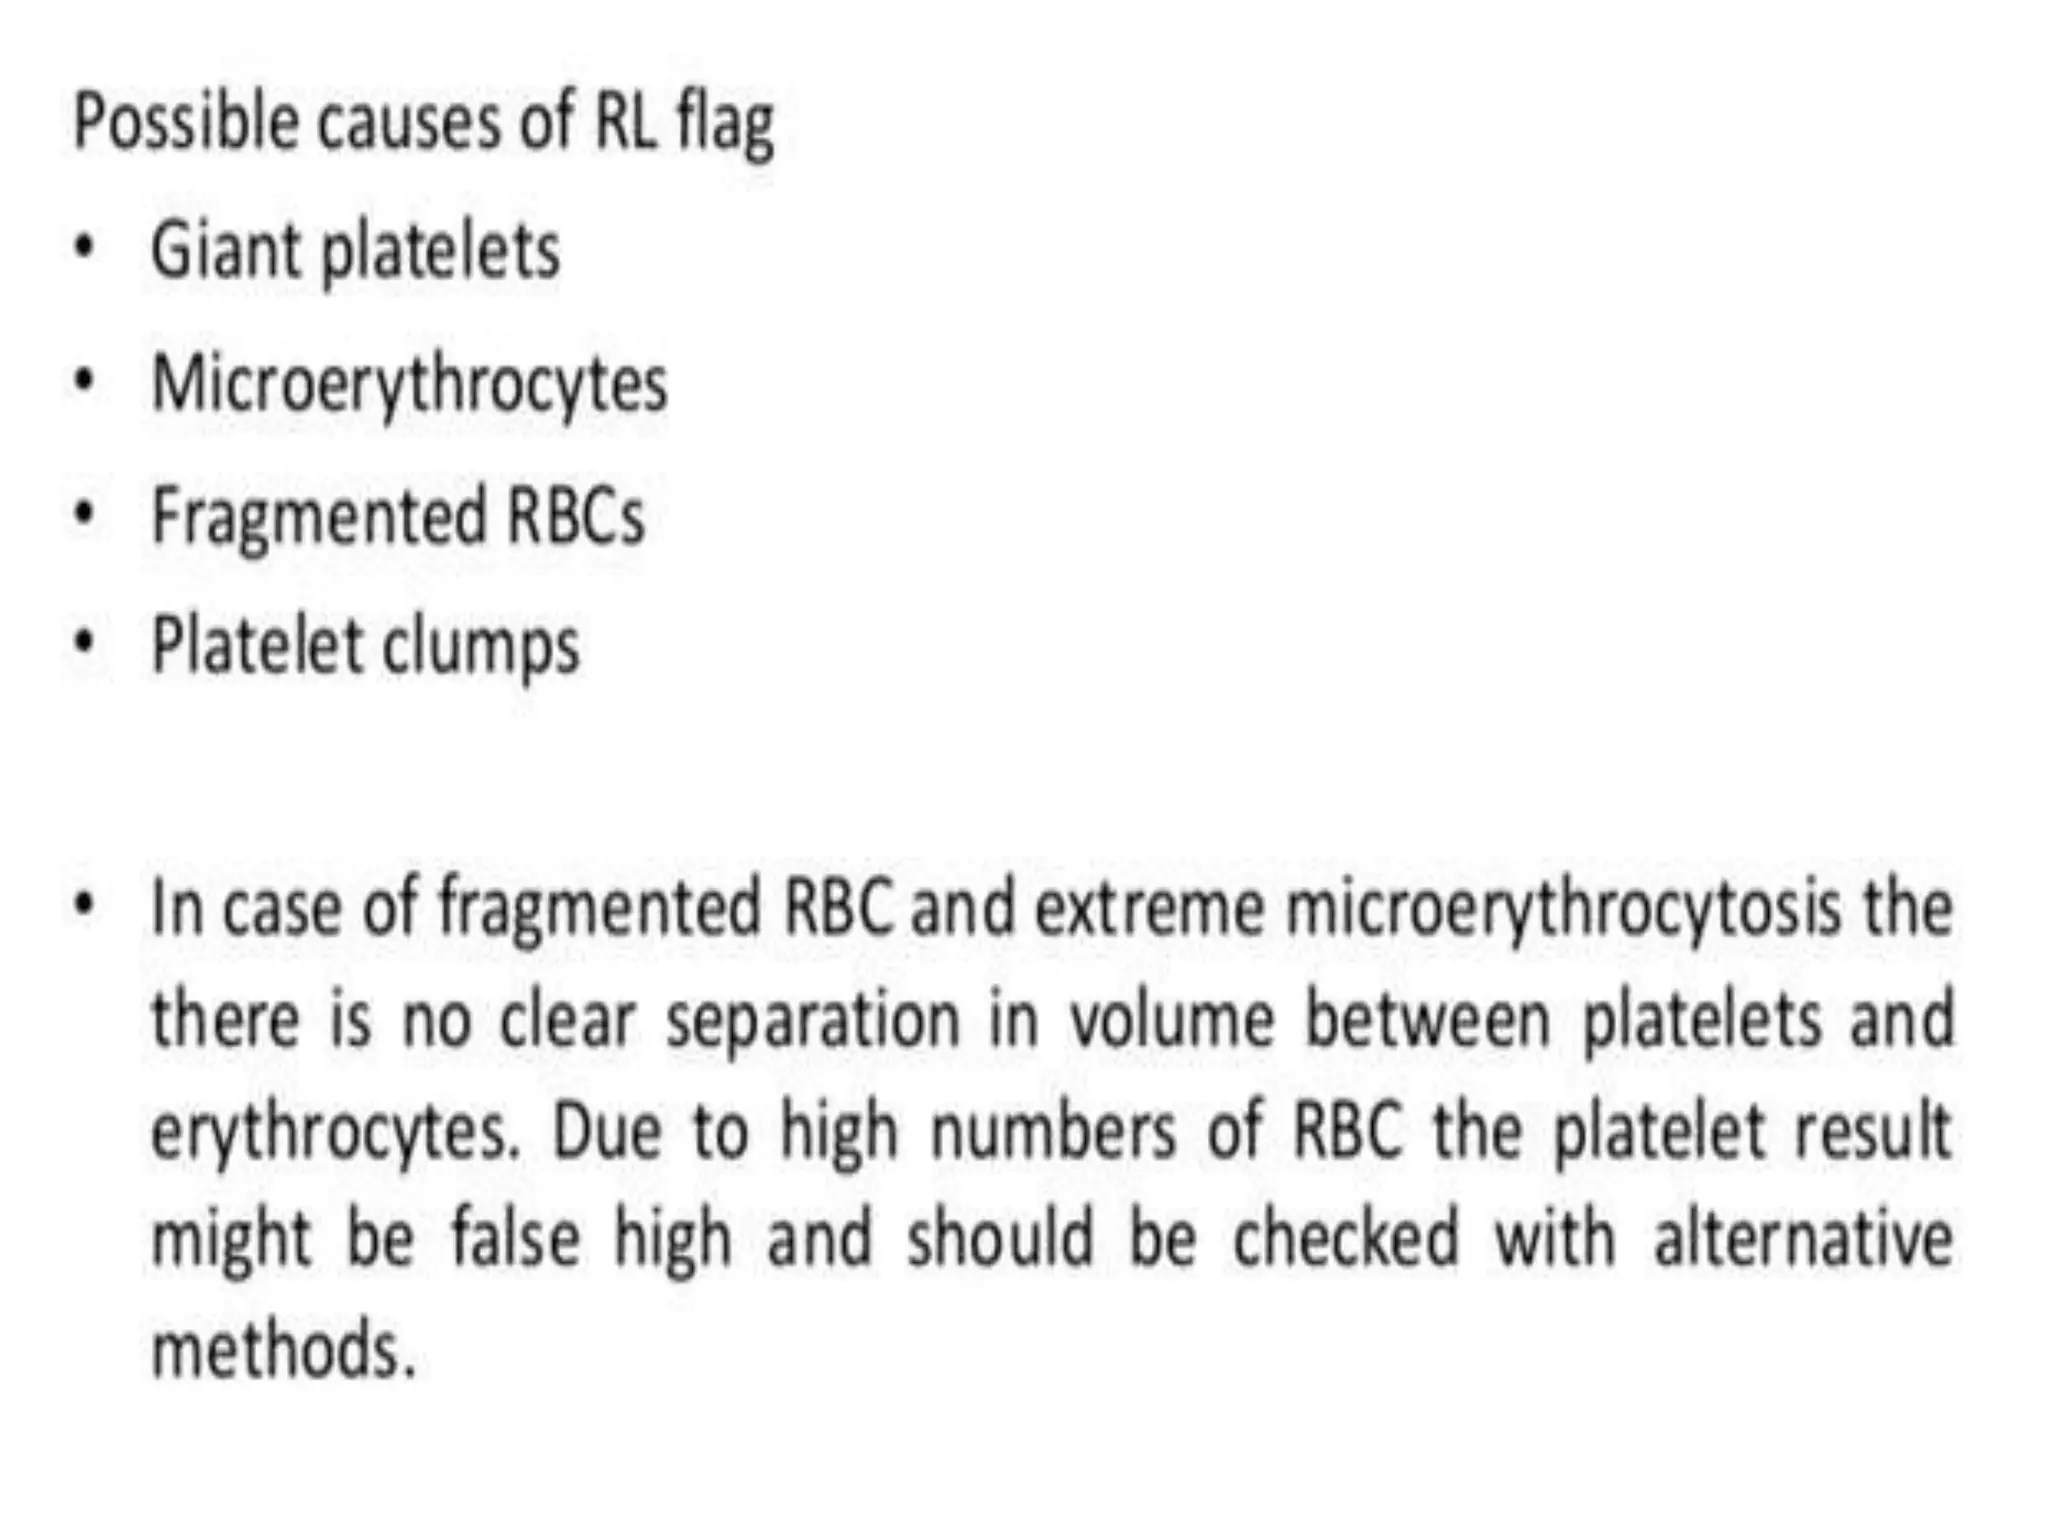
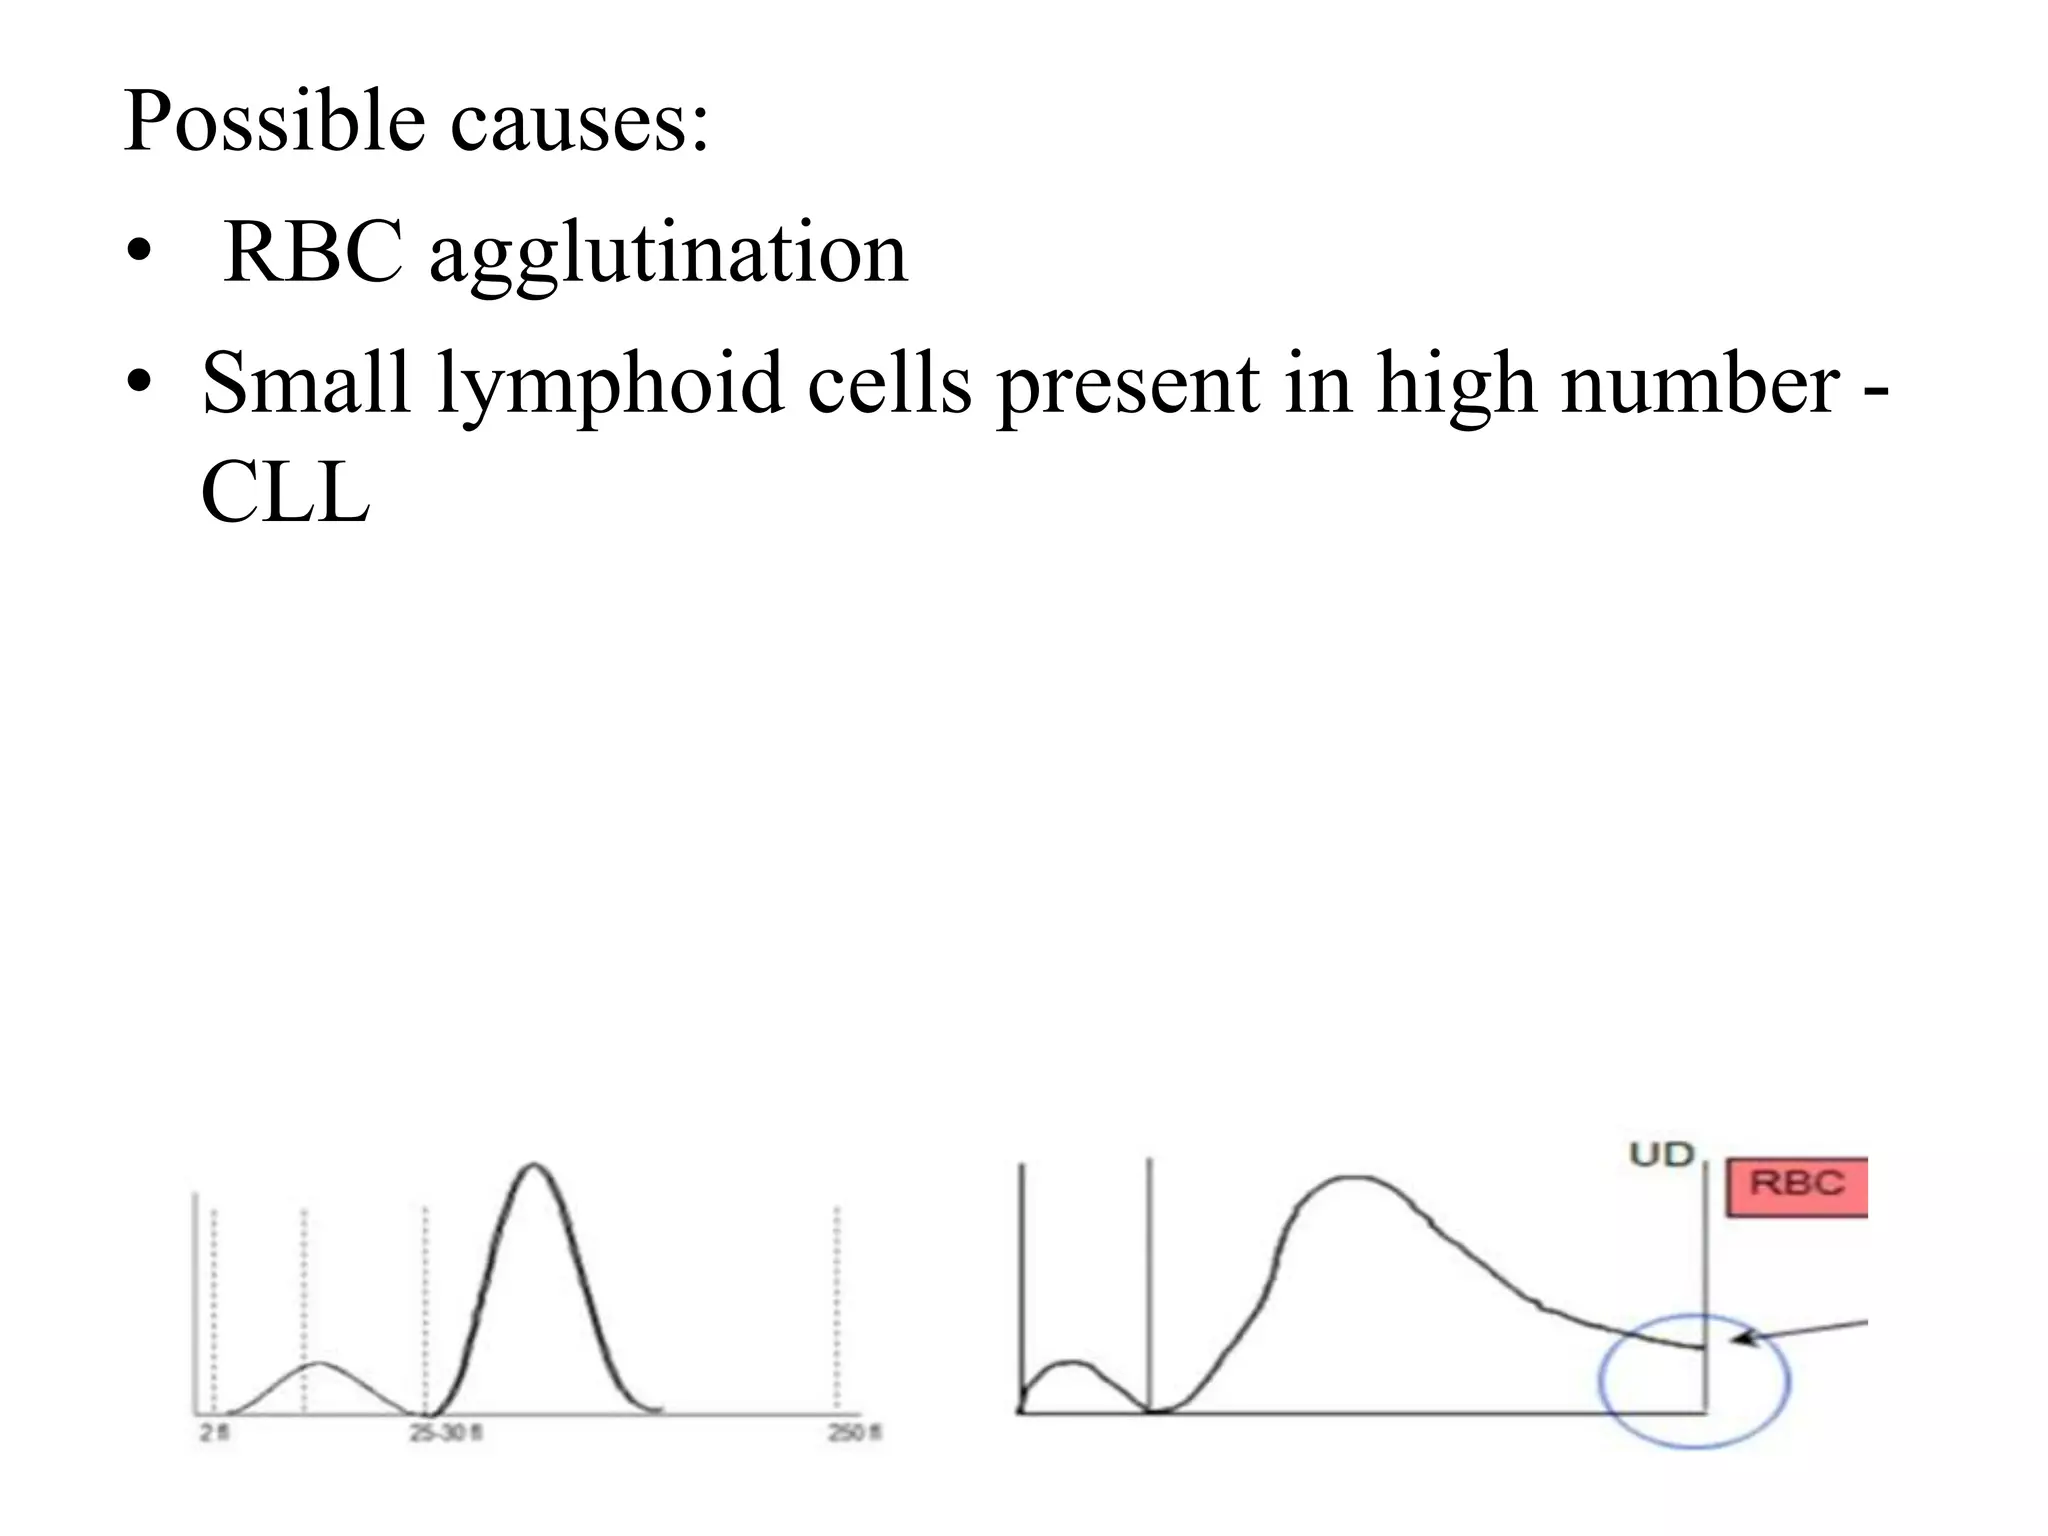
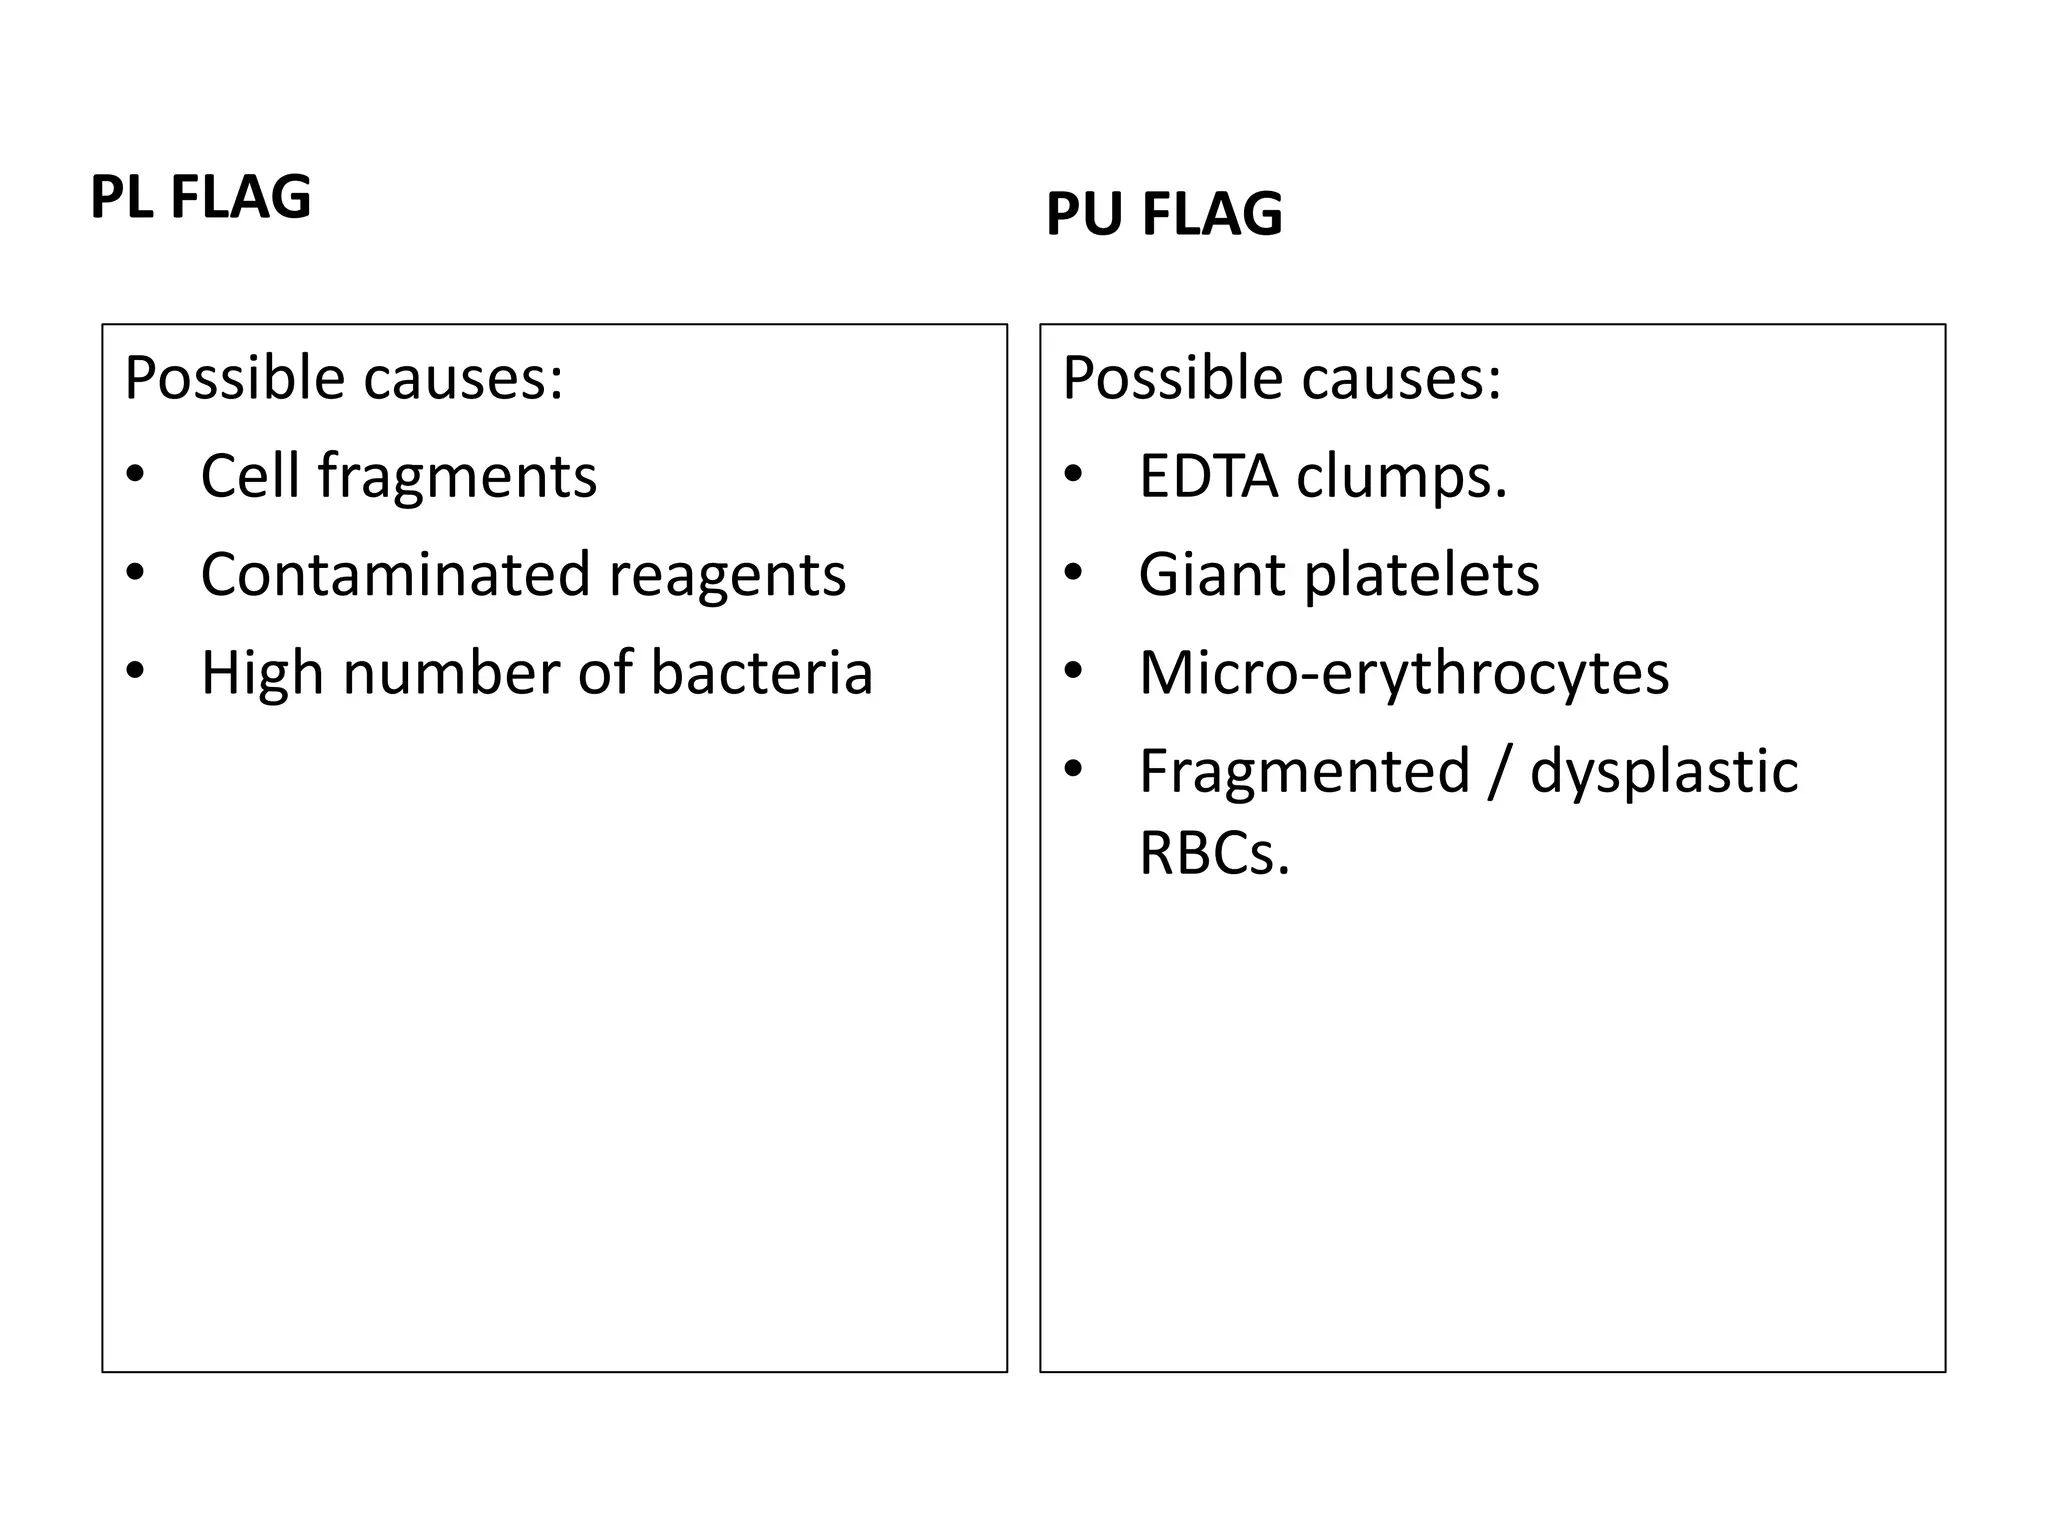
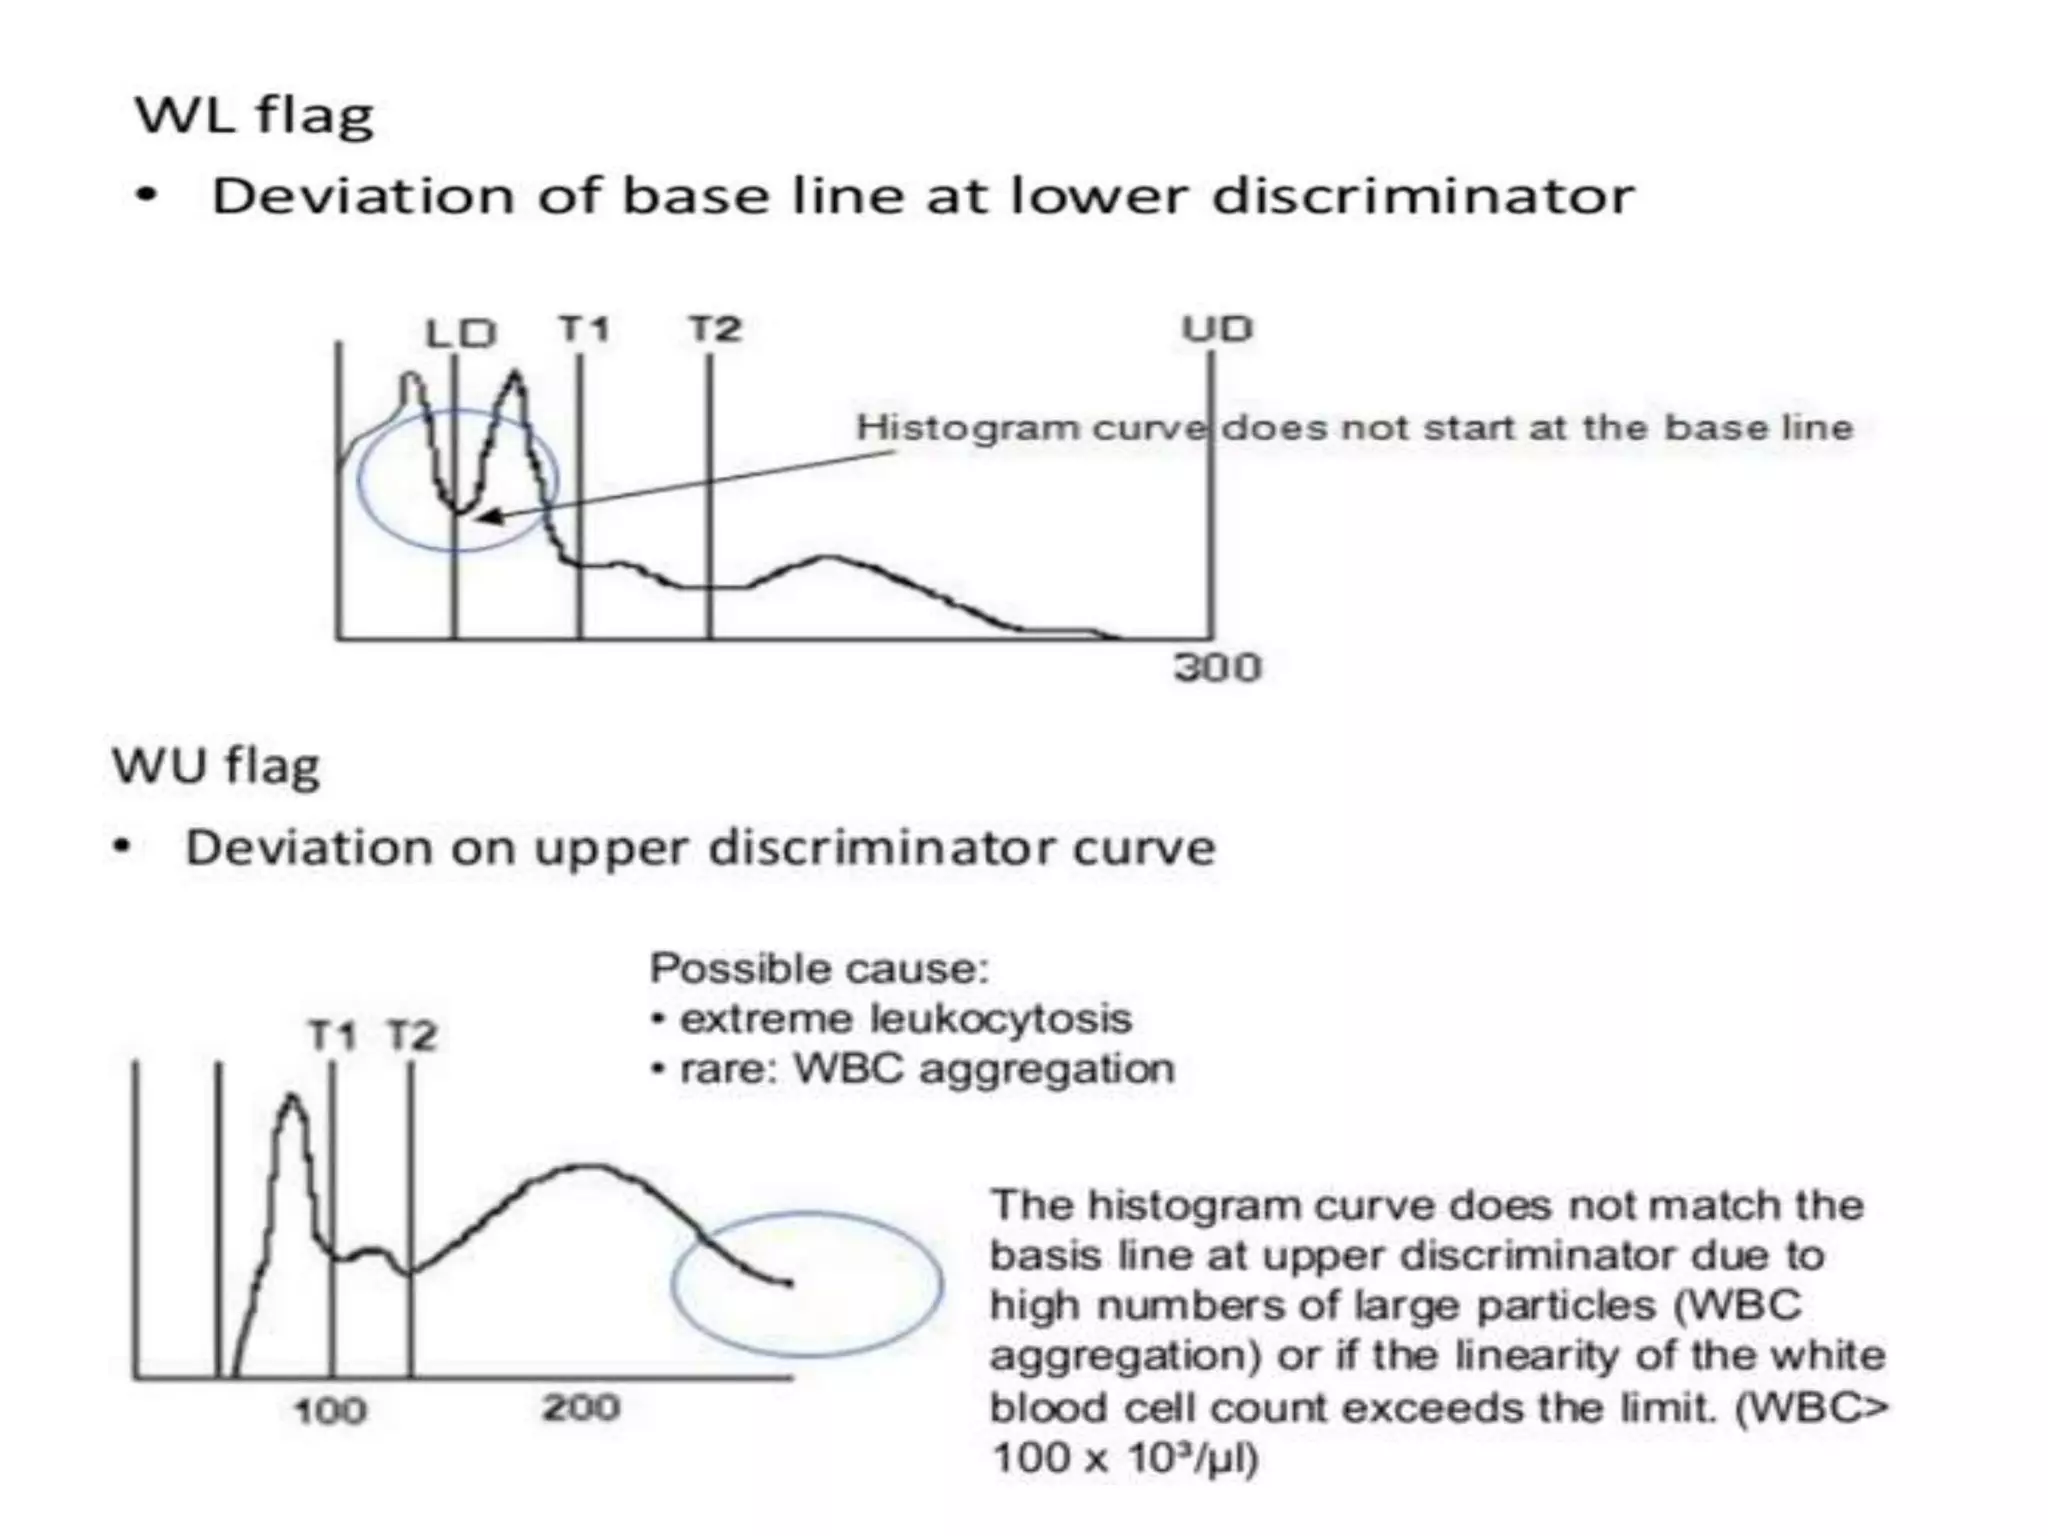
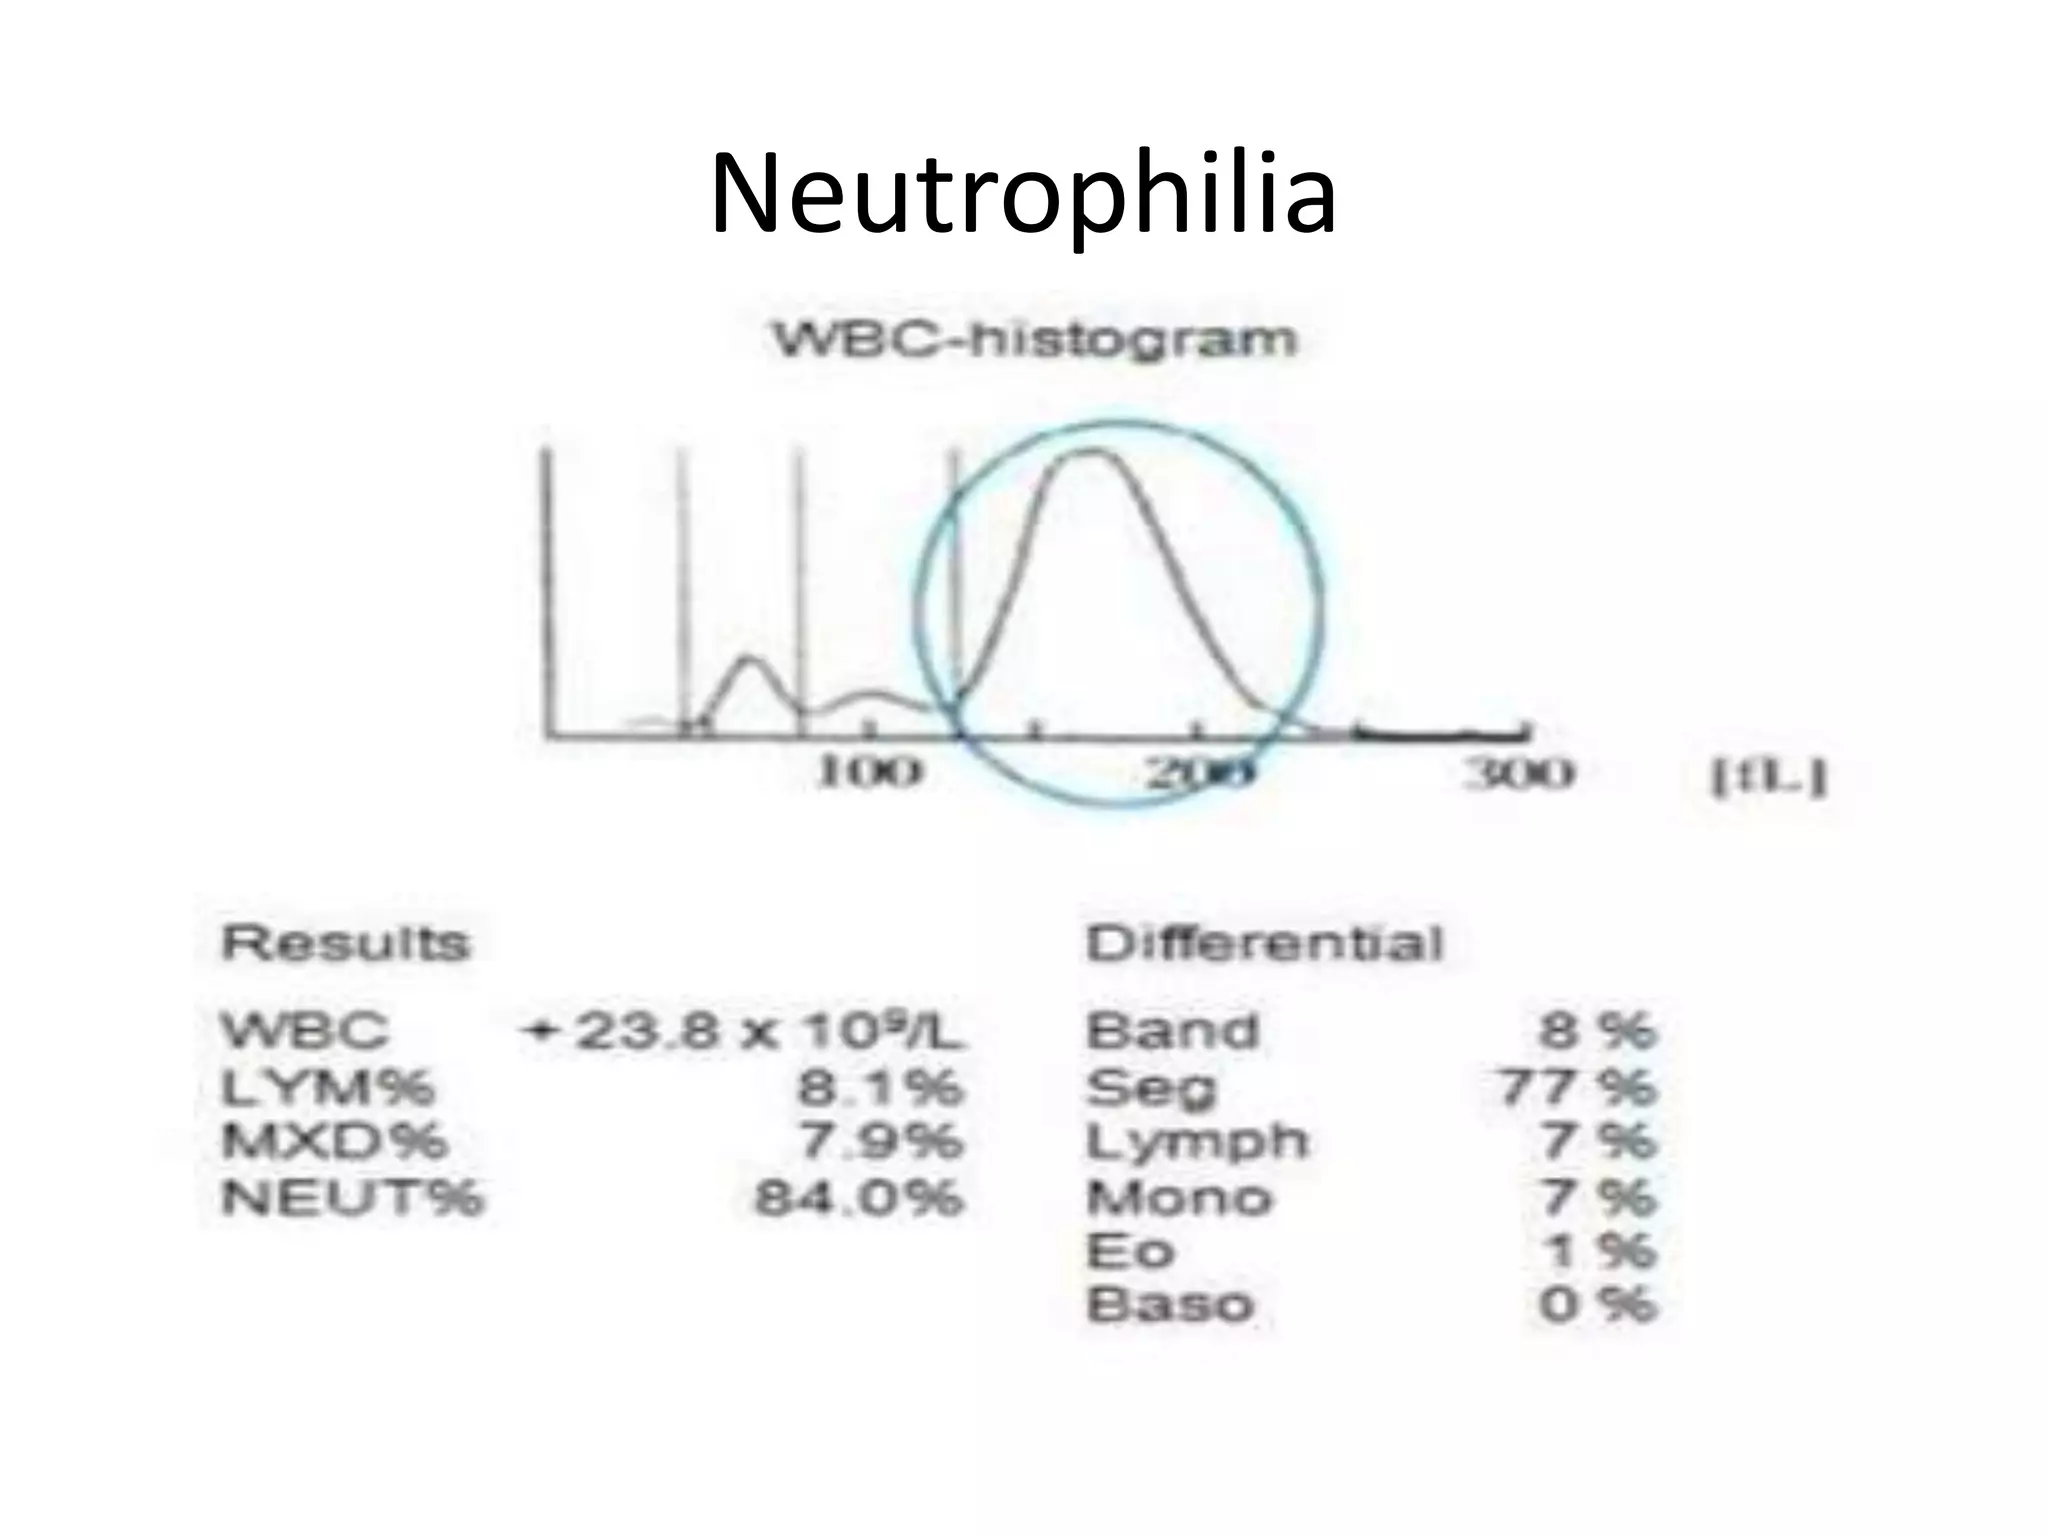
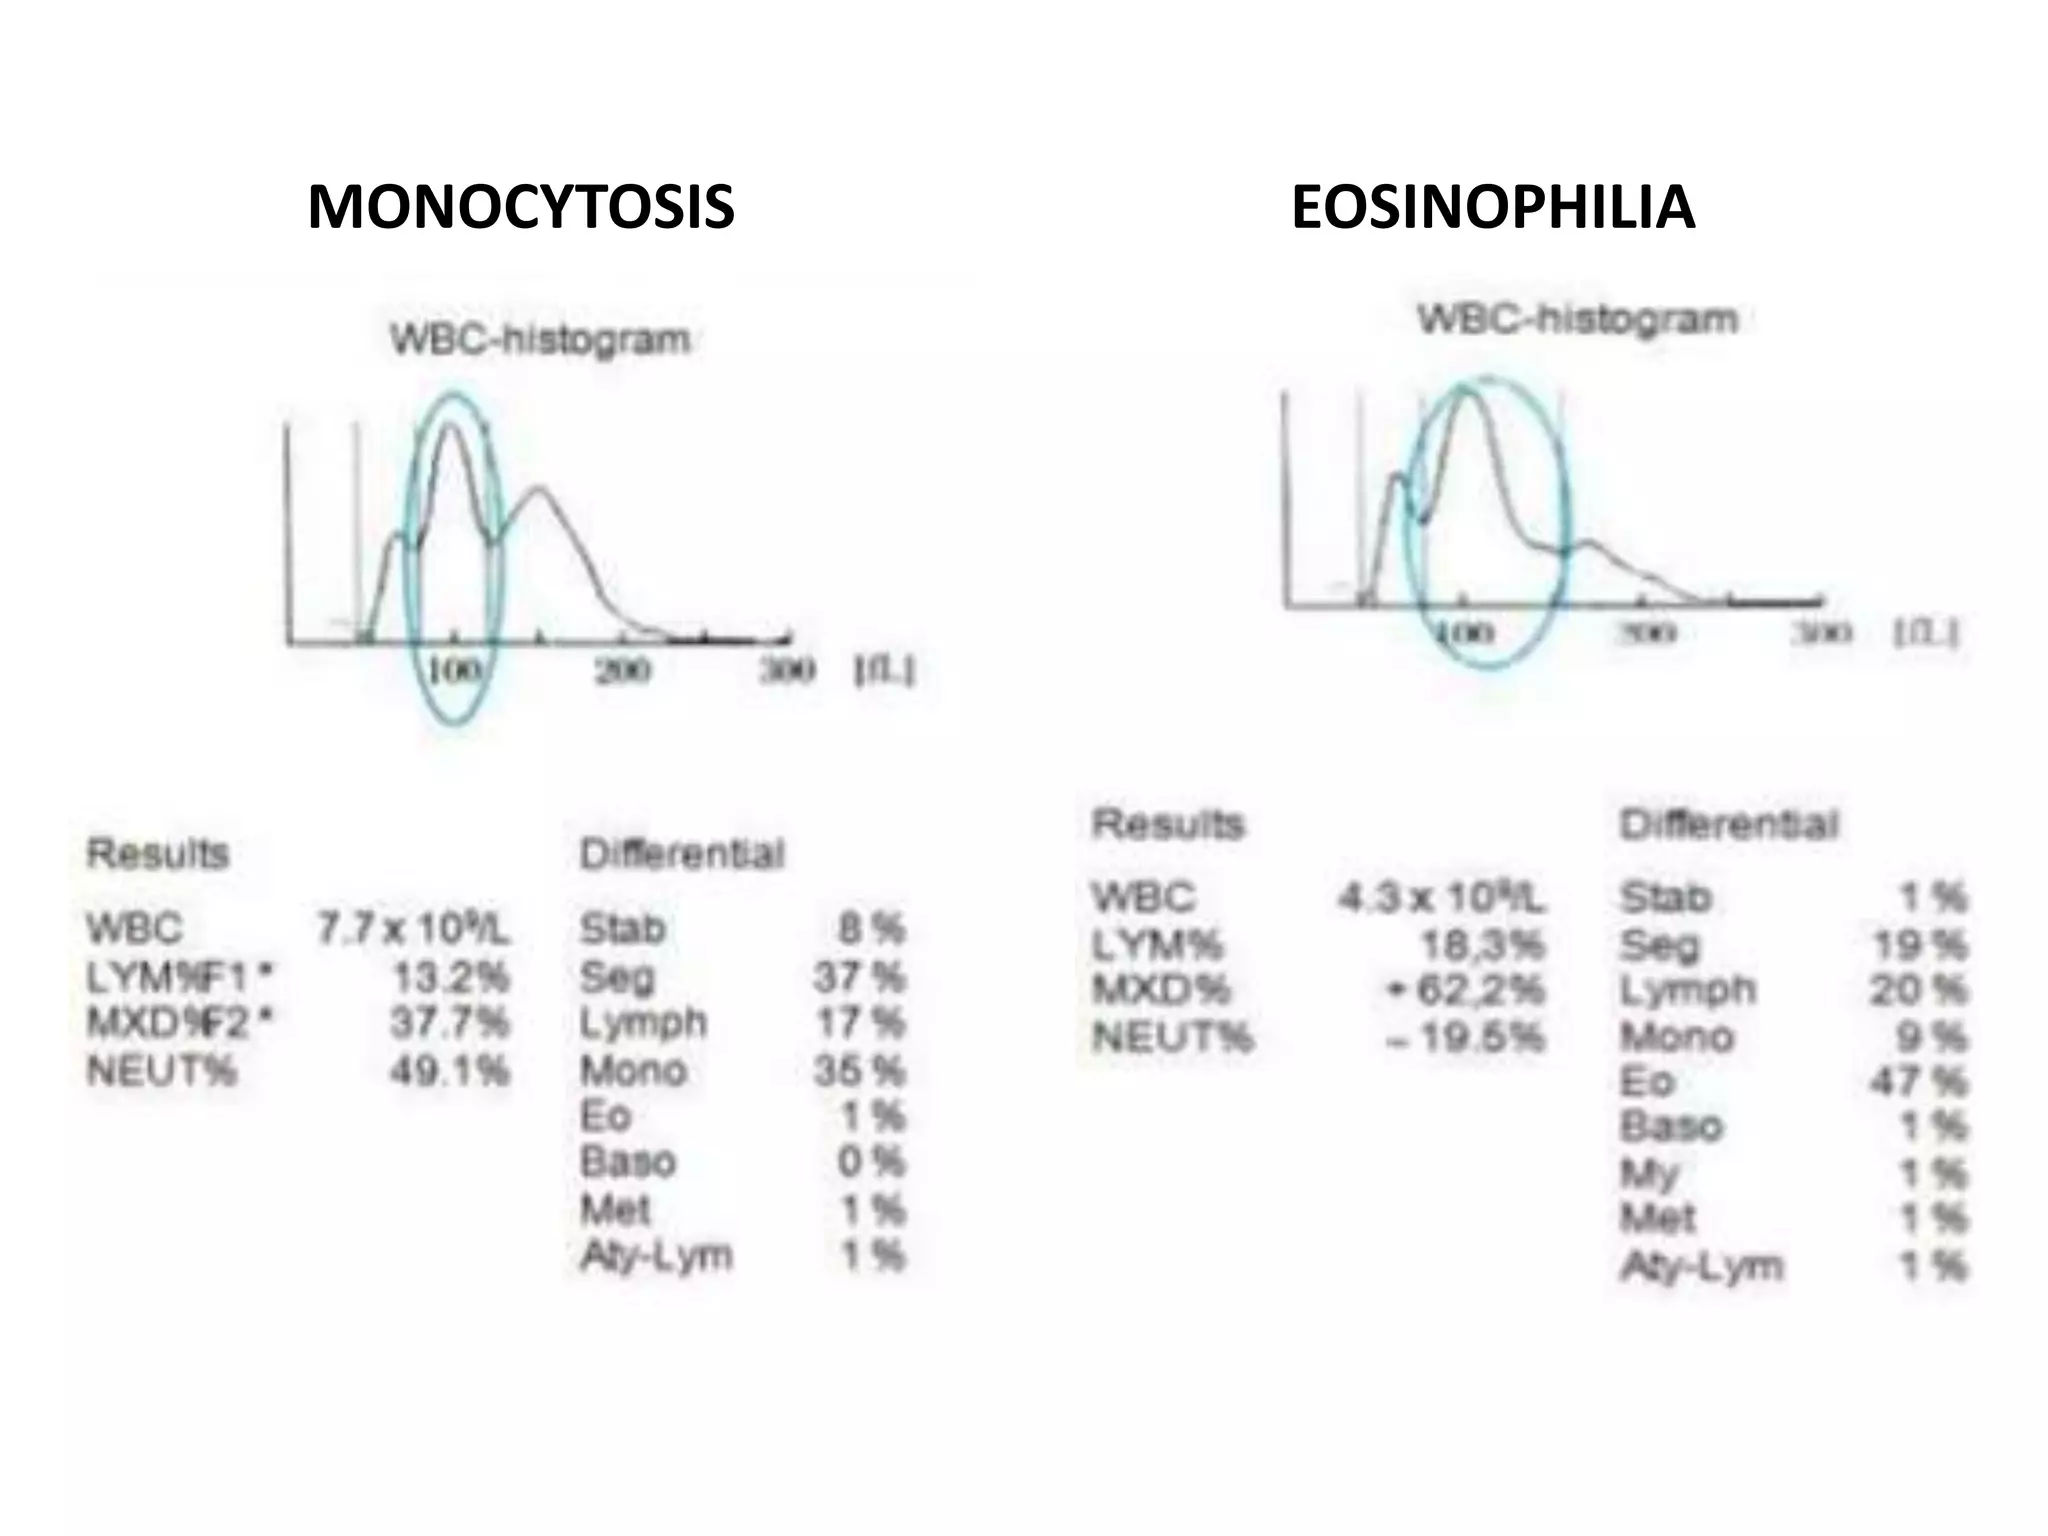
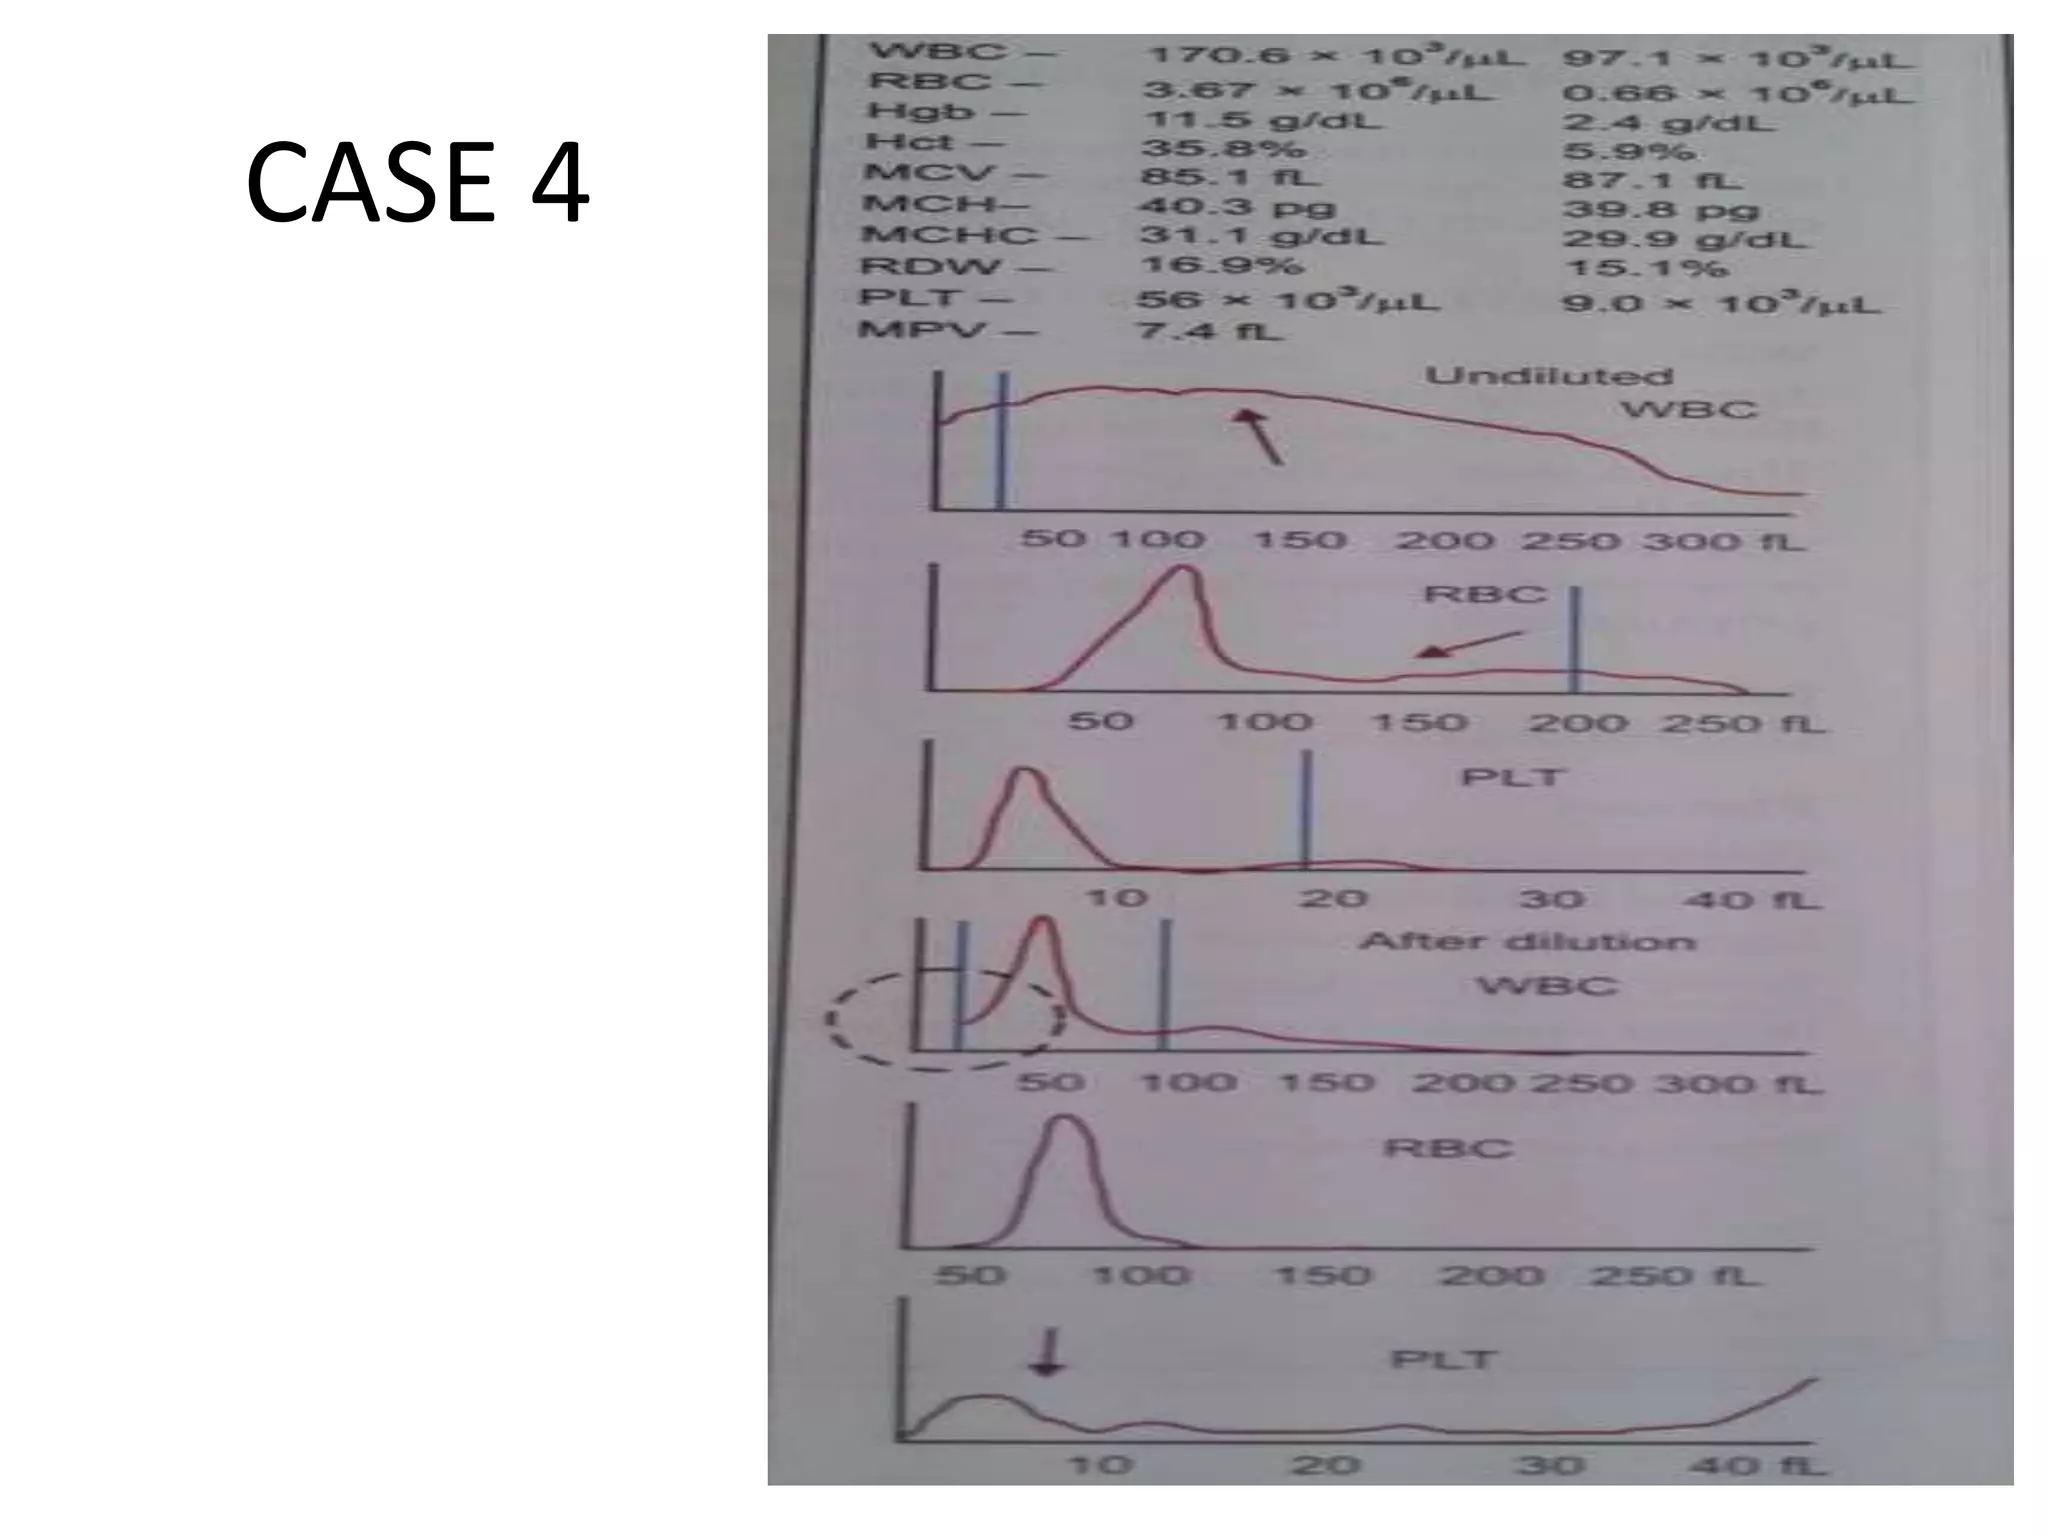
3) Abnormal histograms can reveal conditions like iron deficiency, transfusion, or extreme leukocytosis based on multiple peaks or shifts in the normal distribution. Potential causes for flags are also outlined. Case studies then provide examples of interpreting abnormal histograms.


![Apporach to lung biopsy [Auto-saved].pptx latest](https://cdn.slidesharecdn.com/ss_thumbnails/apporachtolungbiopsyauto-saved-251211225655-93258539-thumbnail.jpg?width=640&height=640&fit=bounds)


