Download as PDF, PPTX


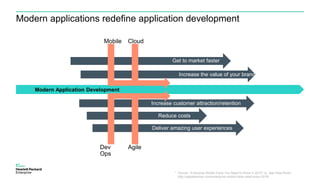
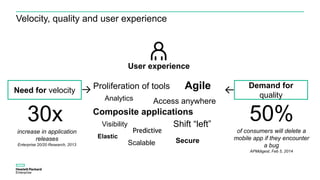
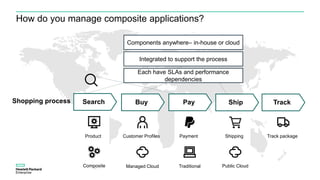

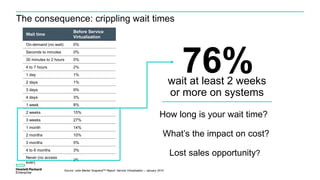
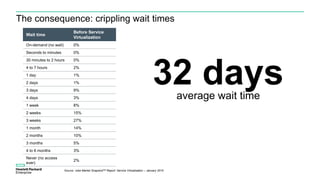

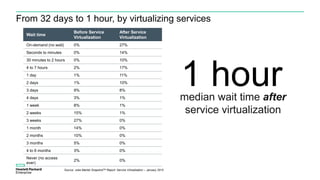
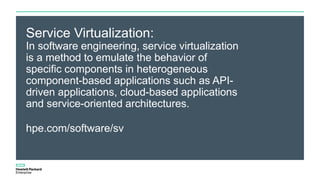

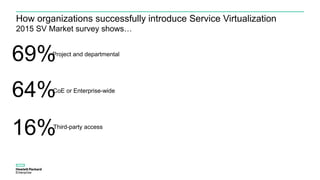

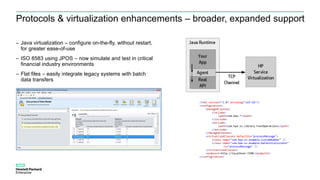
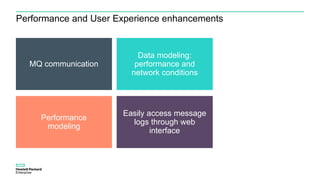
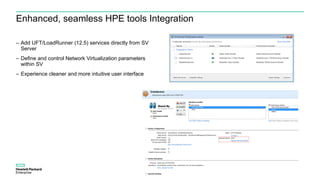

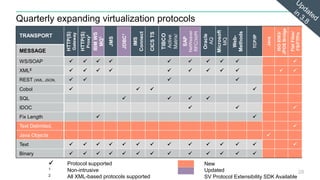

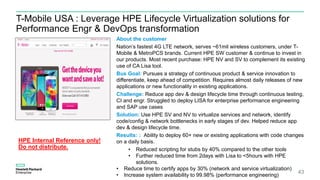

The document discusses HPE Service Virtualization 3.8, highlighting its importance in modern application development and its ability to reduce costs and improve user experiences. It emphasizes the benefits of service virtualization, such as reducing wait times from an average of 32 days to just 1 hour, and provides customer success stories demonstrating its effectiveness. Key features of the latest version include enhanced protocol support, improved performance modeling, and strategies for successful implementation across various organizational departments.


![[Brochure] HPE ALM Octane](https://cdn.slidesharecdn.com/ss_thumbnails/almoctanebrochure-4ac4-160921114742-thumbnail.jpg?width=640&height=640&fit=bounds)


