Download to read offline

![SysEng (S) Pte Ltd
One Stop Shop for Engineering Solutions
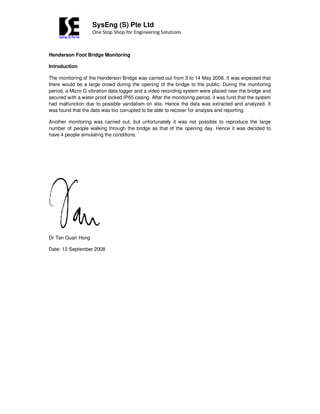
Test 1: 4 persons jumping in Z axis (jumping frequency 0.5 Hz to 0.25 Hz)
Results in the Z Axis
Time [sec]
40
35
30
25
20
15
10
5
0
A
c
c
e
le
r
a
tio
n
[g
]
0.0010
0.0008
0.0006
0.0004
0.0002
0.0000
-0.0002
-0.0004
-0.0006
-0.0008
-0.0010
Time [sec]
40
35
30
25
20
15
10
5
0
Displacement
[cm]
0.08
0.07
0.06
0.05
0.04
0.03
0.02
0.01
0
-0.01
-0.02
-0.03
-0.04
-0.05
-0.06
-0.07
-0.08
Frequency [Hz]
80
70
60
50
40
30
20
10
Fourier
Amplitude
0.00020
0.00018
0.00016
0.00014
0.00012
0.00010
0.00008
0.00006
0.00004
0.00002
0.00000
The acceleration peak frequency is 1.613 Hz for the bridge. Those above 10Hz are the impact forces](https://image.slidesharecdn.com/hendersonbridgereport-230621102806-a3533288/85/Henderson-Bridge-Report-pdf-3-320.jpg)
![SysEng (S) Pte Ltd
One Stop Shop for Engineering Solutions
Results in the X Axis:
Time [sec]
40
35
30
25
20
15
10
5
0
Ac
c
e
le
ra
tion
[g]
0.0010
0.0008
0.0006
0.0004
0.0002
0.0000
-0.0002
-0.0004
-0.0006
-0.0008
-0.0010
Time [sec]
40
35
30
25
20
15
10
5
0
Displacement
[cm]
0.08
0.07
0.06
0.05
0.04
0.03
0.02
0.01
0
-0.01
-0.02
-0.03
-0.04
-0.05
-0.06
-0.07
-0.08
Frequency [Hz]
80
70
60
50
40
30
20
10
Fourier
Amplitude
0.00020
0.00018
0.00016
0.00014
0.00012
0.00010
0.00008
0.00006
0.00004
0.00002
0.00000
X axis Minimum Value 1 Hz, Peak Acceleration for below 10Hz is 1.613 Hz](https://image.slidesharecdn.com/hendersonbridgereport-230621102806-a3533288/85/Henderson-Bridge-Report-pdf-4-320.jpg)

![SysEng (S) Pte Ltd
One Stop Shop for Engineering Solutions
Test 2: 4 persons walking (about 1 to 2 Hz excitation)
Results in the Z axis:
Time [sec]
150
140
130
120
110
100
90
80
70
60
50
40
30
20
10
0
Acceleration
[g]
0.0010
0.0008
0.0006
0.0004
0.0002
0.0000
-0.0002
-0.0004
-0.0006
-0.0008
-0.0010
Time [sec]
150
140
130
120
110
100
90
80
70
60
50
40
30
20
10
0
Displacement
[cm]
0.08
0.07
0.06
0.05
0.04
0.03
0.02
0.01
0
-0.01
-0.02
-0.03
-0.04
-0.05
-0.06
-0.07
-0.08
Frequency [Hz]
80
70
60
50
40
30
20
10
Fourier
Amplitude
0.00020
0.00018
0.00016
0.00014
0.00012
0.00010
0.00008
0.00006
0.00004
0.00002
0.00000
The acceleration peak frequency is 1.613 Hz for the bridge. Those above 10Hz are the impact forces](https://image.slidesharecdn.com/hendersonbridgereport-230621102806-a3533288/85/Henderson-Bridge-Report-pdf-6-320.jpg)
![SysEng (S) Pte Ltd
One Stop Shop for Engineering Solutions
Results in the X axis:
Time [sec]
150
140
130
120
110
100
90
80
70
60
50
40
30
20
10
0
Acceleration
[g]
0.0010
0.0008
0.0006
0.0004
0.0002
0.0000
-0.0002
-0.0004
-0.0006
-0.0008
-0.0010
Time [sec]
150
140
130
120
110
100
90
80
70
60
50
40
30
20
10
0
Displacement
[cm]
0.08
0.07
0.06
0.05
0.04
0.03
0.02
0.01
0
-0.01
-0.02
-0.03
-0.04
-0.05
-0.06
-0.07
-0.08
Frequency [Hz]
80
70
60
50
40
30
20
10
Fourier
Amplitude
0.00020
0.00018
0.00016
0.00014
0.00012
0.00010
0.00008
0.00006
0.00004
0.00002
0.00000
X axis Minimum Value 1 Hz, Peak Acceleration for below 10Hz is 1.613 Hz](https://image.slidesharecdn.com/hendersonbridgereport-230621102806-a3533288/85/Henderson-Bridge-Report-pdf-7-320.jpg)

![SysEng (S) Pte Ltd
One Stop Shop for Engineering Solutions
Test 3: Visitors jogging through the bridge (a little wind is present)
Results in the Z axis
Time [sec]
150
140
130
120
110
100
90
80
70
60
50
40
30
20
10
0
Acceleration
[g]
0.0010
0.0008
0.0006
0.0004
0.0002
0.0000
-0.0002
-0.0004
-0.0006
-0.0008
-0.0010
Time [sec]
150
140
130
120
110
100
90
80
70
60
50
40
30
20
10
0
Displacement
[cm]
0.08
0.07
0.06
0.05
0.04
0.03
0.02
0.01
0
-0.01
-0.02
-0.03
-0.04
-0.05
-0.06
-0.07
-0.08
Frequency [Hz]
80
70
60
50
40
30
20
10
Fourier
Amplitude
0.00020
0.00018
0.00016
0.00014
0.00012
0.00010
0.00008
0.00006
0.00004
0.00002
0.00000
Z axis Minimum Value 1 Hz, Peak (below 10Hz): 1.601 Hz](https://image.slidesharecdn.com/hendersonbridgereport-230621102806-a3533288/85/Henderson-Bridge-Report-pdf-9-320.jpg)
![SysEng (S) Pte Ltd
One Stop Shop for Engineering Solutions
Results in the X axis:
Time [sec]
150
140
130
120
110
100
90
80
70
60
50
40
30
20
10
0
Acceleration
[g]
0.0010
0.0008
0.0006
0.0004
0.0002
0.0000
-0.0002
-0.0004
-0.0006
-0.0008
-0.0010
Time [sec]
150
140
130
120
110
100
90
80
70
60
50
40
30
20
10
0
Displacement
[cm]
0.08
0.07
0.06
0.05
0.04
0.03
0.02
0.01
0
-0.01
-0.02
-0.03
-0.04
-0.05
-0.06
-0.07
-0.08
Frequency [Hz]
80
70
60
50
40
30
20
10
Fourier
Amplitude
0.00020
0.00018
0.00016
0.00014
0.00012
0.00010
0.00008
0.00006
0.00004
0.00002
0.00000](https://image.slidesharecdn.com/hendersonbridgereport-230621102806-a3533288/85/Henderson-Bridge-Report-pdf-10-320.jpg)
![SysEng (S) Pte Ltd
One Stop Shop for Engineering Solutions
Test 4: 3 or 4 groups of peoples moving through the bridge
Results in the Z axis:
Time [sec]
150
140
130
120
110
100
90
80
70
60
50
40
30
20
10
0
Acceleration
[g]
0.0010
0.0008
0.0006
0.0004
0.0002
0.0000
-0.0002
-0.0004
-0.0006
-0.0008
-0.0010
Time [sec]
150
140
130
120
110
100
90
80
70
60
50
40
30
20
10
0
Displacement
[cm]
0.08
0.07
0.06
0.05
0.04
0.03
0.02
0.01
0
-0.01
-0.02
-0.03
-0.04
-0.05
-0.06
-0.07
-0.08
Frequency [Hz]
80
70
60
50
40
30
20
10
Fourier
Amplitude
0.00020
0.00018
0.00016
0.00014
0.00012
0.00010
0.00008
0.00006
0.00004
0.00002
0.00000
Z axis Minimum Value 1 Hz, Peak (below 10Hz): 1.619 Hz](https://image.slidesharecdn.com/hendersonbridgereport-230621102806-a3533288/85/Henderson-Bridge-Report-pdf-11-320.jpg)
![SysEng (S) Pte Ltd
One Stop Shop for Engineering Solutions
Results in the X Axis:
Time [sec]
150
140
130
120
110
100
90
80
70
60
50
40
30
20
10
0
Acceleration
[g]
0.0010
0.0008
0.0006
0.0004
0.0002
0.0000
-0.0002
-0.0004
-0.0006
-0.0008
-0.0010
Time [sec]
150
140
130
120
110
100
90
80
70
60
50
40
30
20
10
0
Displacement
[cm]
0.08
0.07
0.06
0.05
0.04
0.03
0.02
0.01
0
-0.01
-0.02
-0.03
-0.04
-0.05
-0.06
-0.07
-0.08
Frequency [Hz]
80
70
60
50
40
30
20
10
Fourier
Amplitude
0.00020
0.00018
0.00016
0.00014
0.00012
0.00010
0.00008
0.00006
0.00004
0.00002
0.00000](https://image.slidesharecdn.com/hendersonbridgereport-230621102806-a3533288/85/Henderson-Bridge-Report-pdf-12-320.jpg)
![SysEng (S) Pte Ltd
One Stop Shop for Engineering Solutions
Test 5: A group of 3 people crossing and 2 children are playing
Results in the Z axis
Time [sec]
150
140
130
120
110
100
90
80
70
60
50
40
30
20
10
0
Acceleration
[g]
0.0010
0.0008
0.0006
0.0004
0.0002
0.0000
-0.0002
-0.0004
-0.0006
-0.0008
-0.0010
Time [sec]
150
140
130
120
110
100
90
80
70
60
50
40
30
20
10
0
Displacement
[cm]
0.08
0.07
0.06
0.05
0.04
0.03
0.02
0.01
0
-0.01
-0.02
-0.03
-0.04
-0.05
-0.06
-0.07
-0.08
Frequency [Hz]
80
70
60
50
40
30
20
10
Fourier
Amplitude
0.00020
0.00018
0.00016
0.00014
0.00012
0.00010
0.00008
0.00006
0.00004
0.00002
0.00000
Z axis Minimum Value 1 Hz, Peak (below 10Hz): 1.62 Hz](https://image.slidesharecdn.com/hendersonbridgereport-230621102806-a3533288/85/Henderson-Bridge-Report-pdf-13-320.jpg)
![SysEng (S) Pte Ltd
One Stop Shop for Engineering Solutions
Results in the X axis:
Time [sec]
150
140
130
120
110
100
90
80
70
60
50
40
30
20
10
0
Acceleration
[g]
0.0010
0.0008
0.0006
0.0004
0.0002
0.0000
-0.0002
-0.0004
-0.0006
-0.0008
-0.0010
Time [sec]
150
140
130
120
110
100
90
80
70
60
50
40
30
20
10
0
Displacement
[cm]
0.08
0.07
0.06
0.05
0.04
0.03
0.02
0.01
0
-0.01
-0.02
-0.03
-0.04
-0.05
-0.06
-0.07
-0.08
Frequency [Hz]
80
70
60
50
40
30
20
10
Fourier
Amplitude
0.00020
0.00018
0.00016
0.00014
0.00012
0.00010
0.00008
0.00006
0.00004
0.00002
0.00000
X axis Minimum Value 1 Hz,](https://image.slidesharecdn.com/hendersonbridgereport-230621102806-a3533288/85/Henderson-Bridge-Report-pdf-14-320.jpg)


The document reports on bridge vibration monitoring tests carried out by SysEng Pte Ltd. A monitoring system was installed on the Henderson Foot Bridge but the data was corrupted. Further tests were conducted with 4 people simulating different loading conditions on the bridge such as jumping, walking, jogging, and groups crossing. Acceleration and displacement were measured in the X and Z axes. Analysis showed the Z axis was most sensitive, with peak acceleration around 1.6 Hz under all test conditions.


