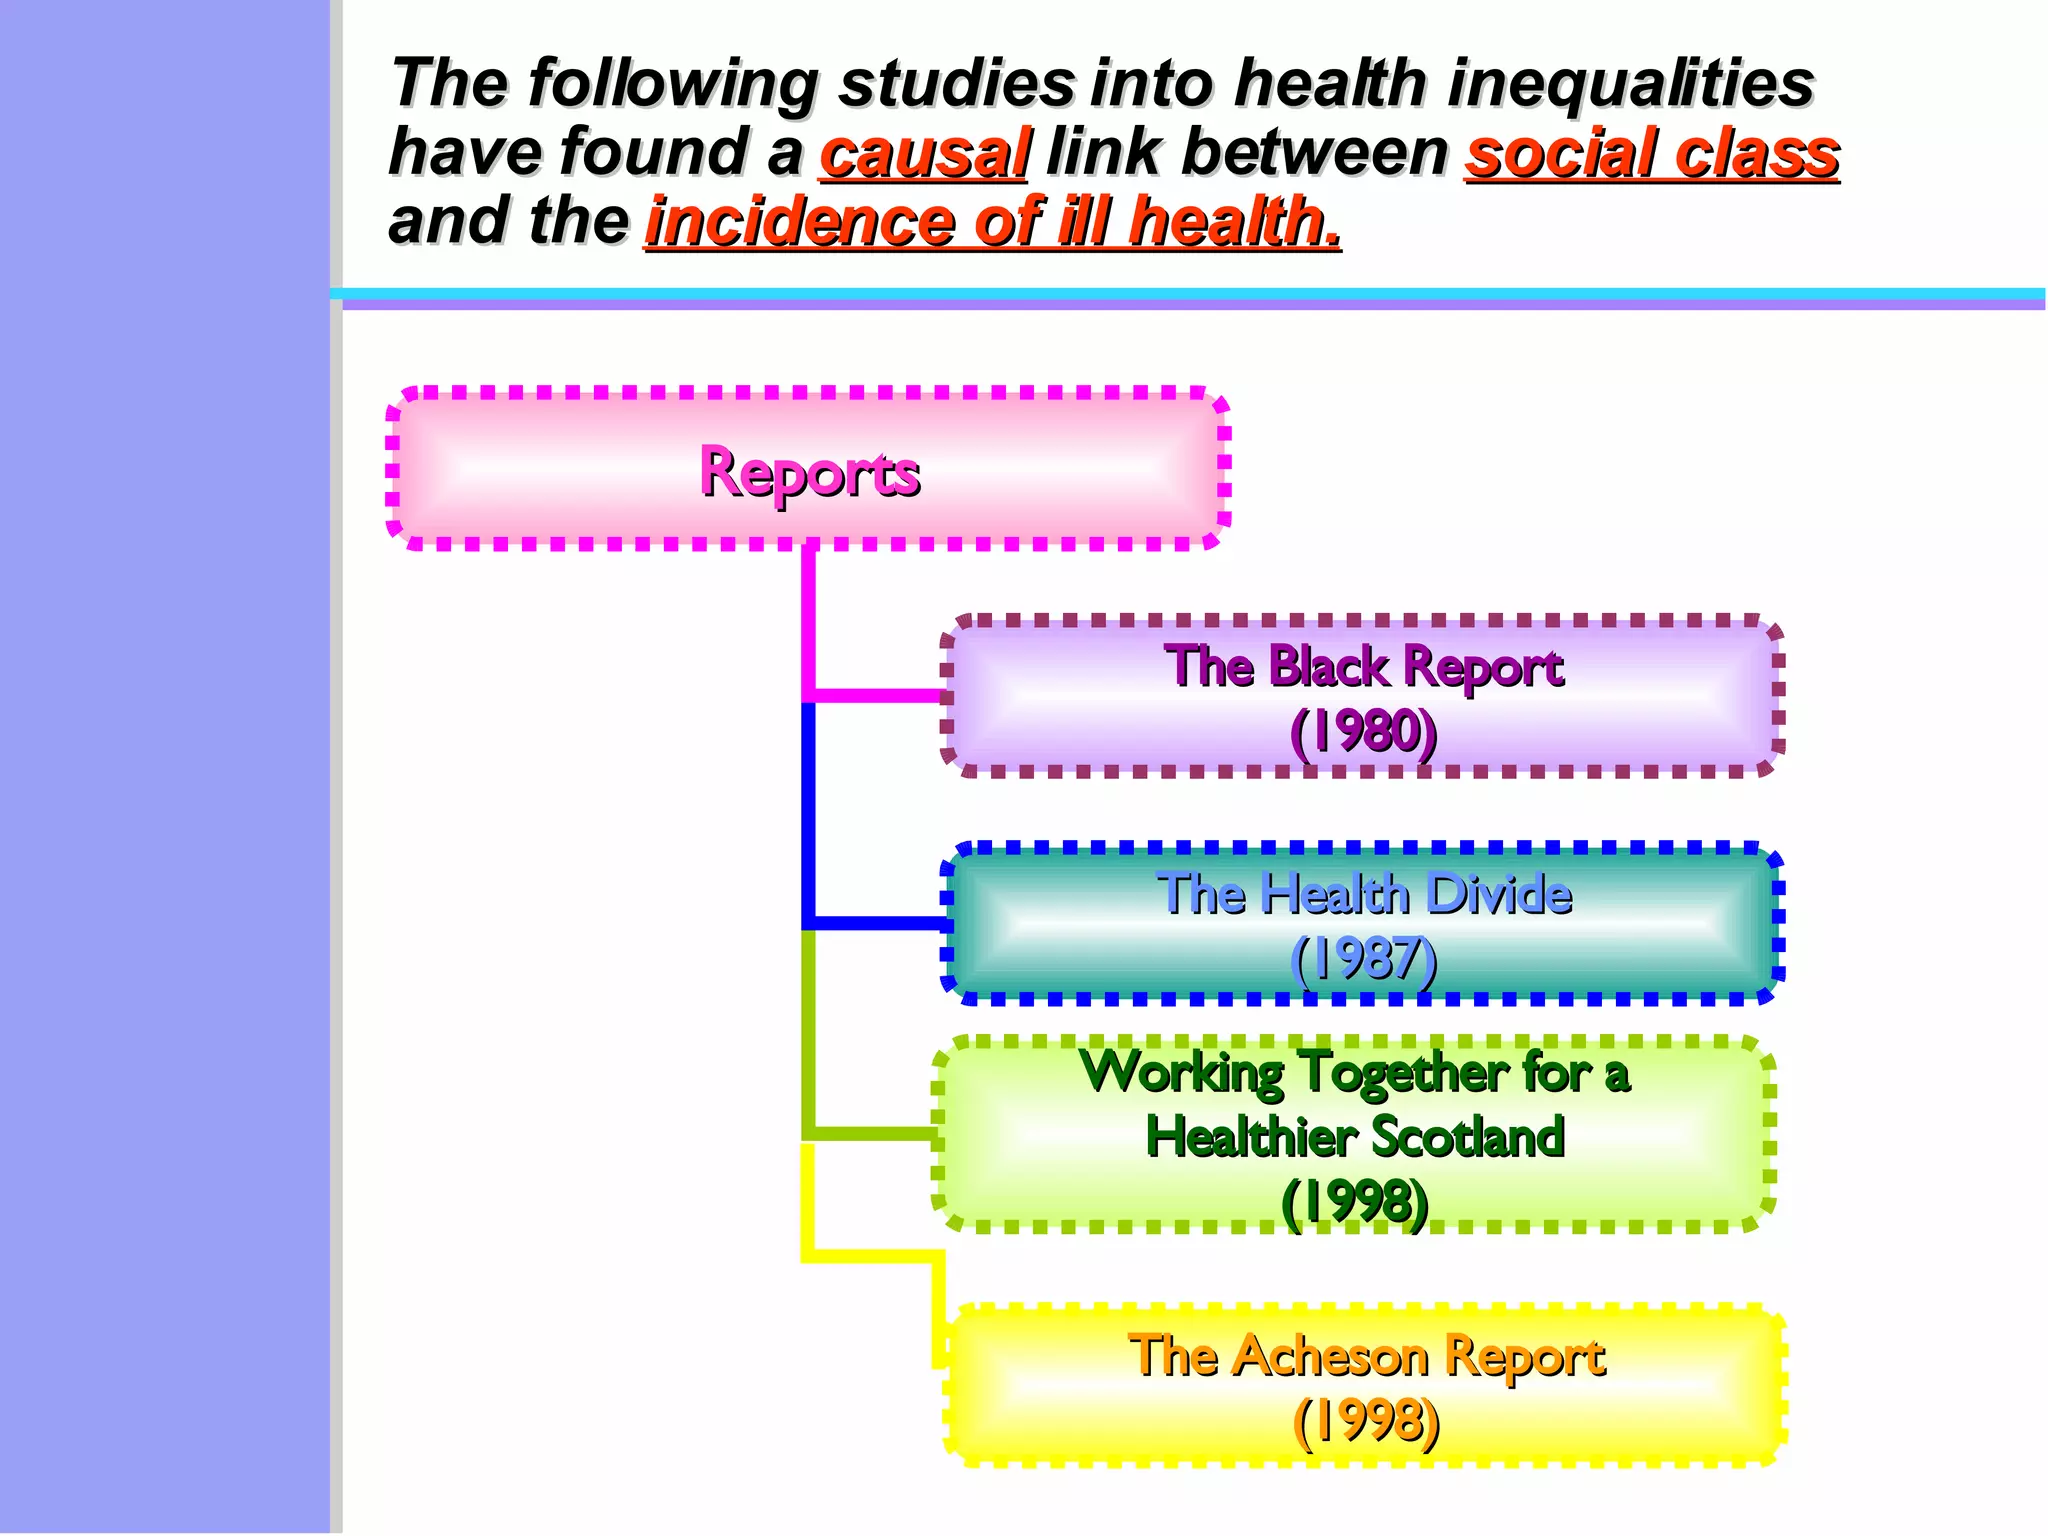
1) Numerous studies over many years have found a link between socioeconomic status and health inequalities in the UK, with those in lower social classes experiencing worse health outcomes.
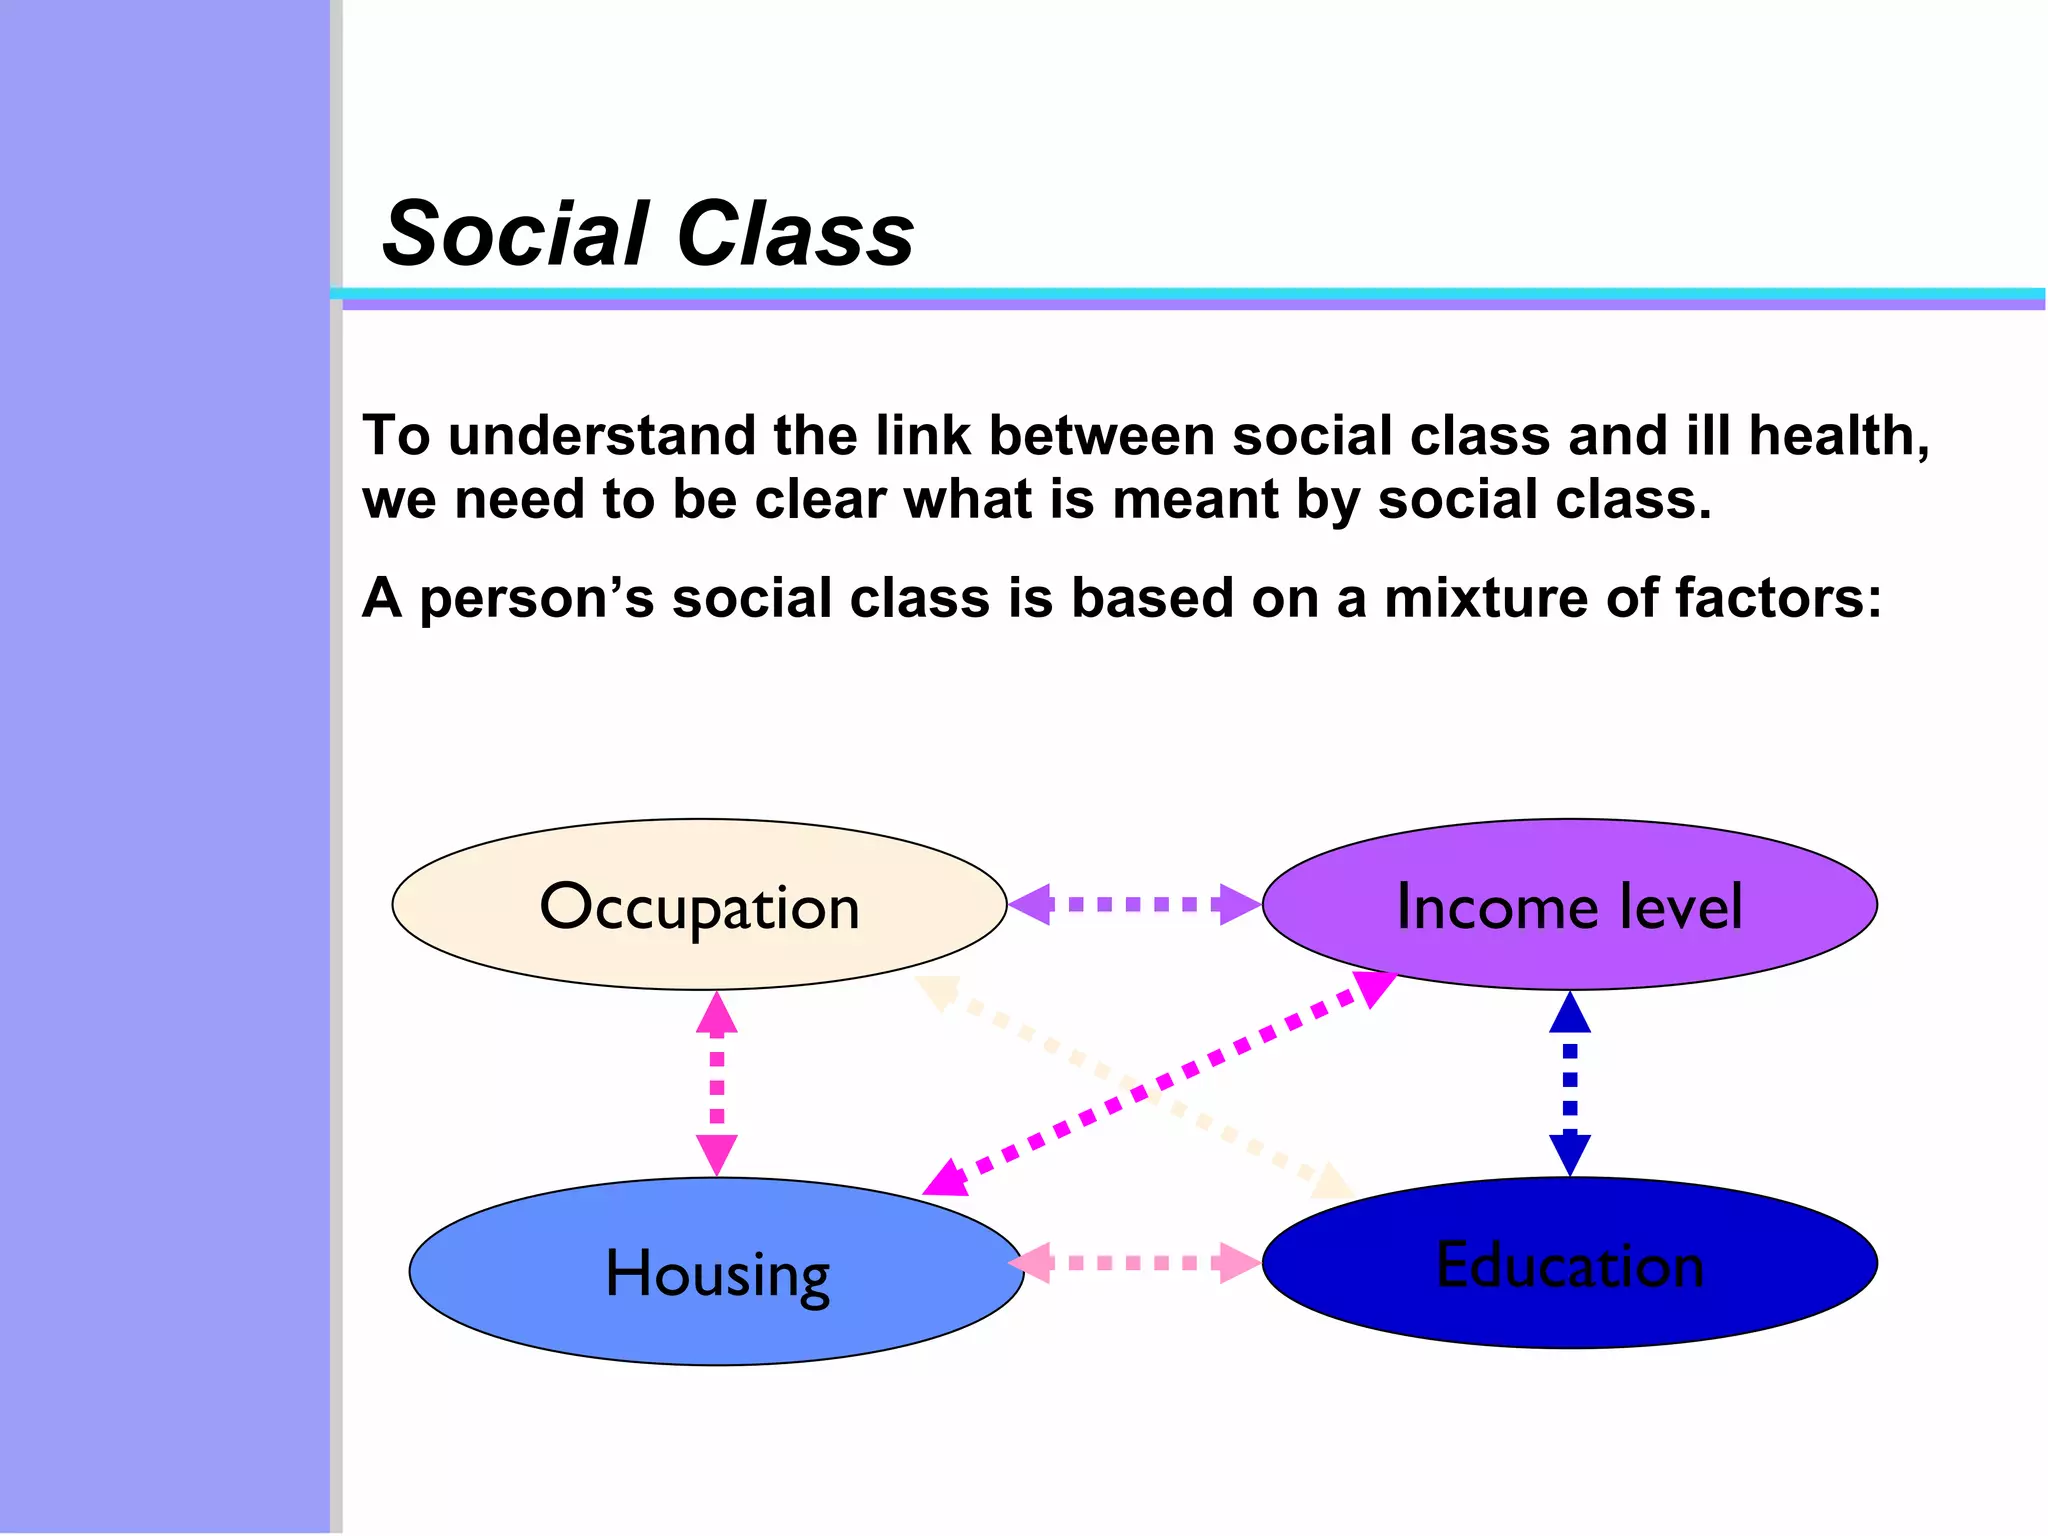
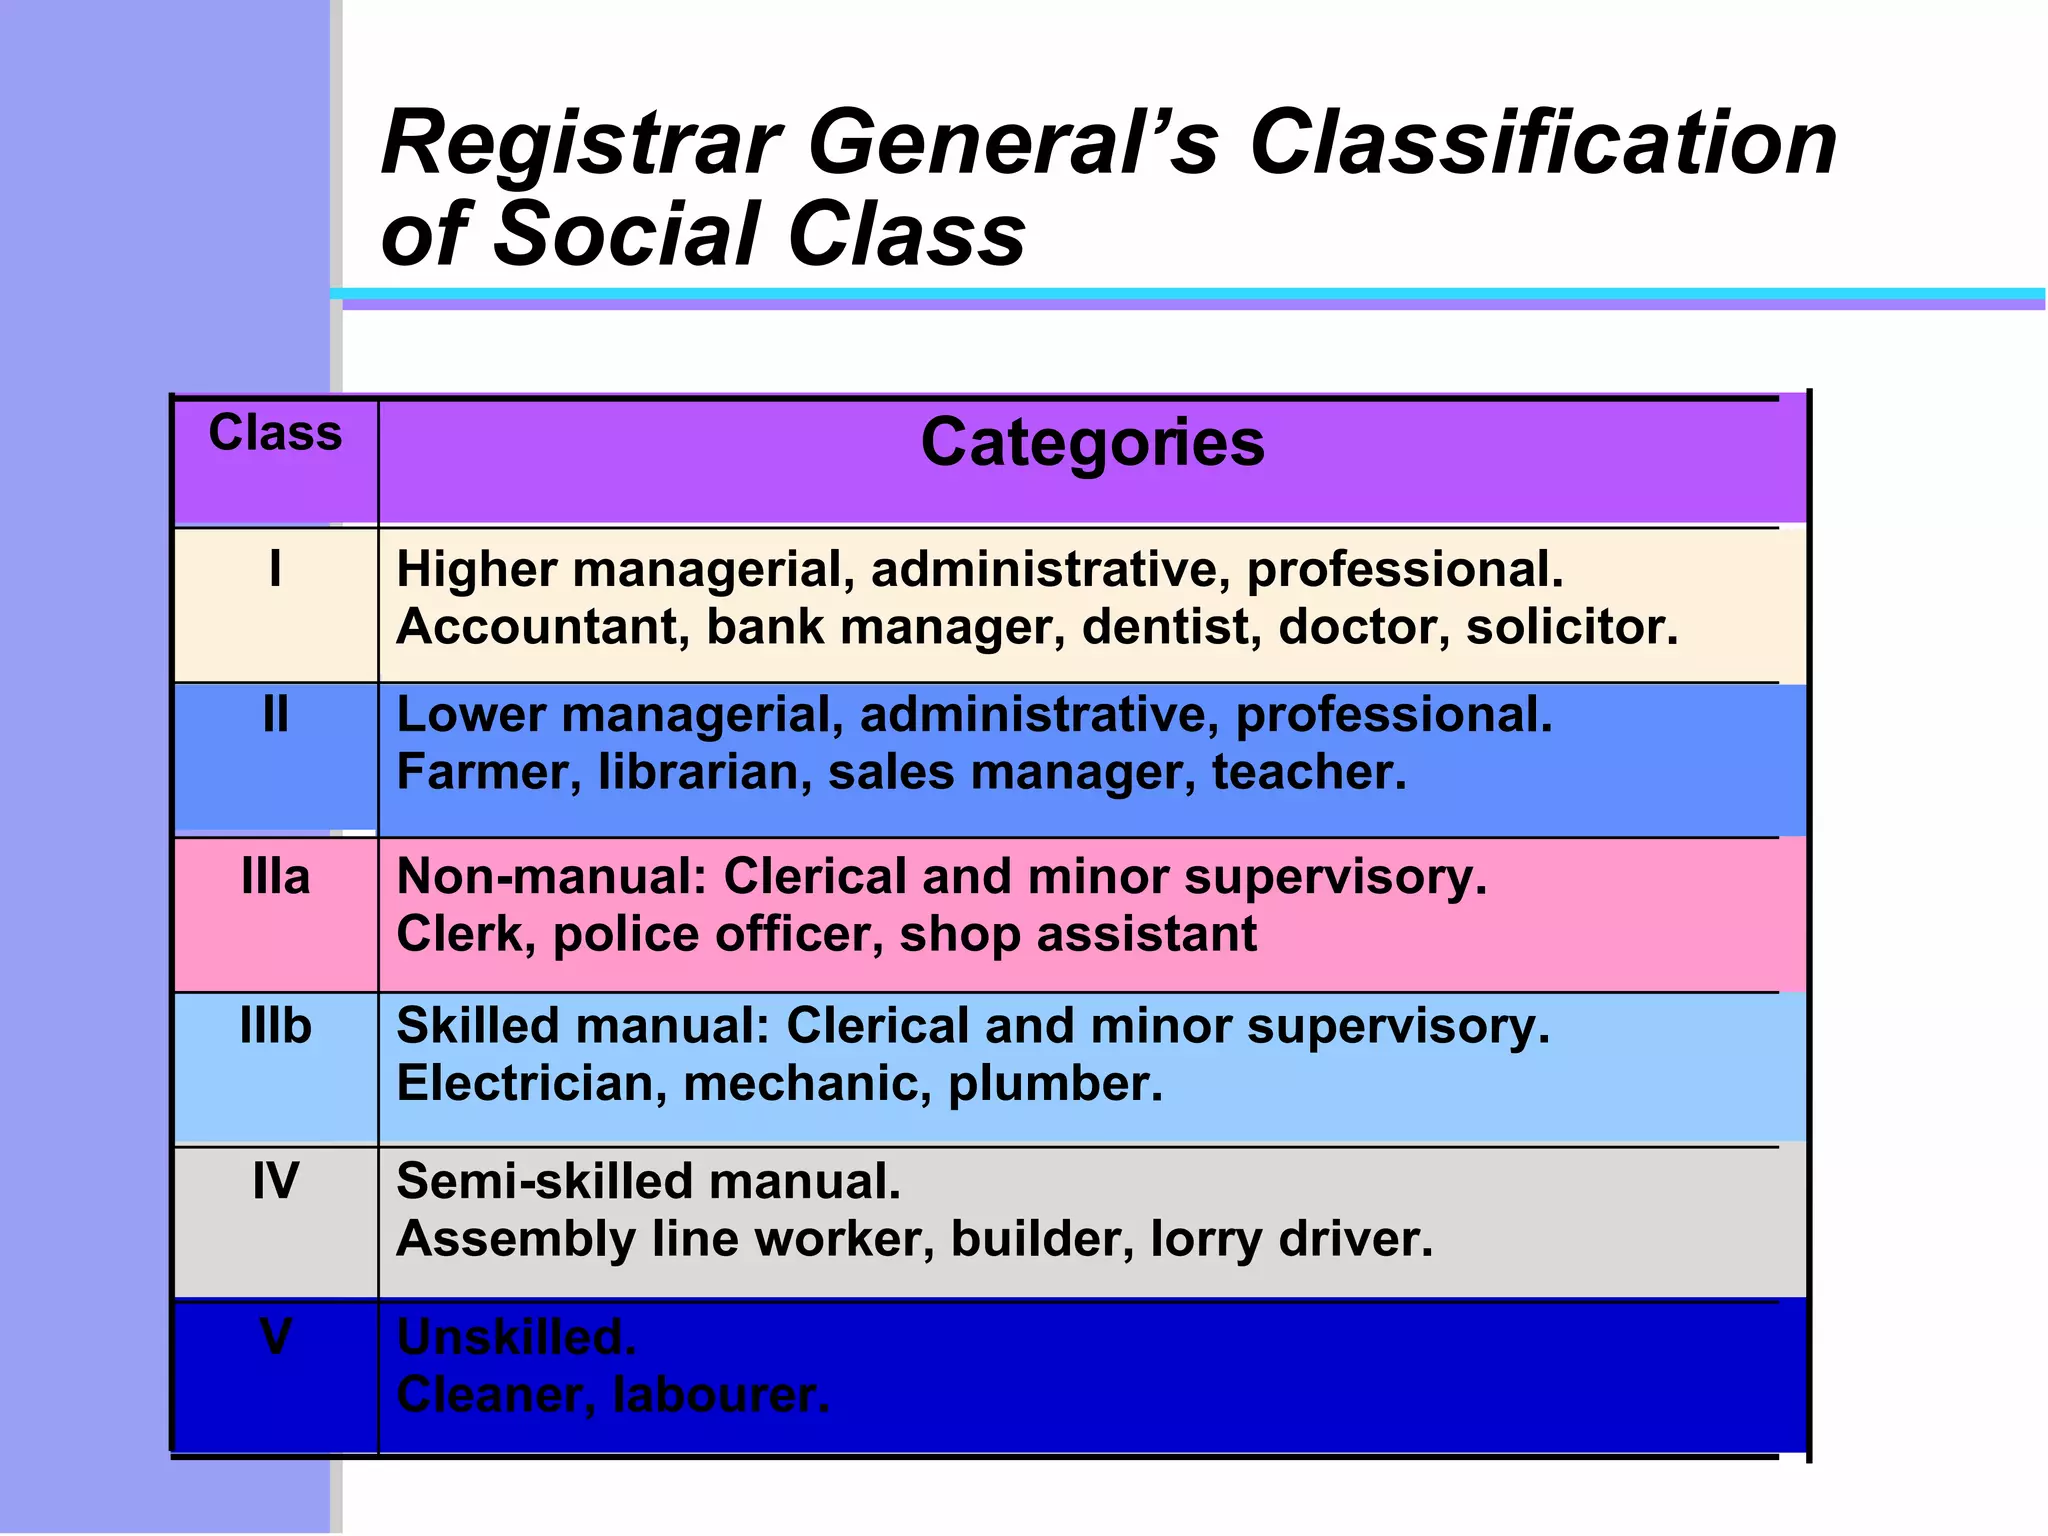
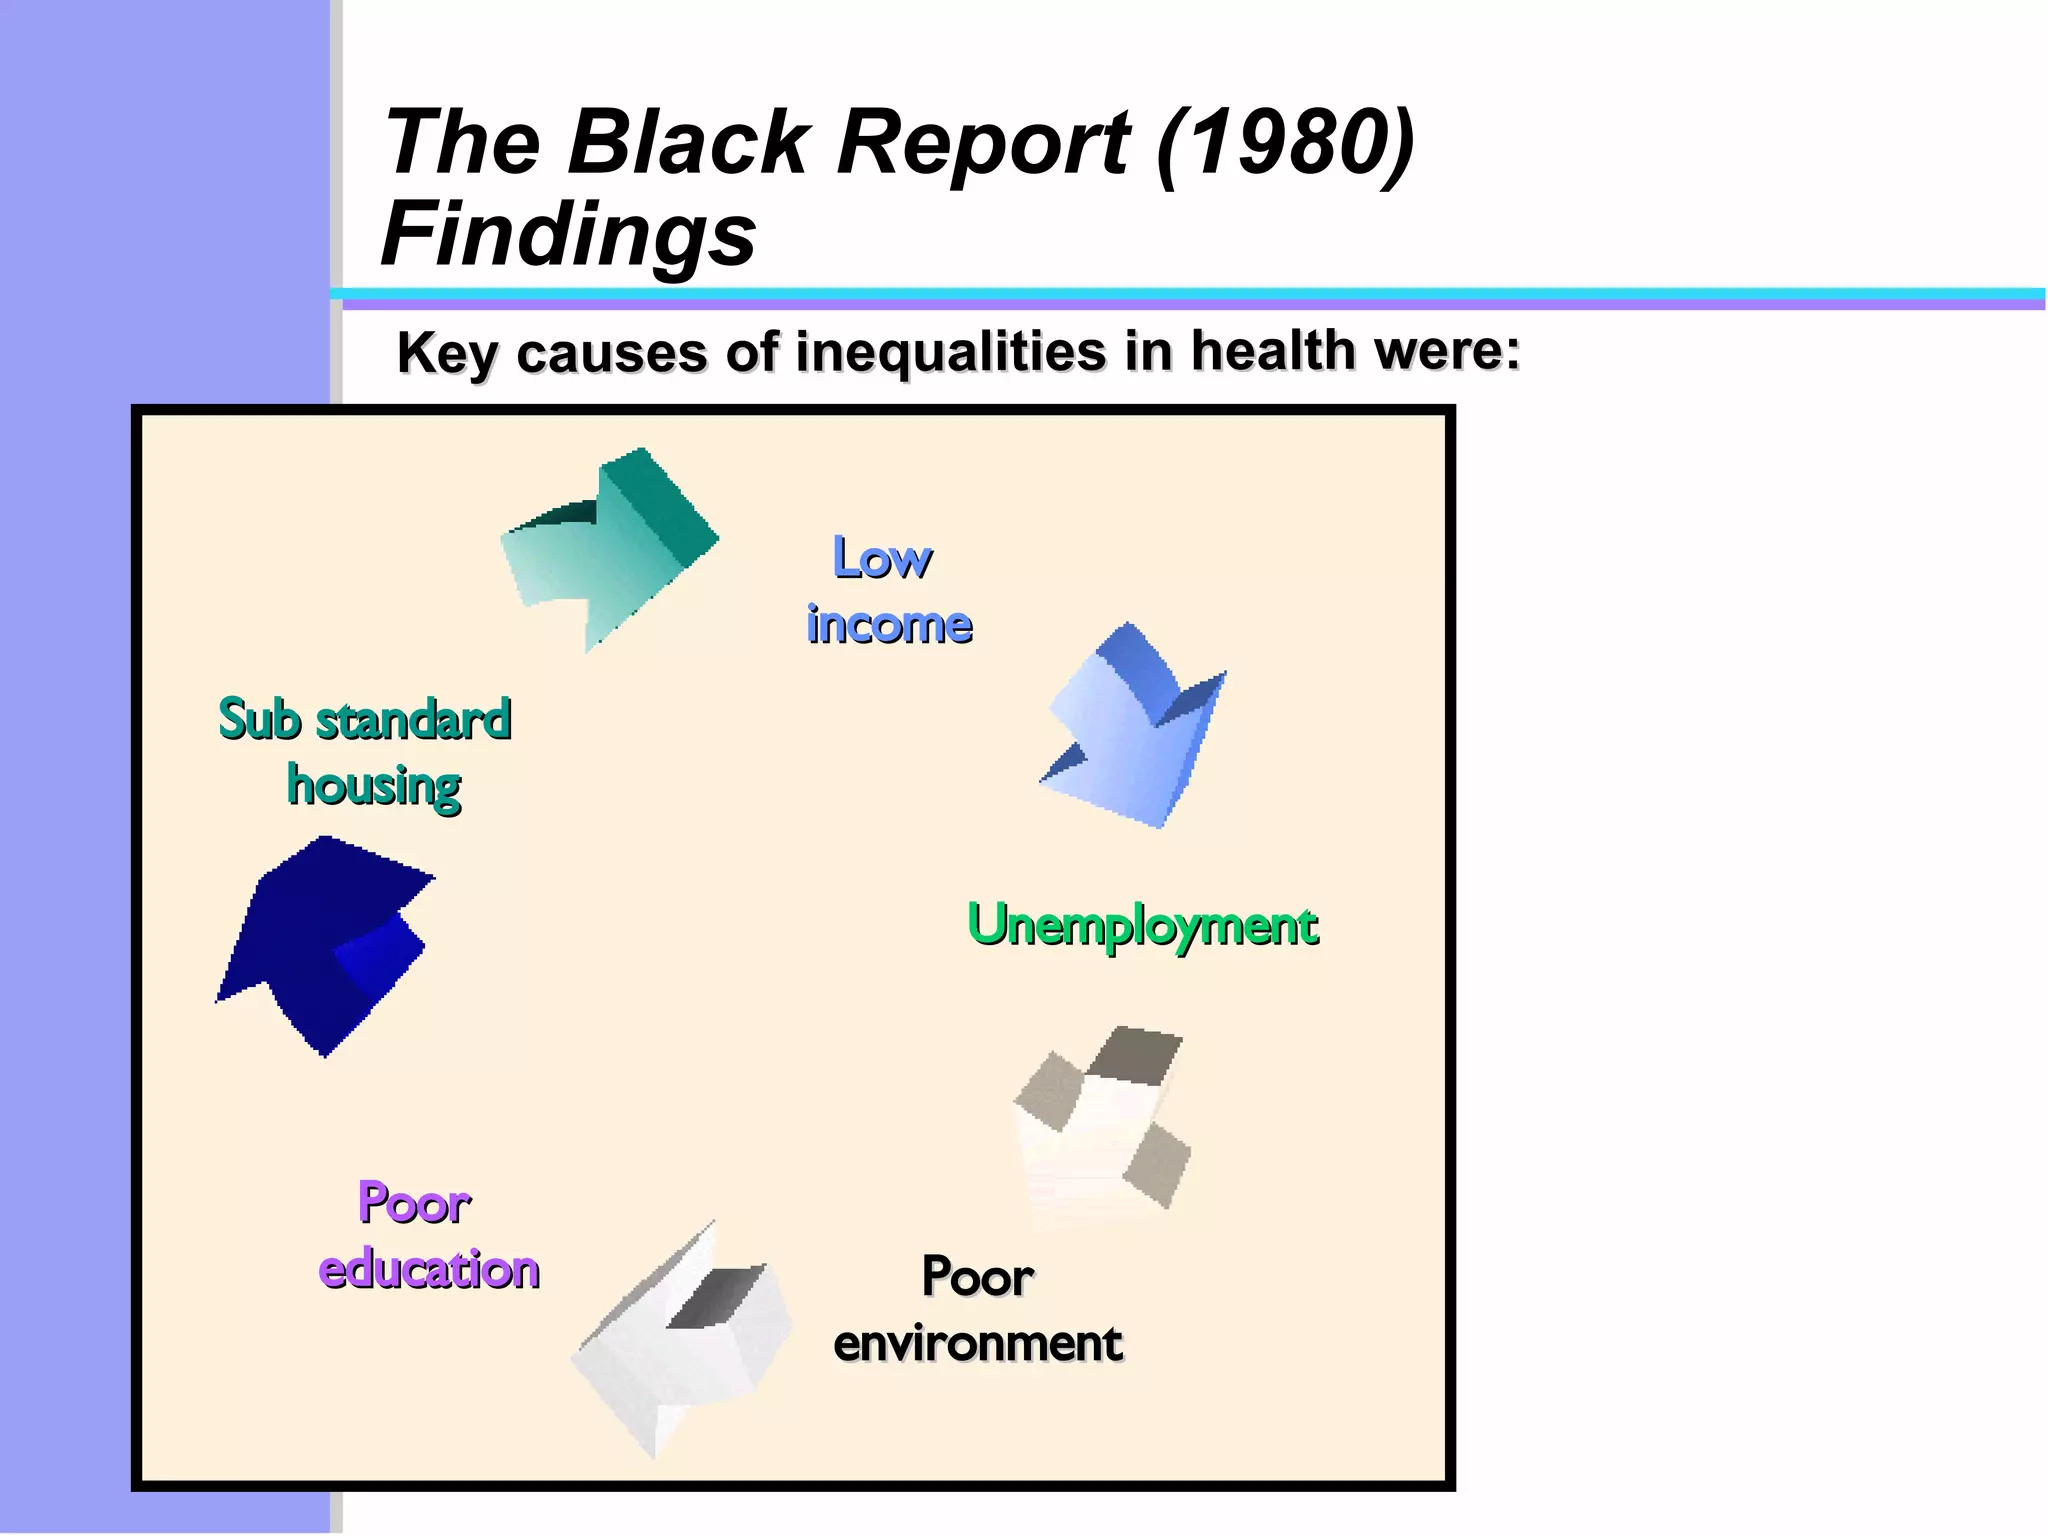
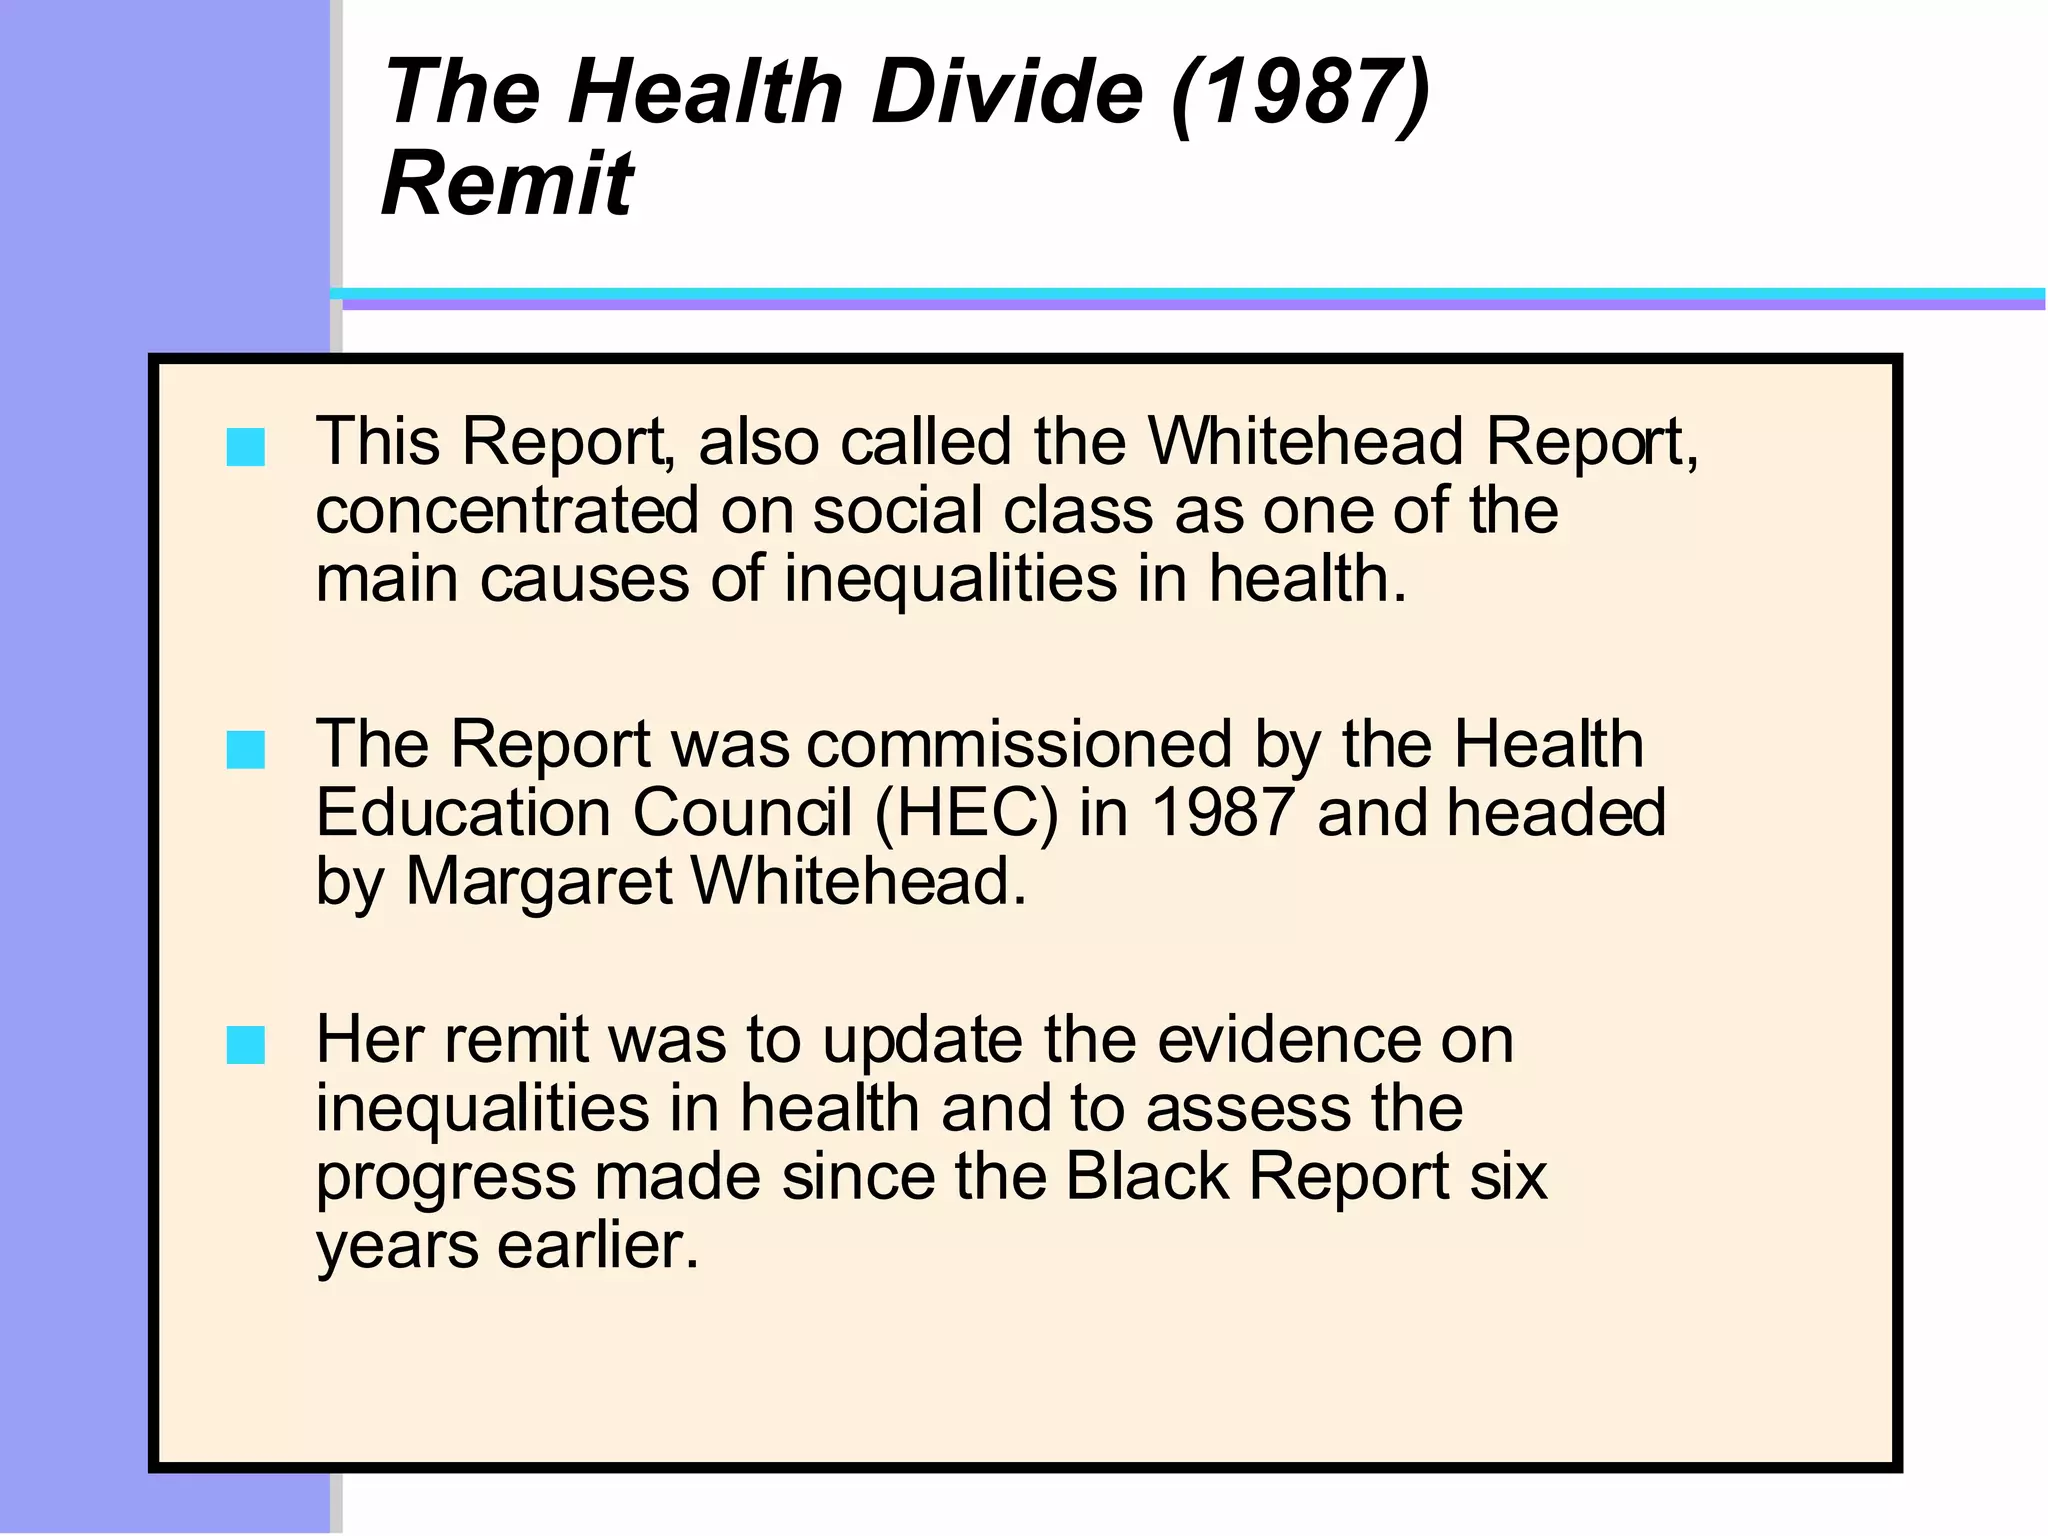
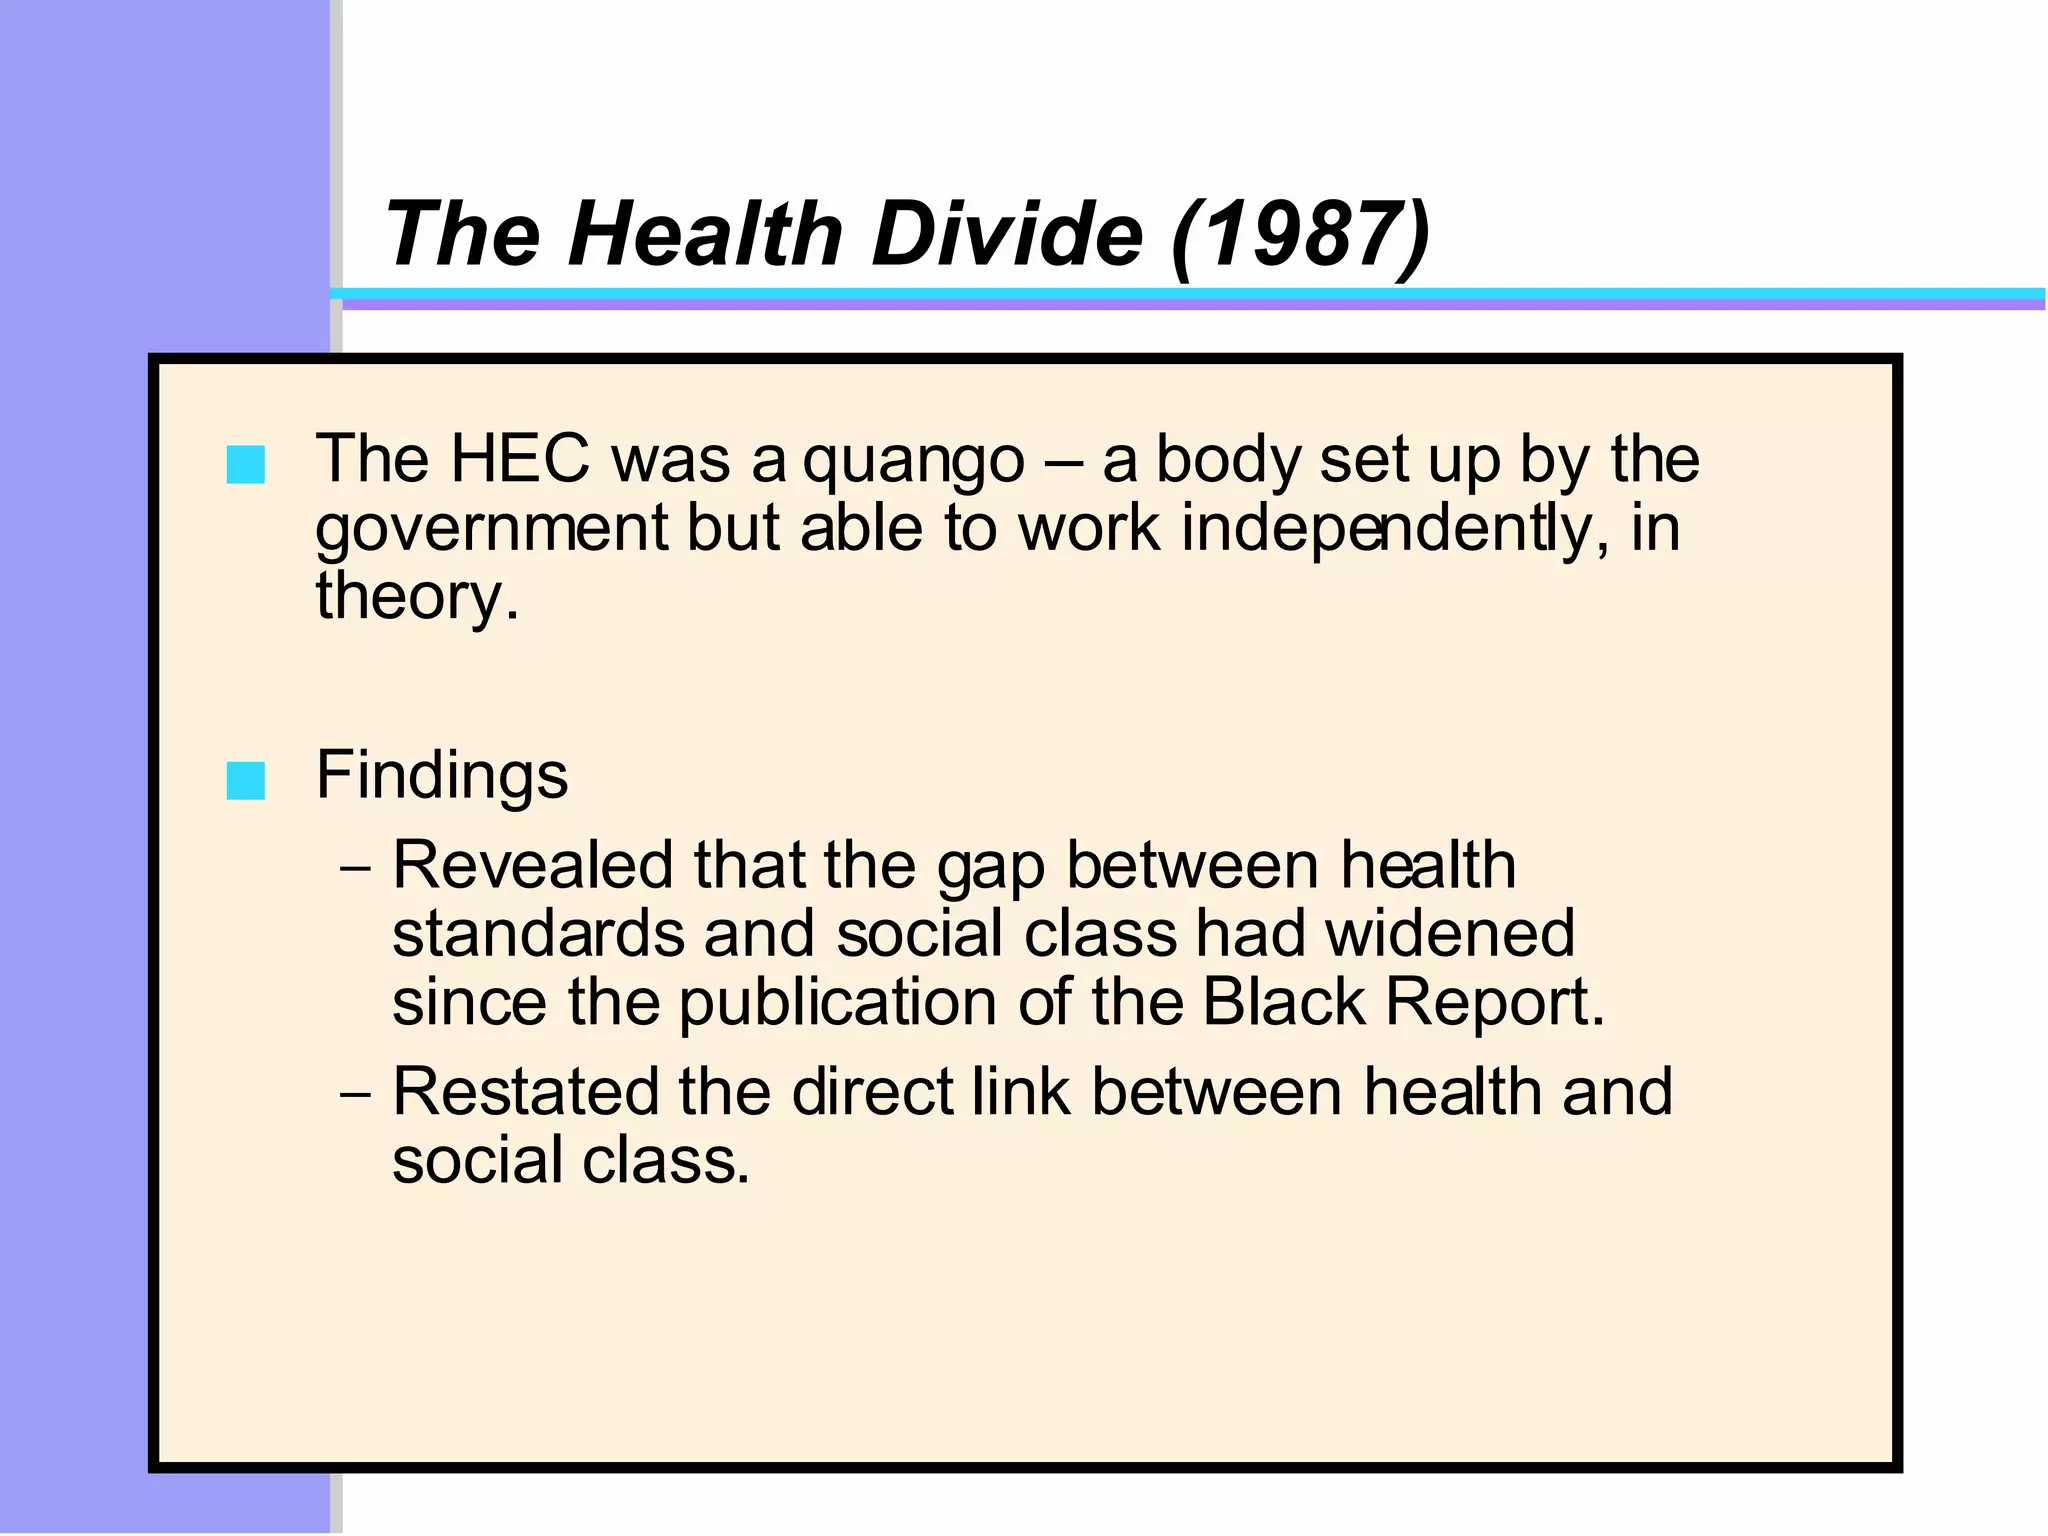
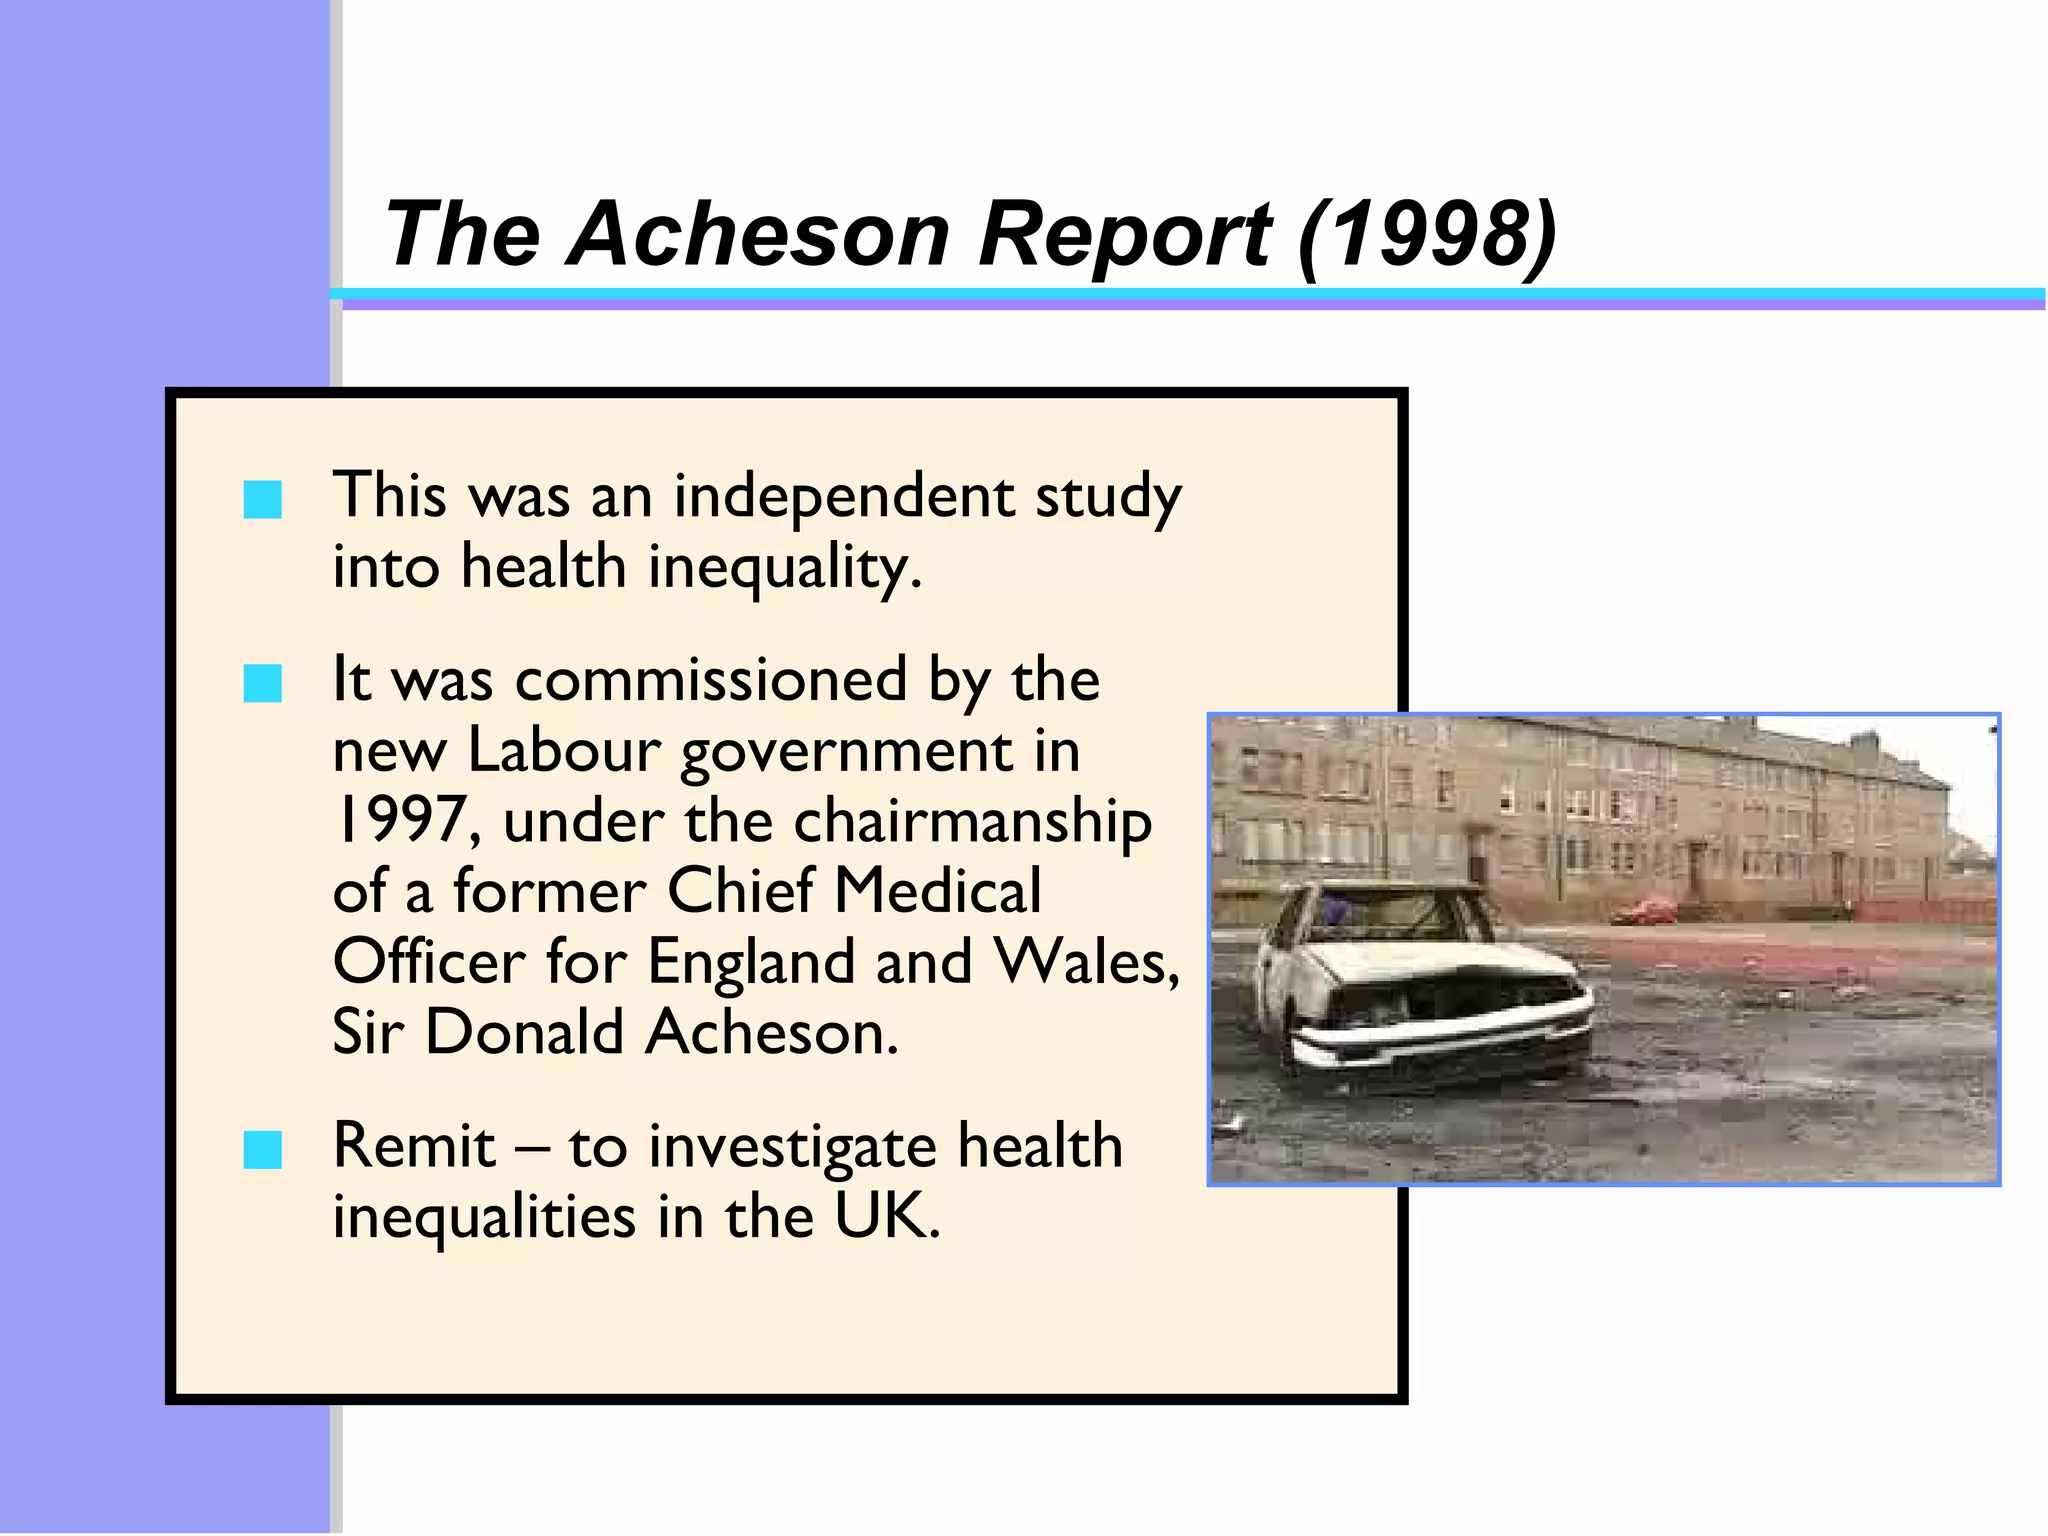
2) The Black Report of 1980 and subsequent reports like the Acheson Report of 1998 found that factors like low income, unemployment, poor housing and education were key causes of health inequalities and that the gap between social classes was widening.
3) These reports recommended policies to reduce poverty and increase spending on health education to prevent illness, but UK governments were often critical of the findings and reluctant to implement the recommendations.