Download as PDF, PPTX

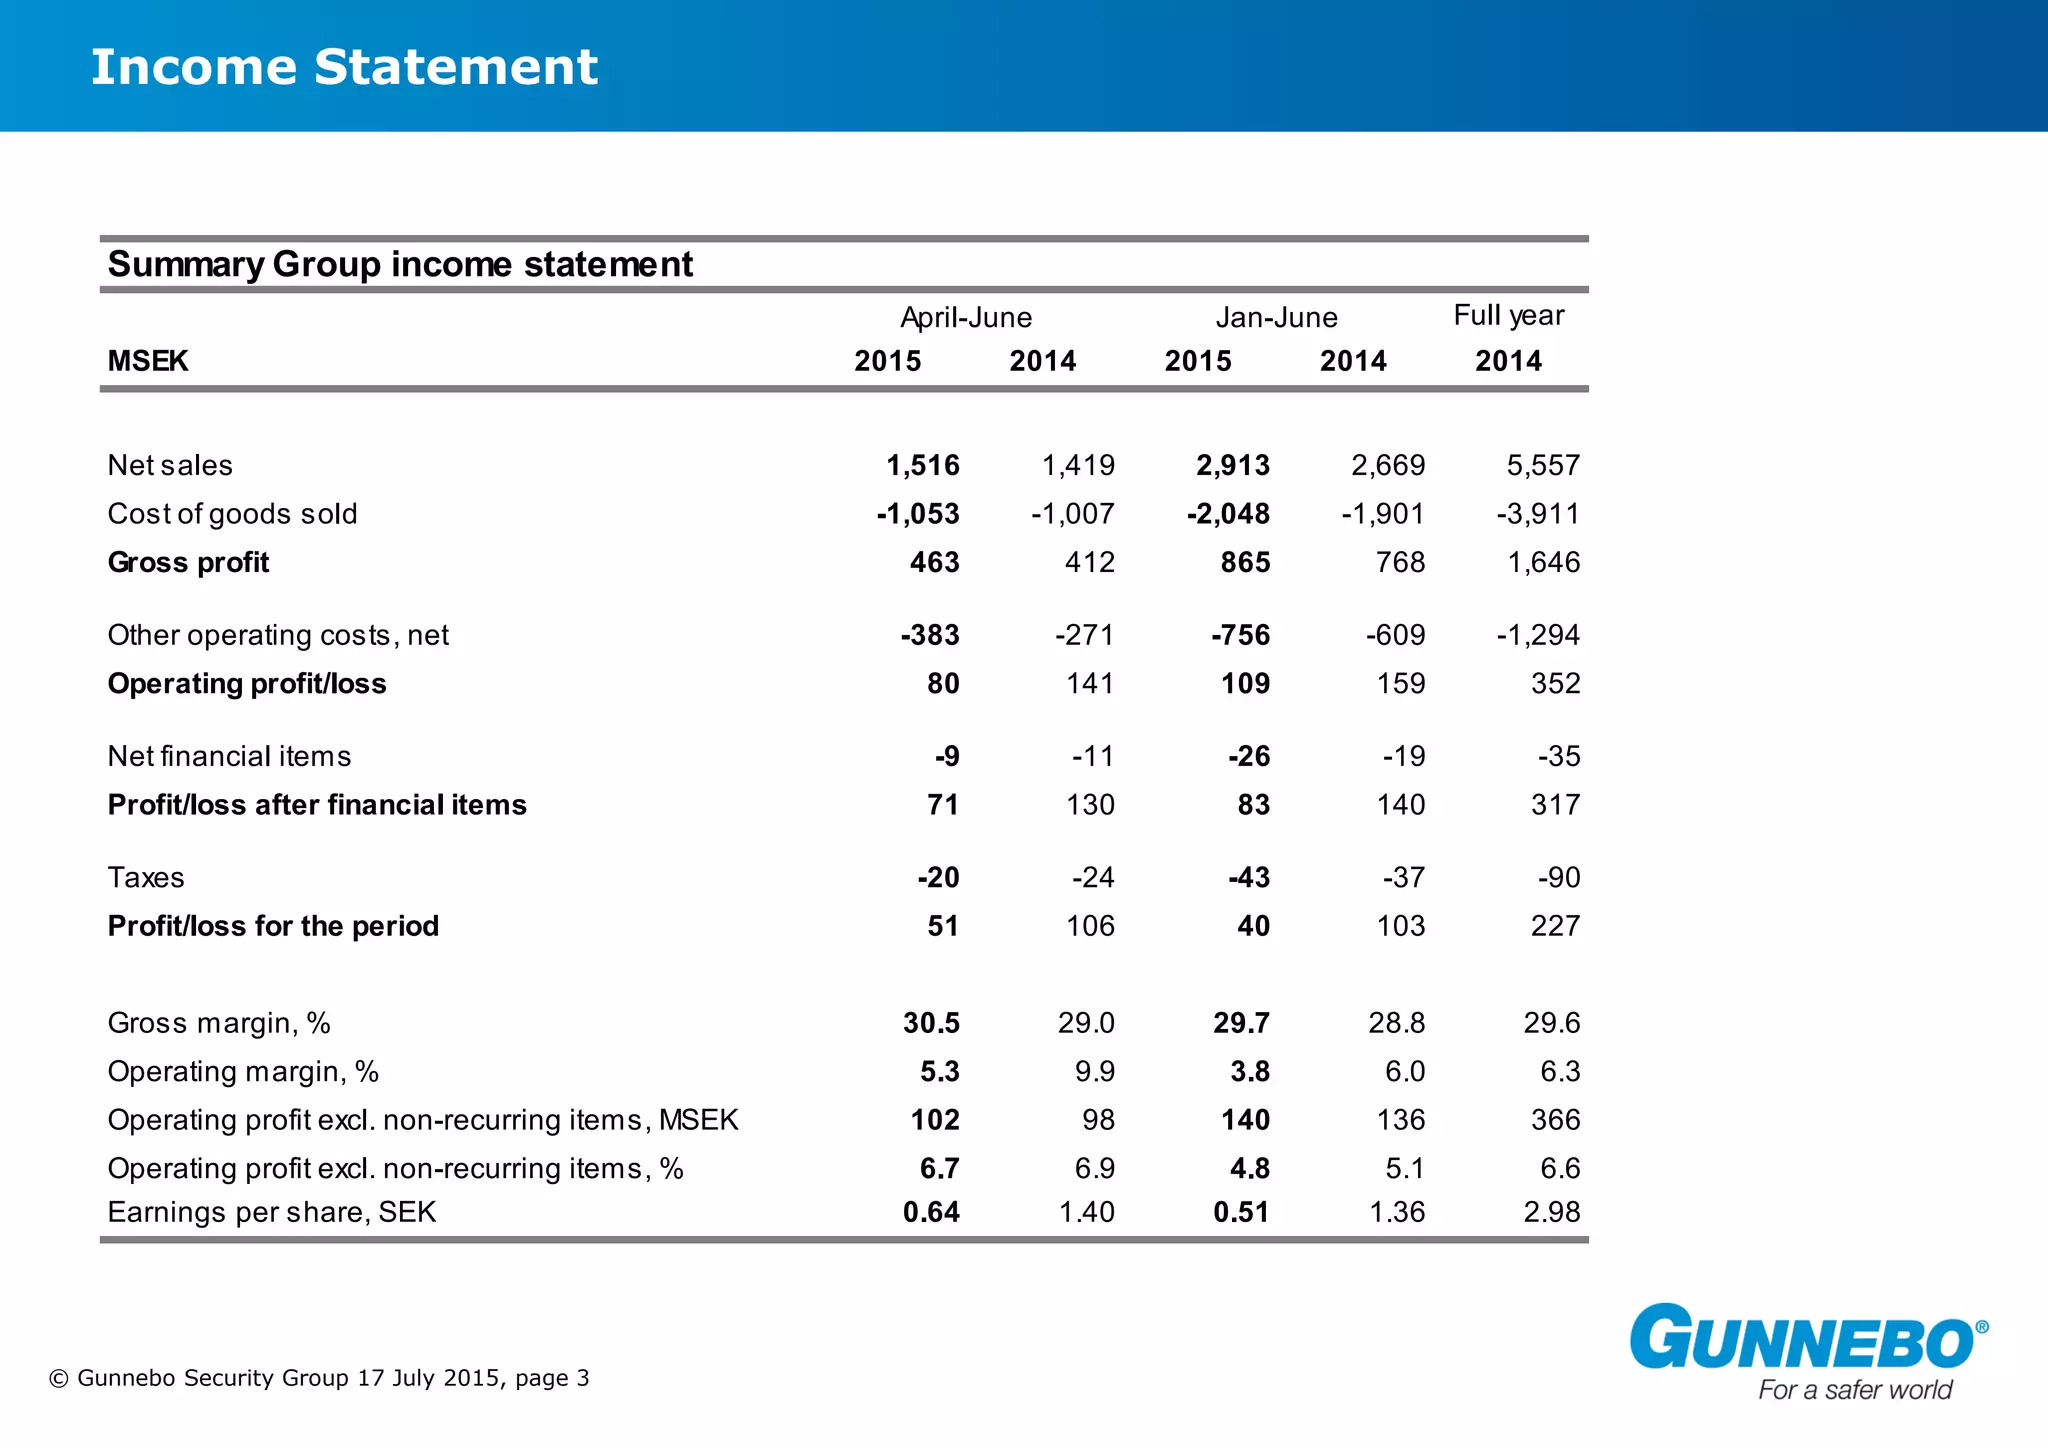
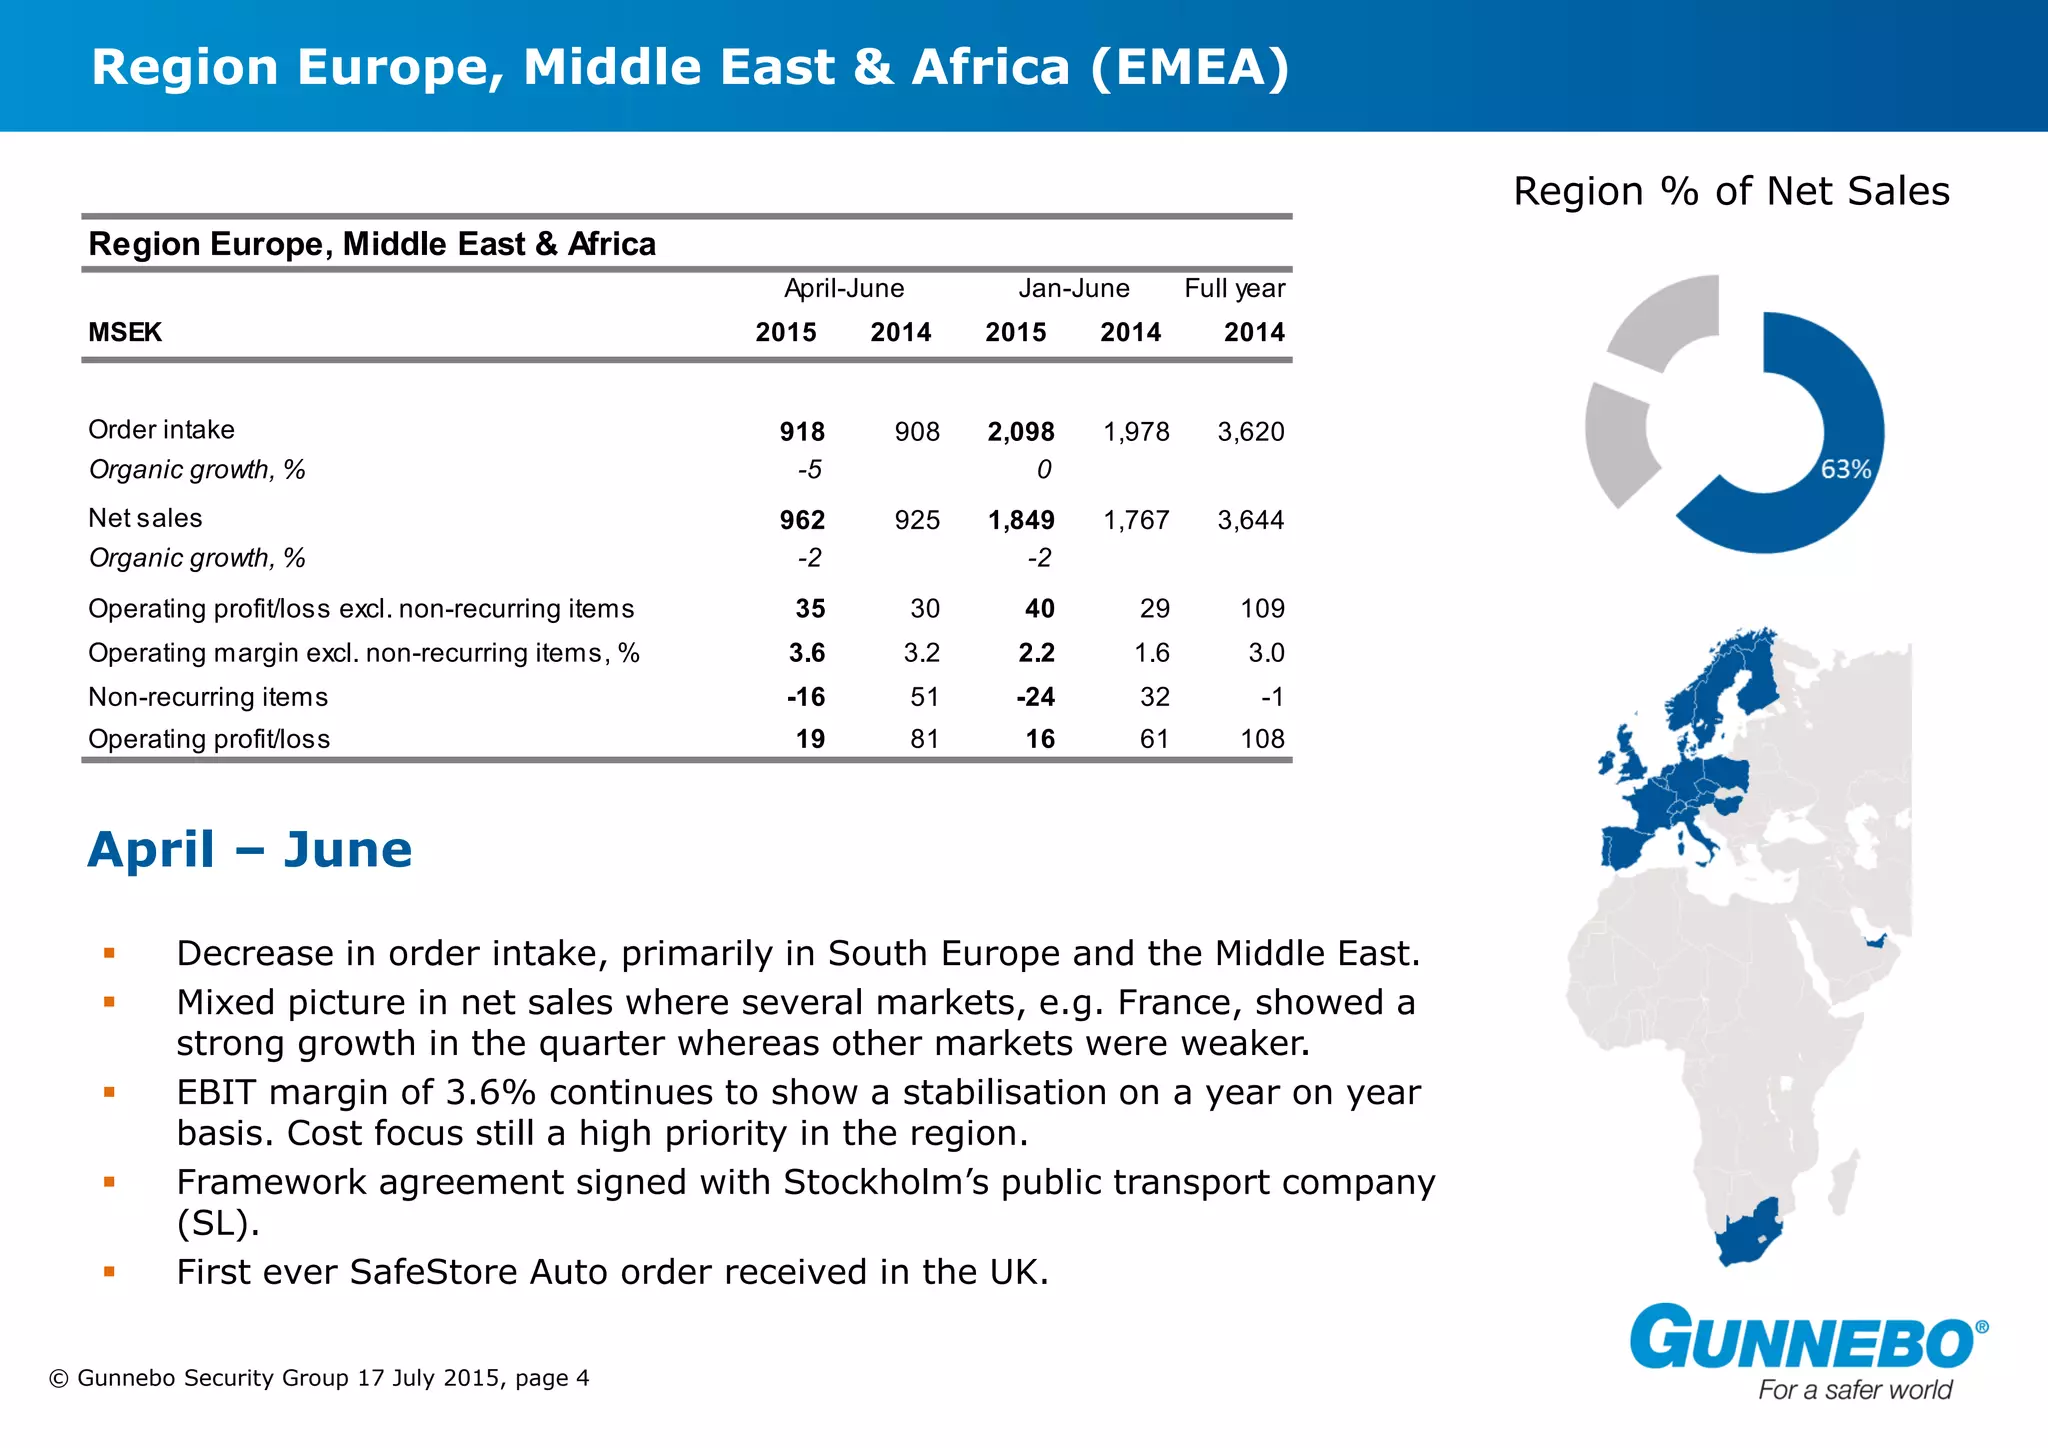
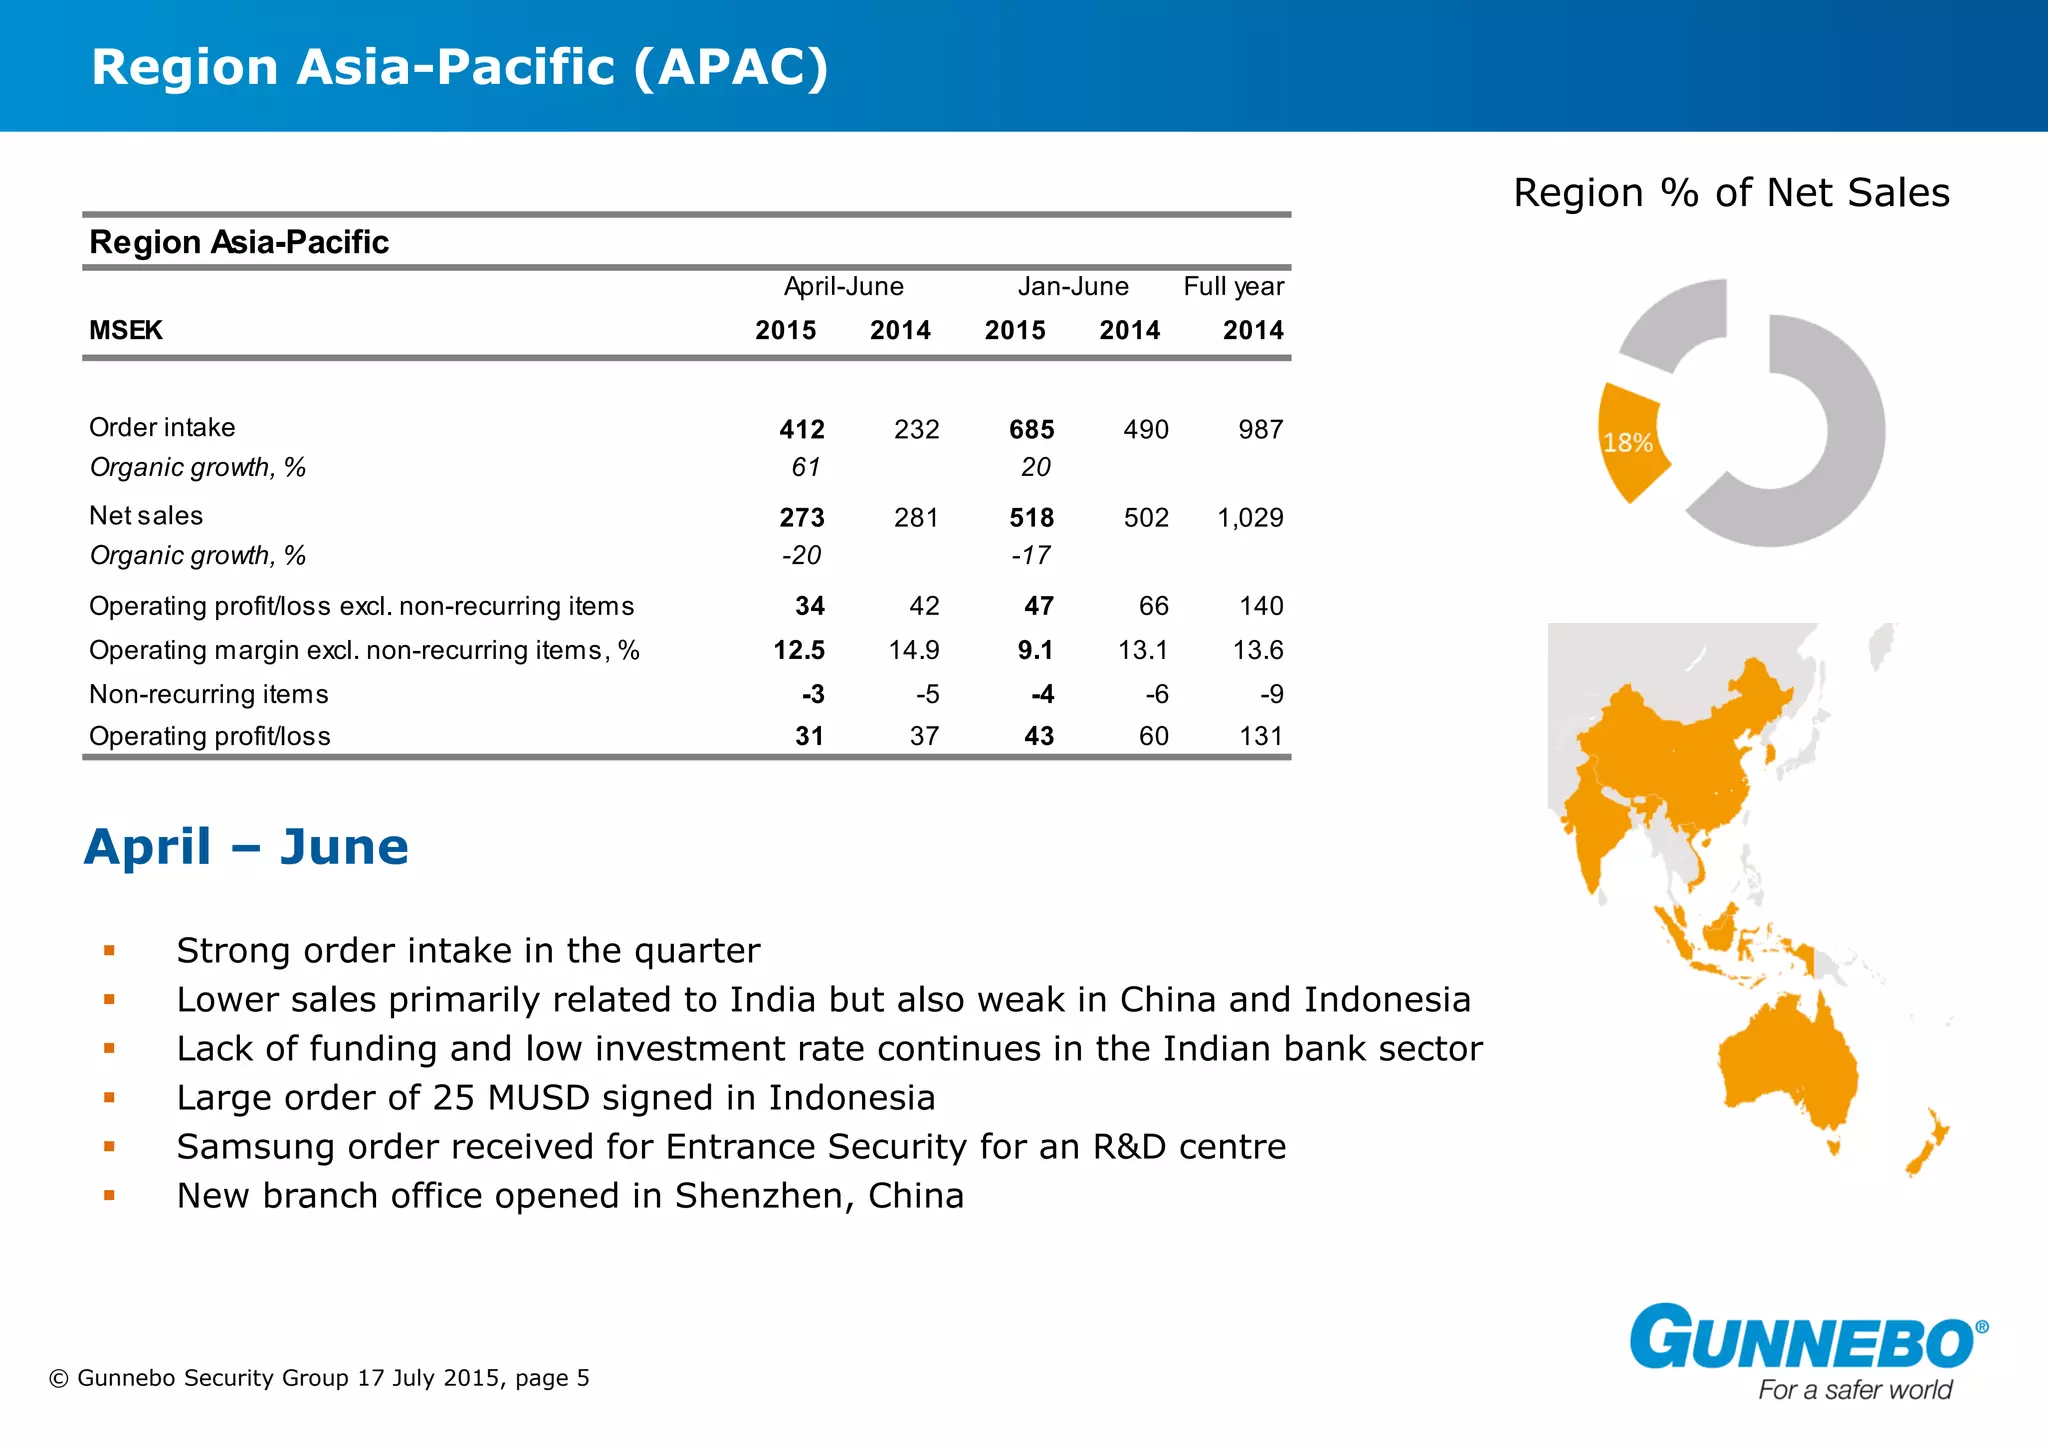
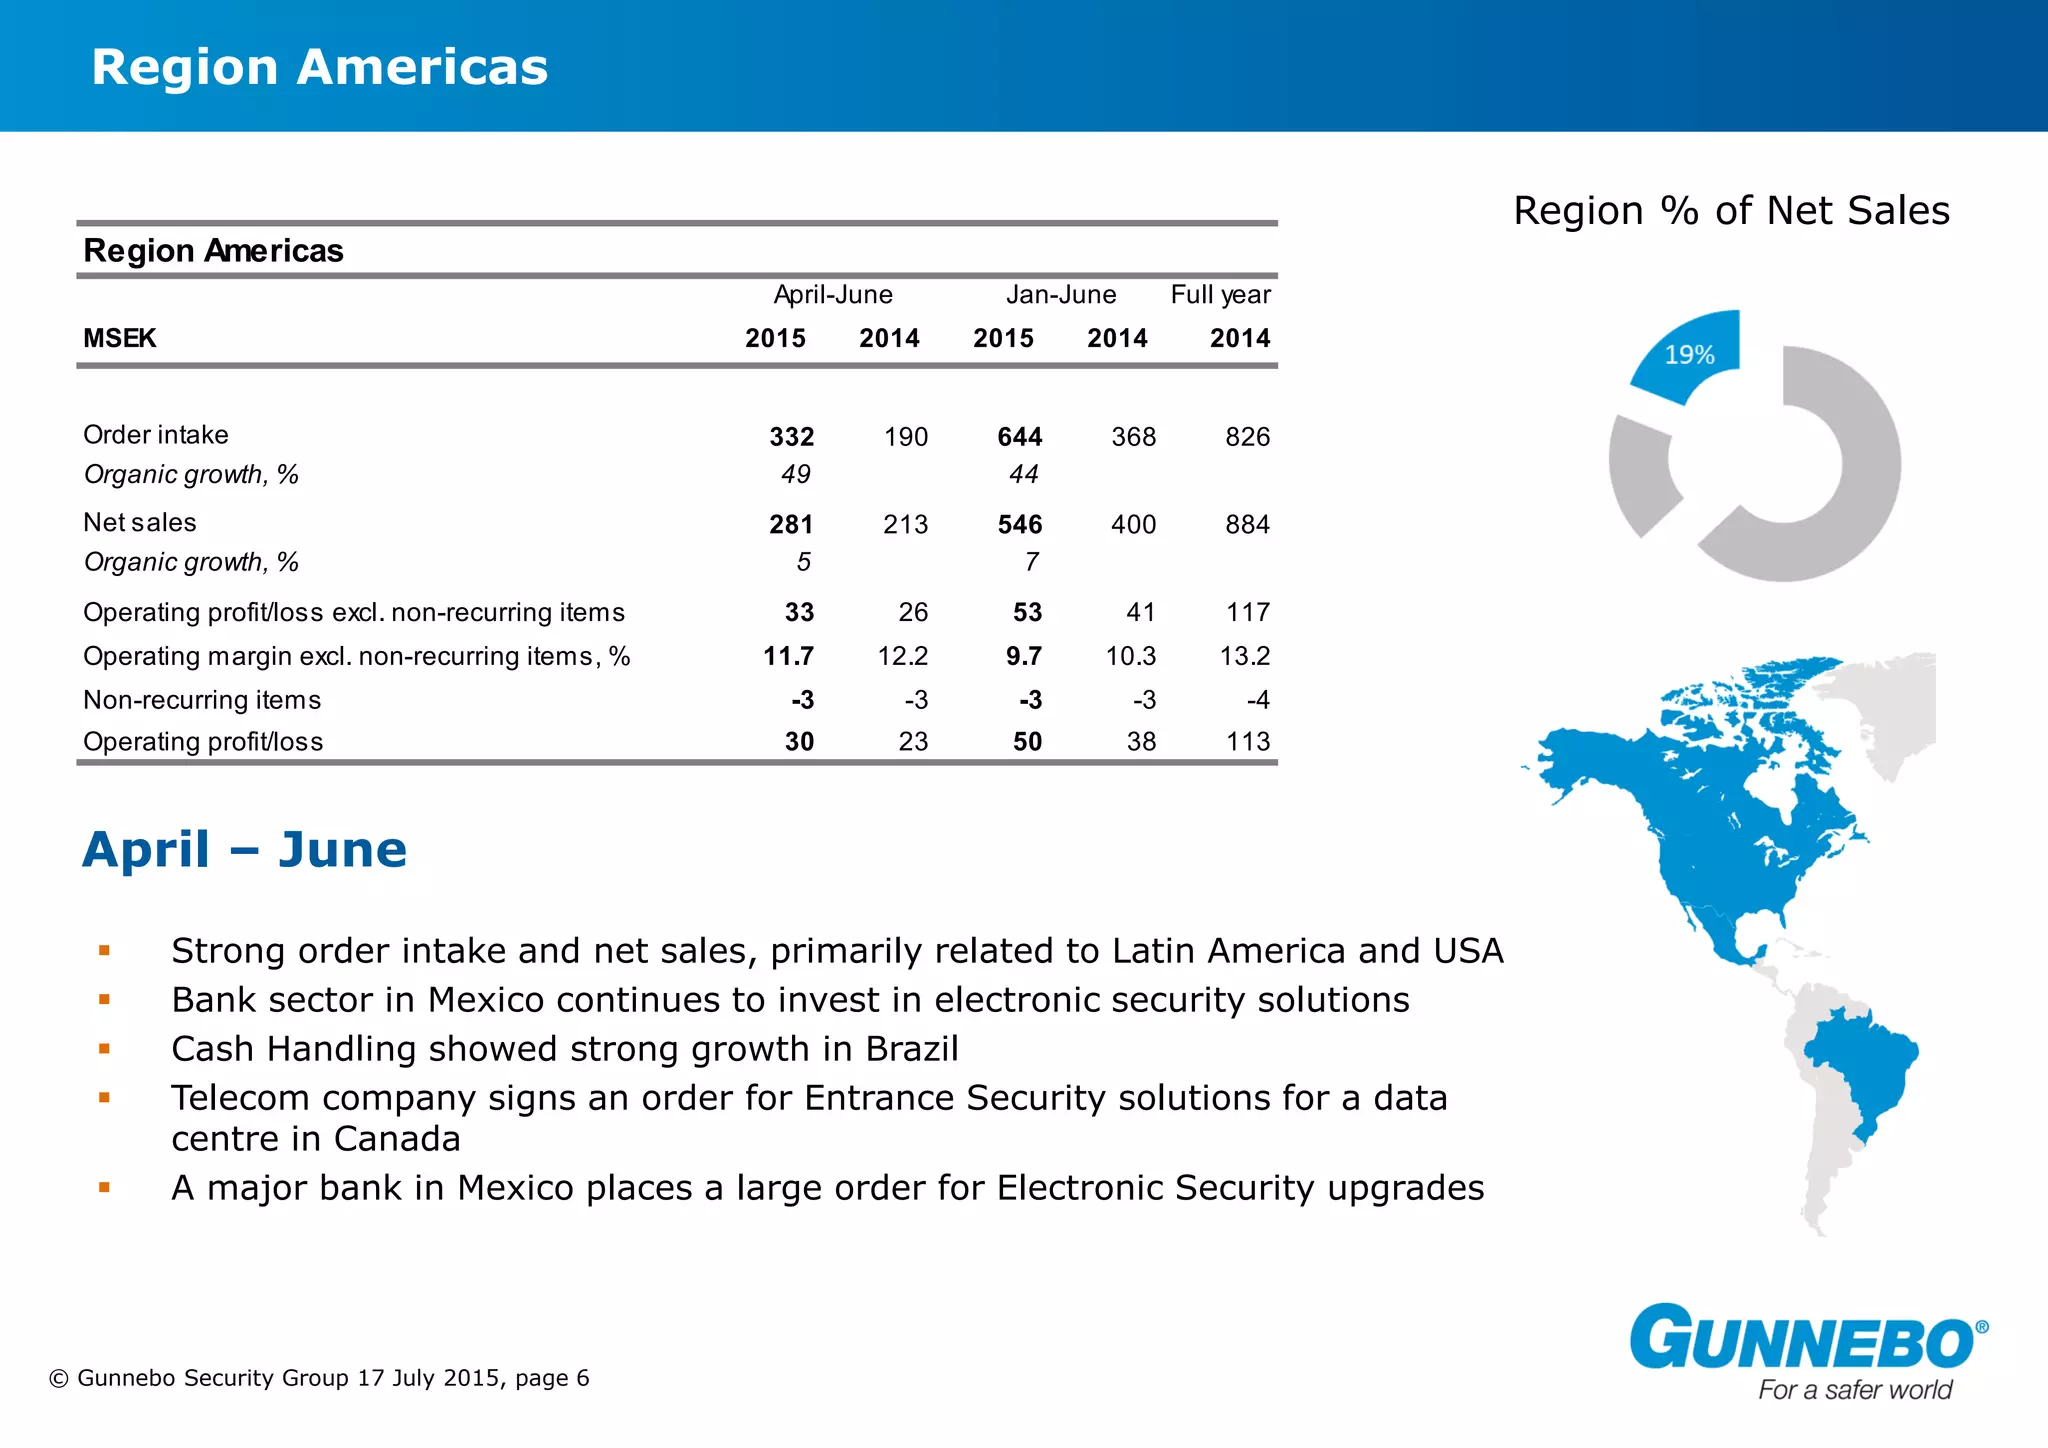
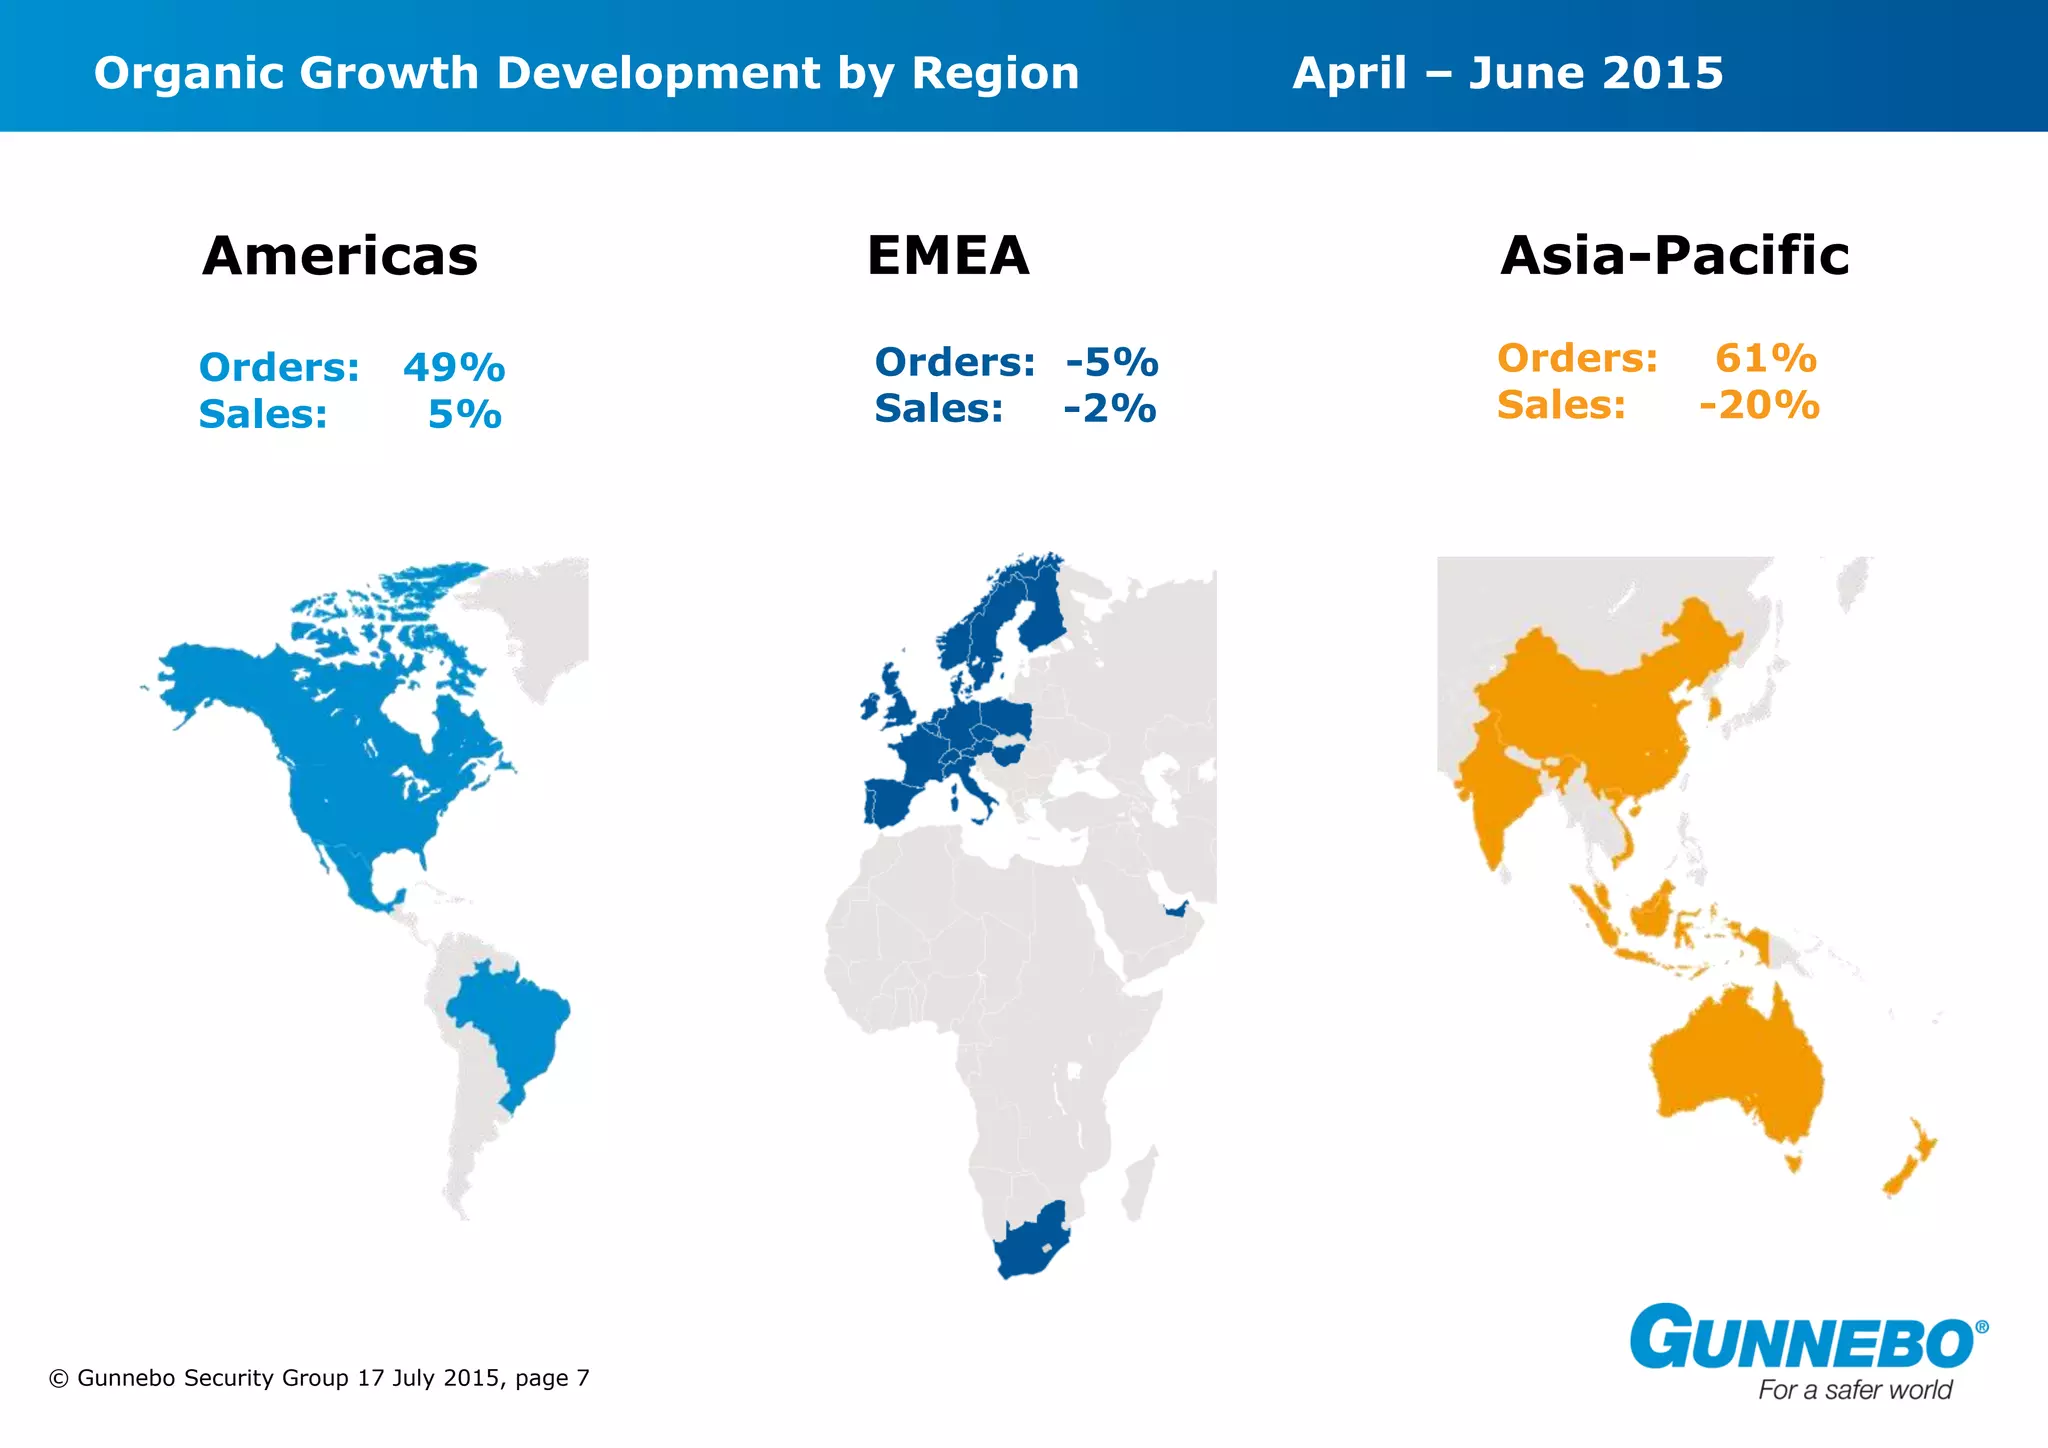

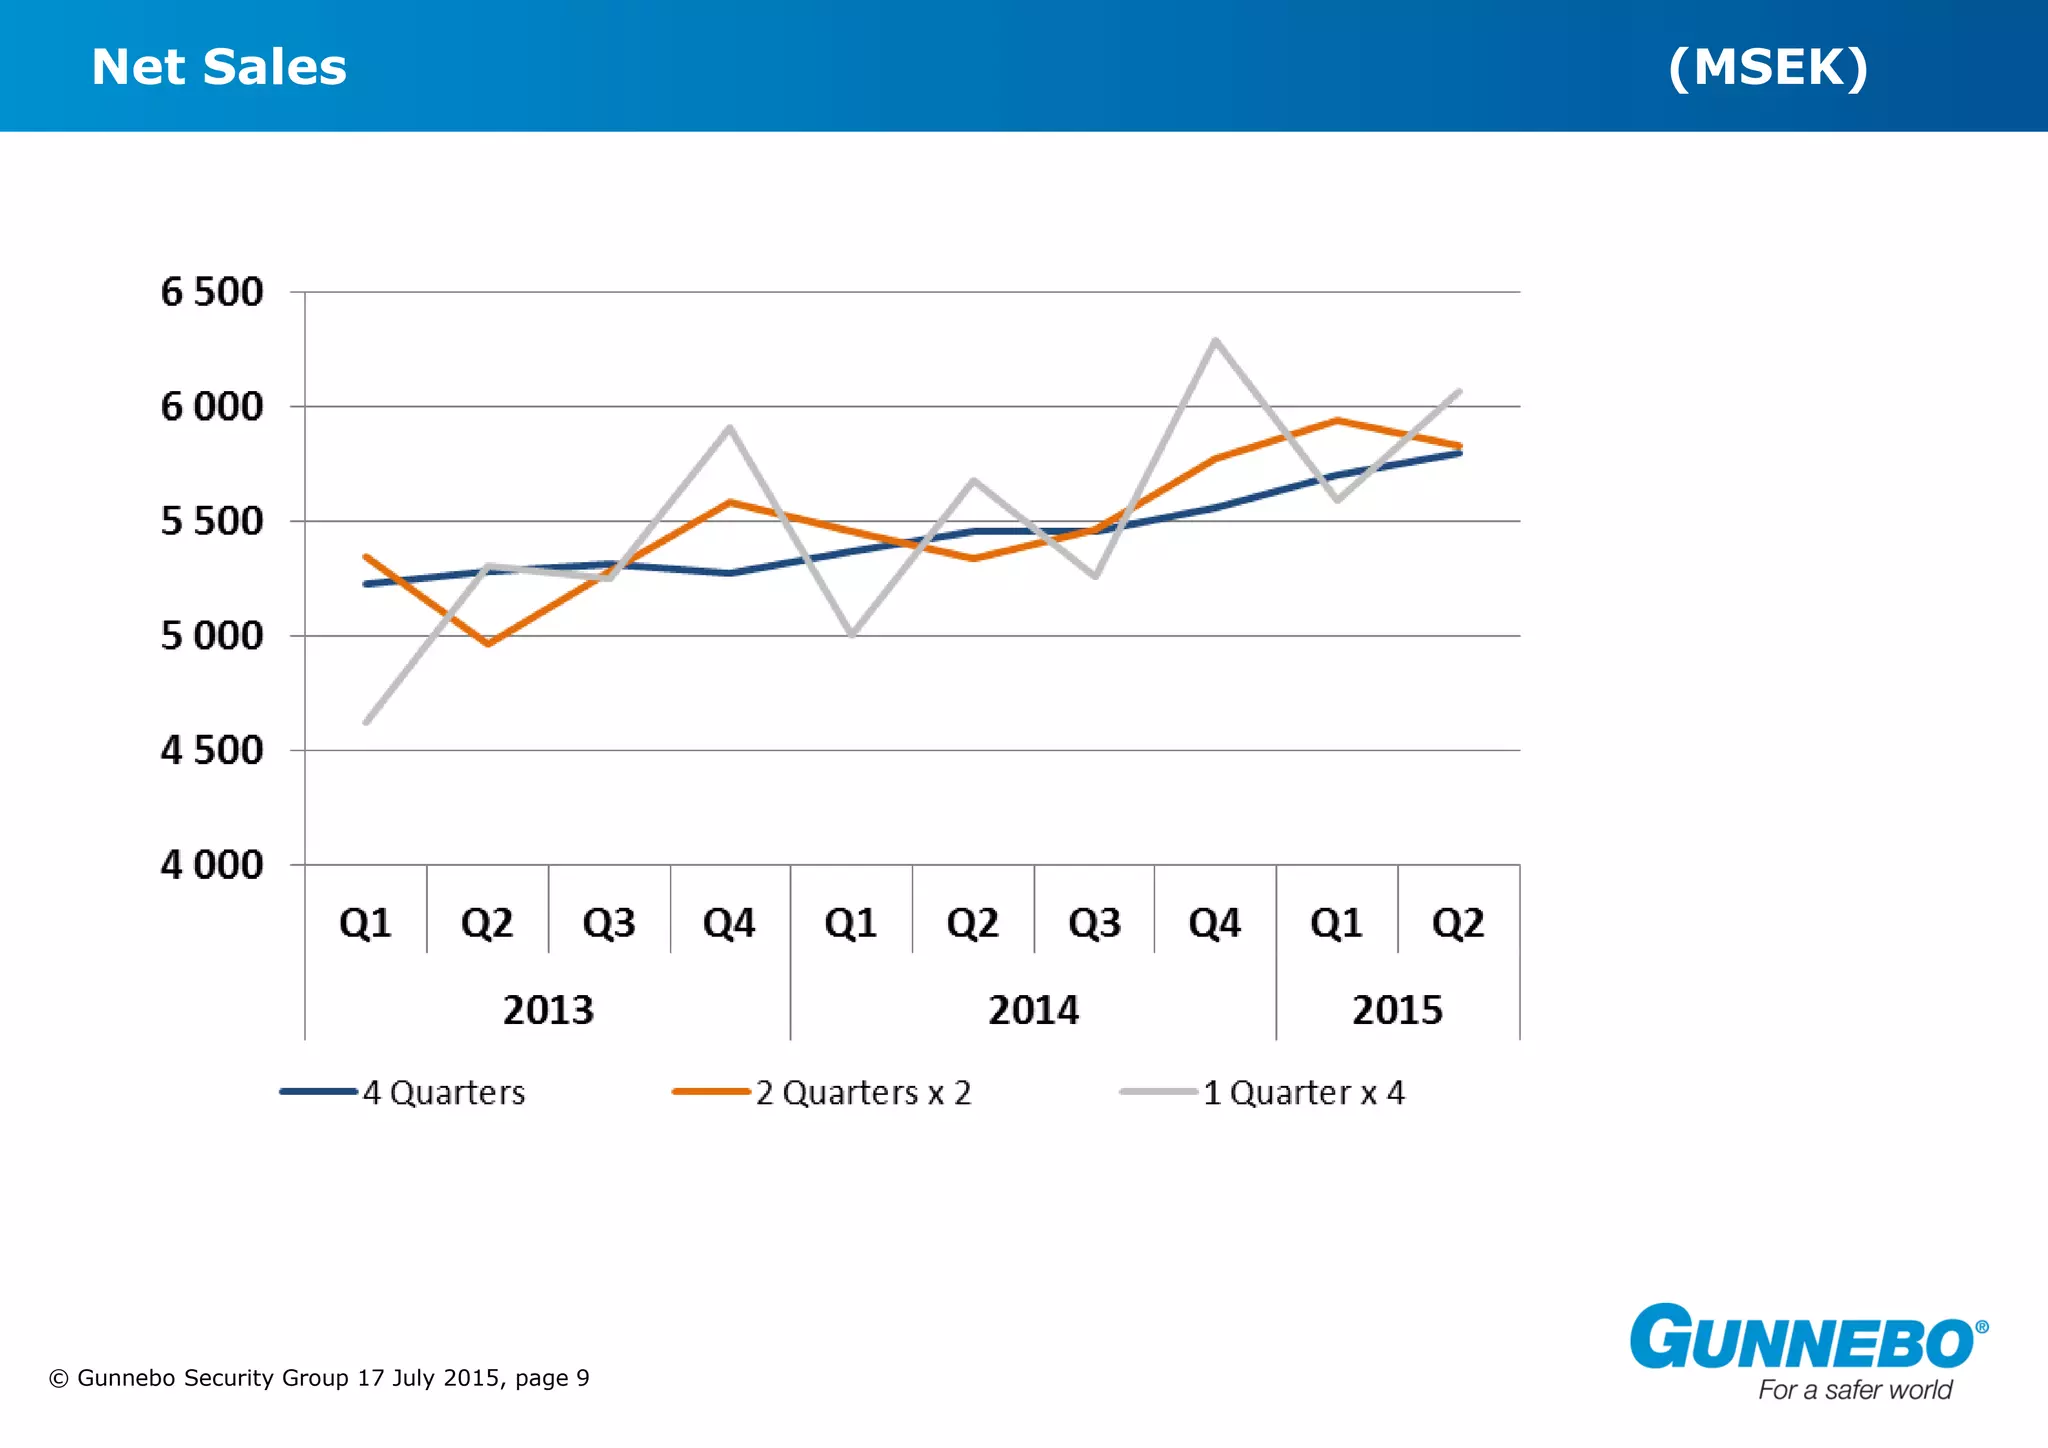
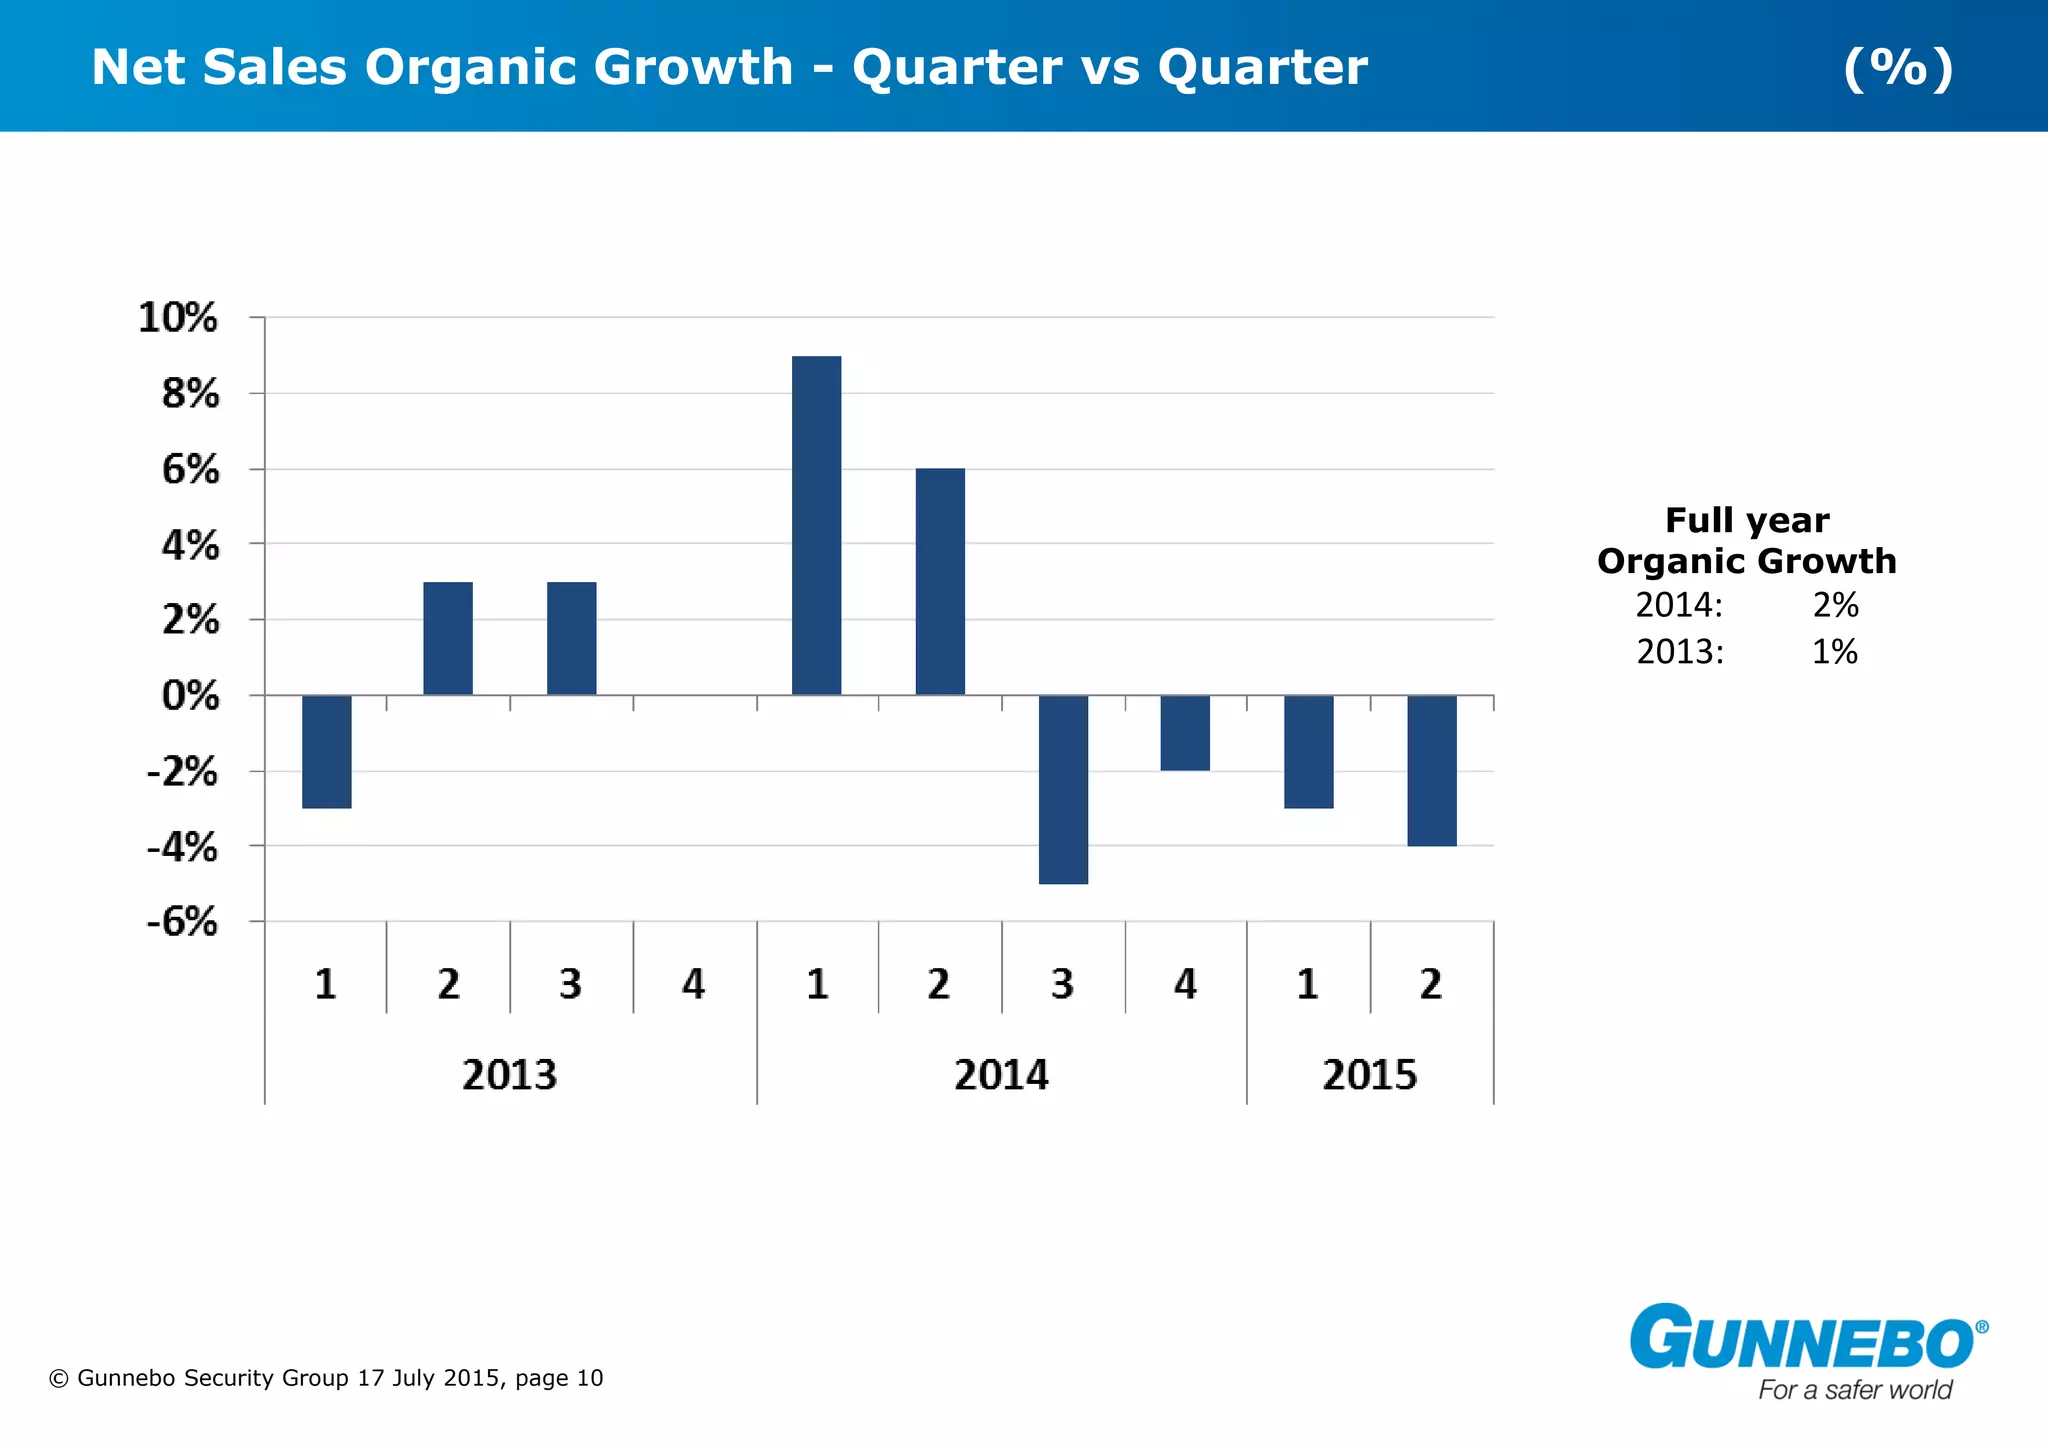
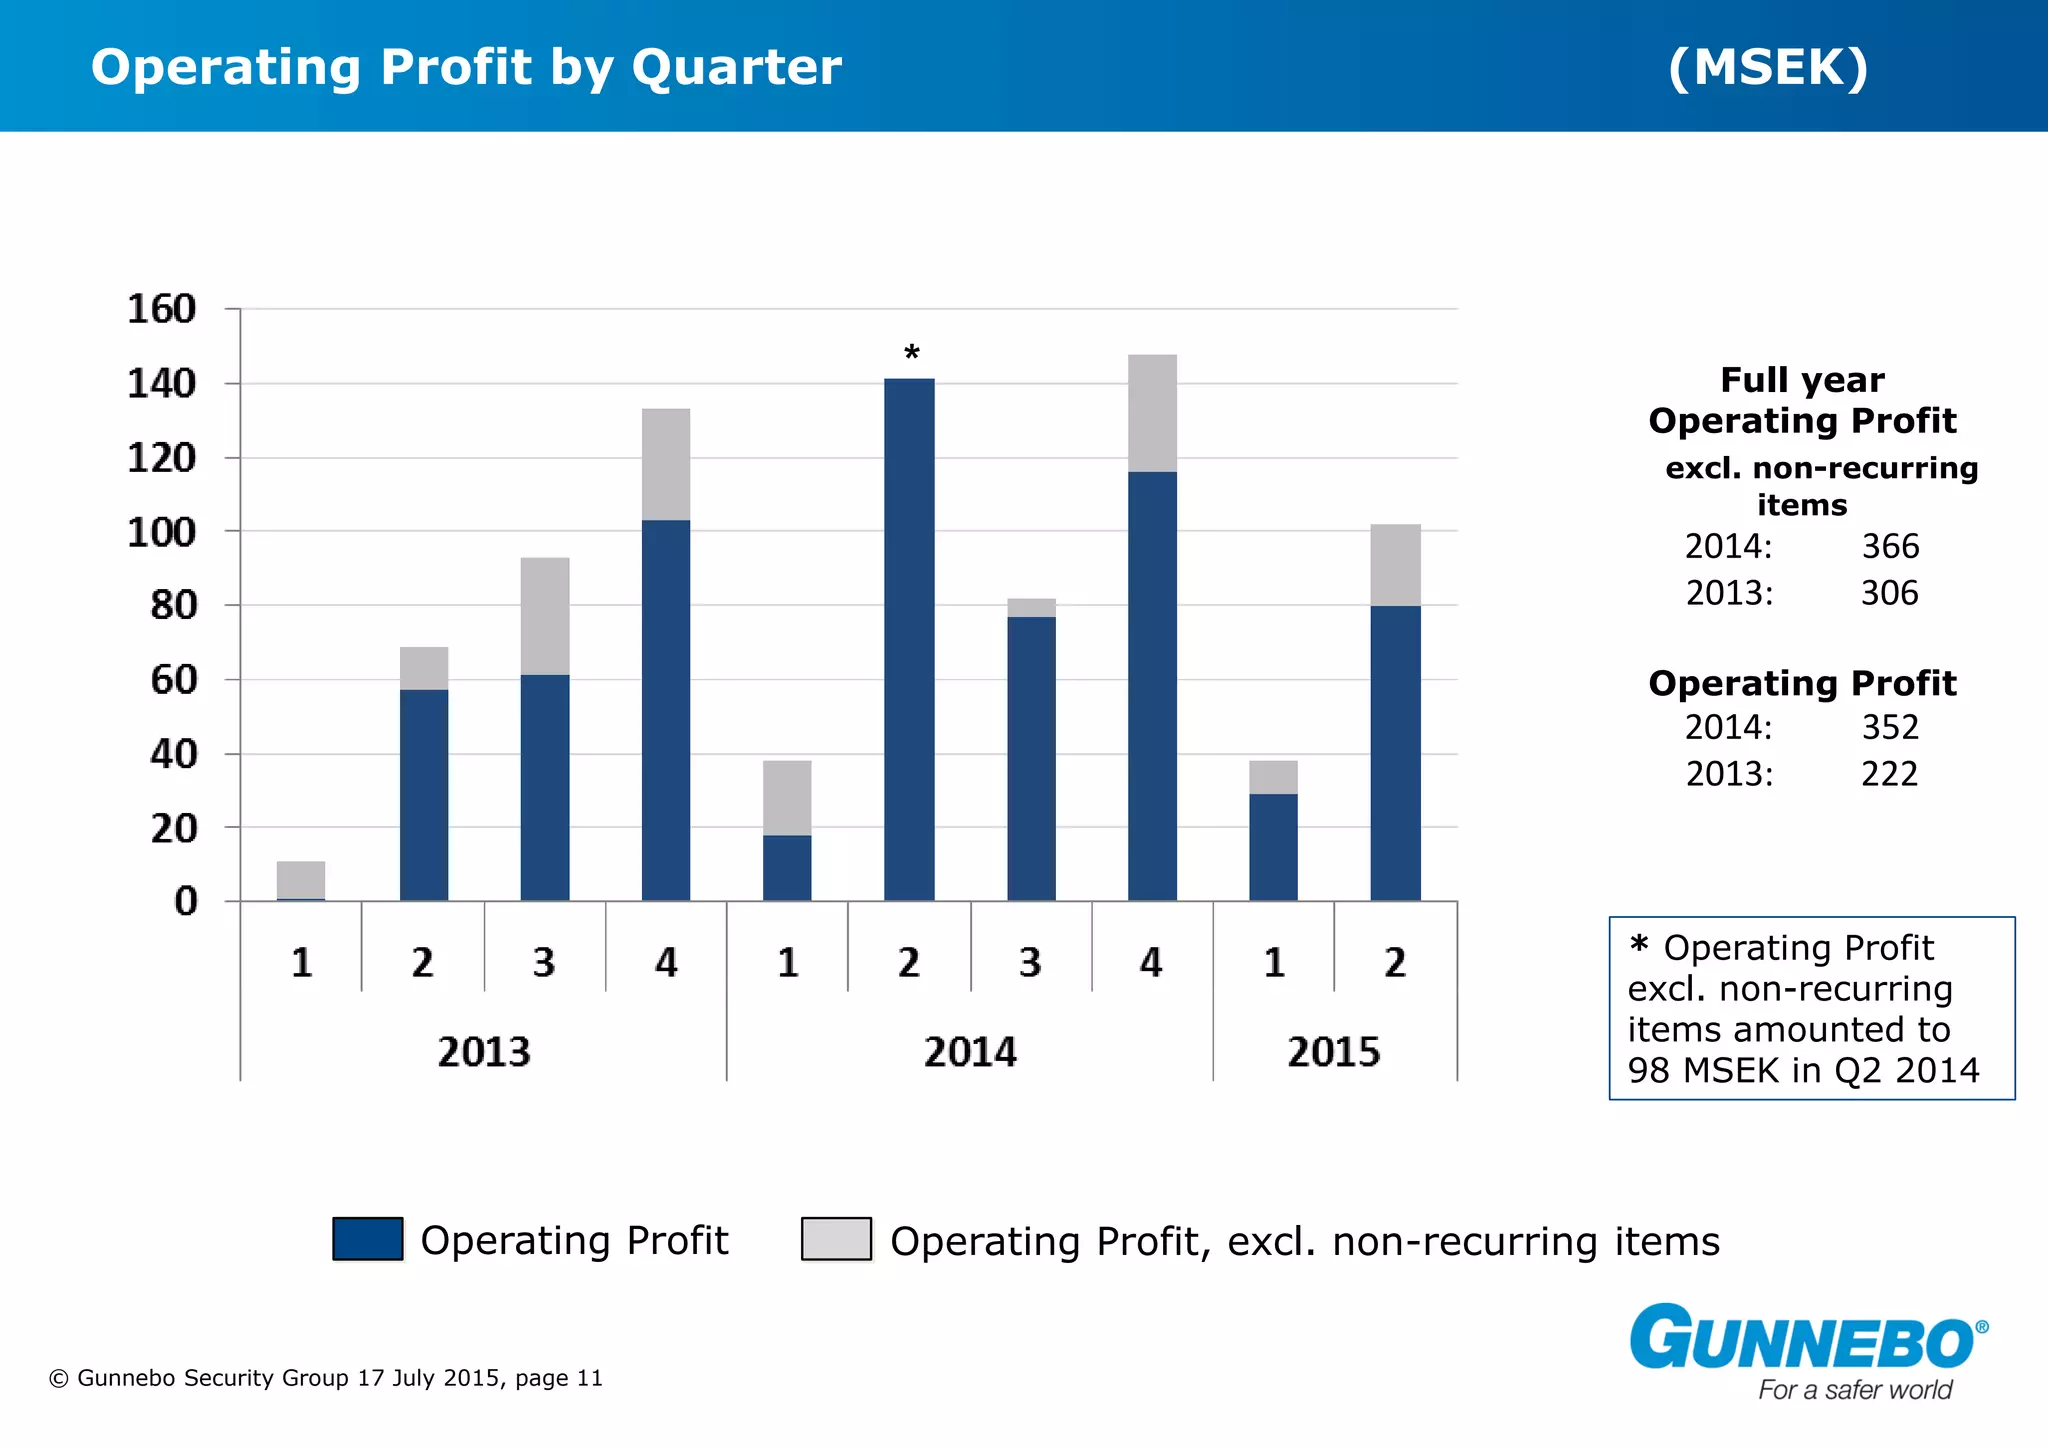
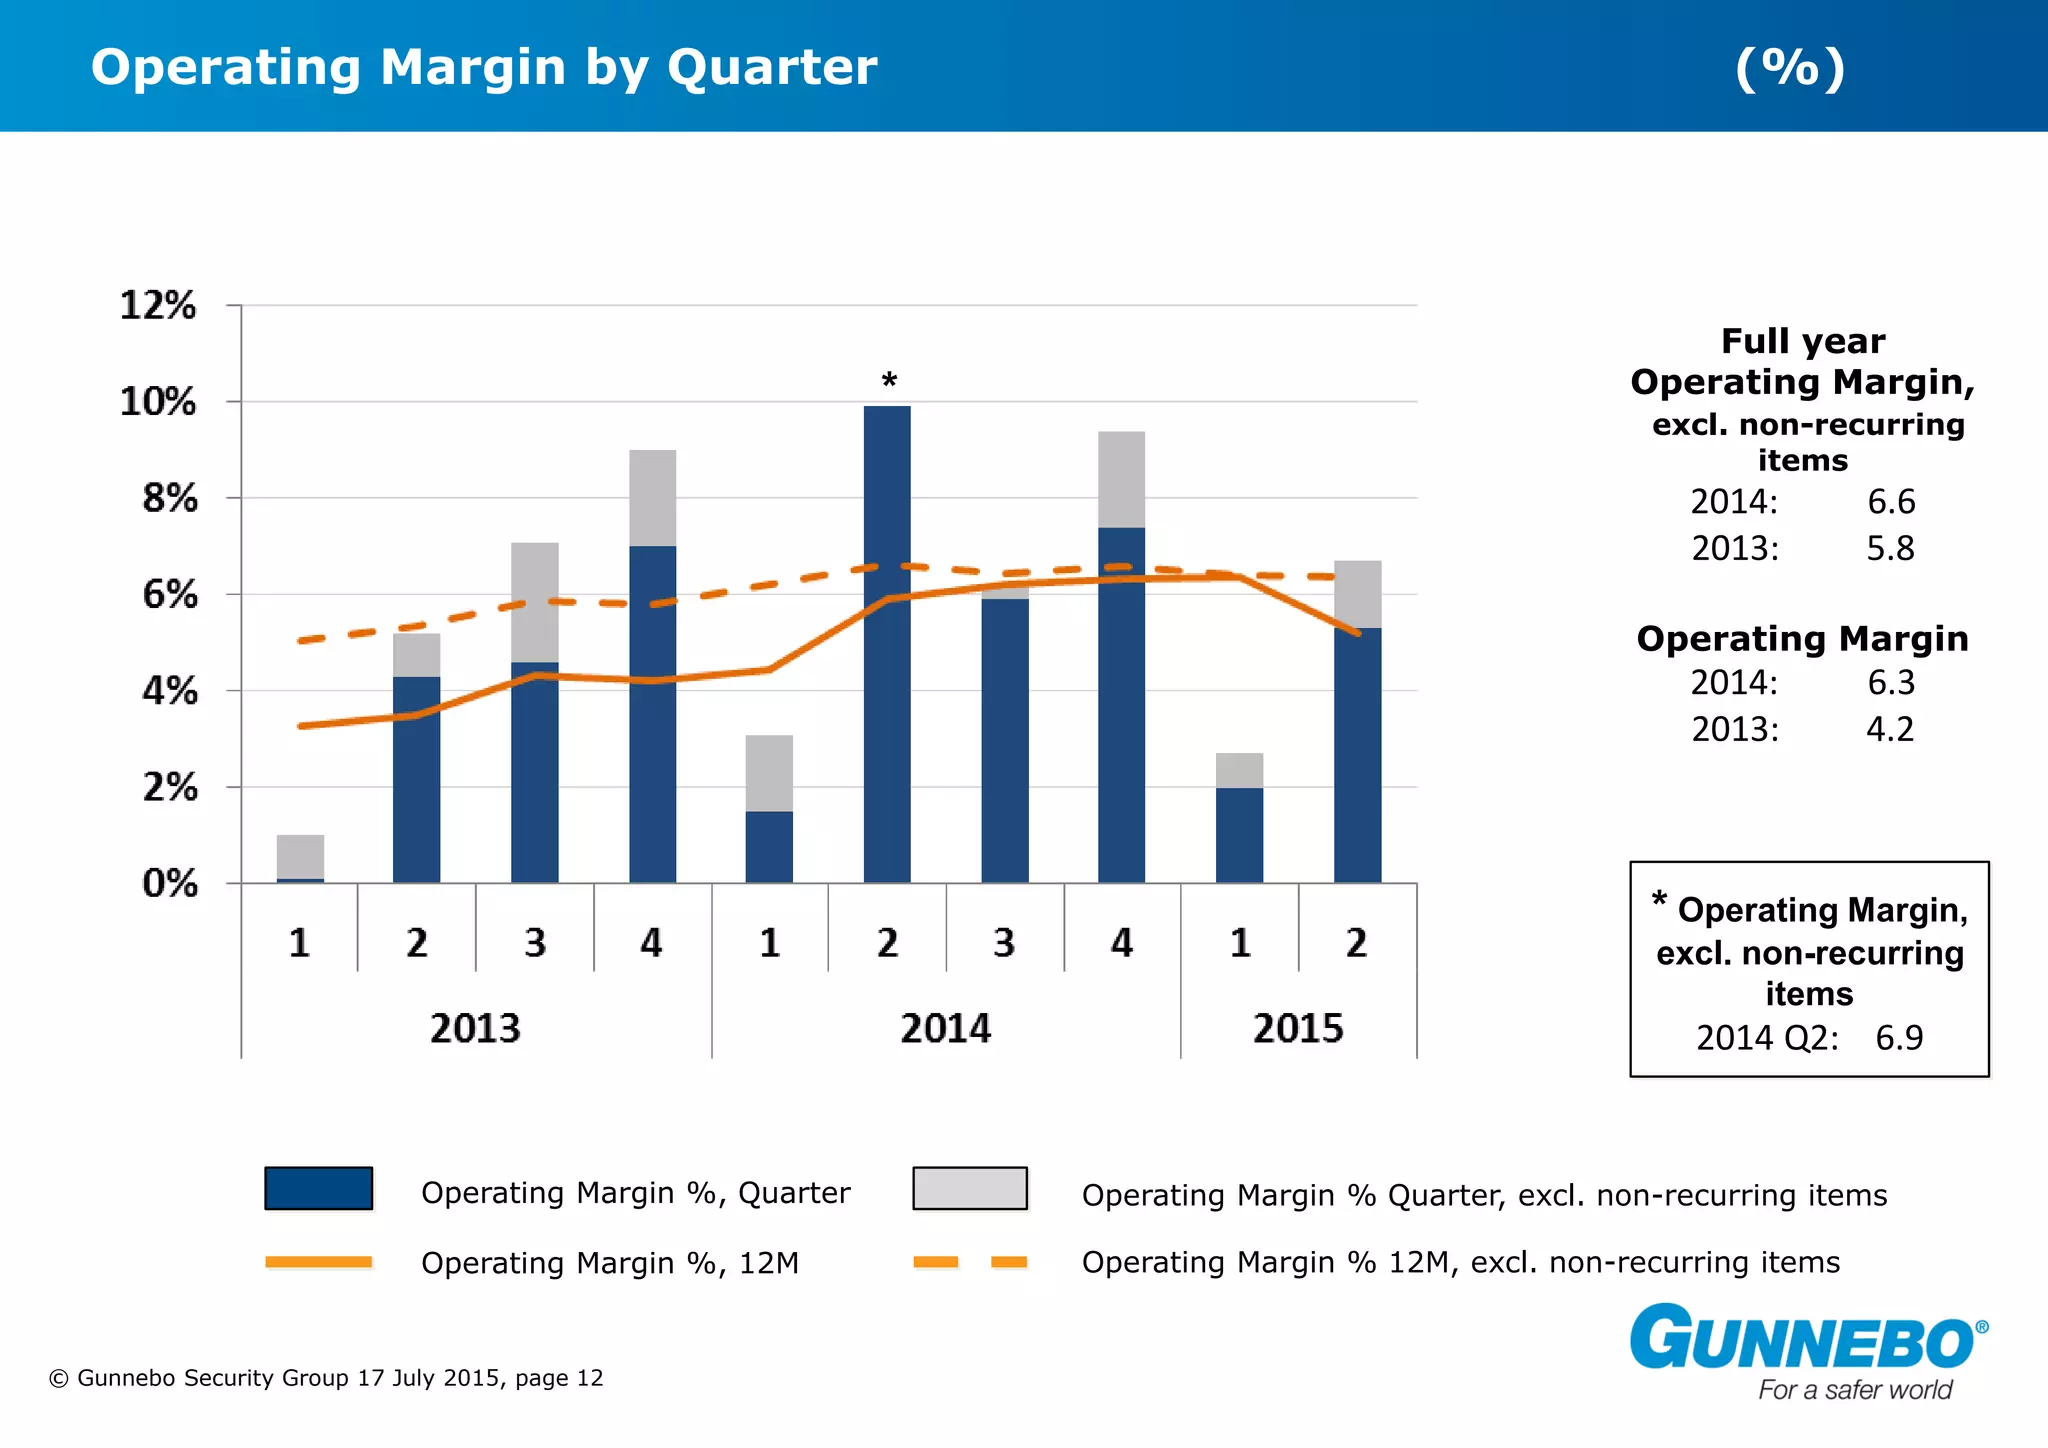


Gunnebo Security Group reported its second quarter results on July 17, 2015. Order intake increased 14% organically compared to the previous year. Net sales decreased 4% organically due to weak sales in Asia Pacific and parts of India. EBIT excluding non-recurring items was 102 MSEK and the operating margin was 6.7%. By region, order intake grew strongly in Asia Pacific and Americas but declined in EMEA, while sales growth was mixed.


