Download to read offline

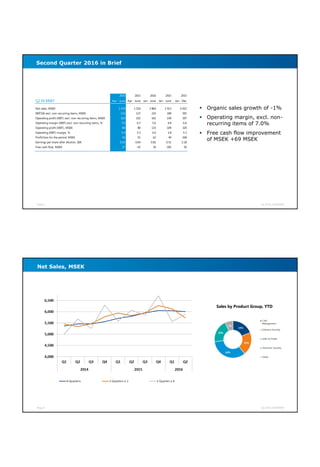
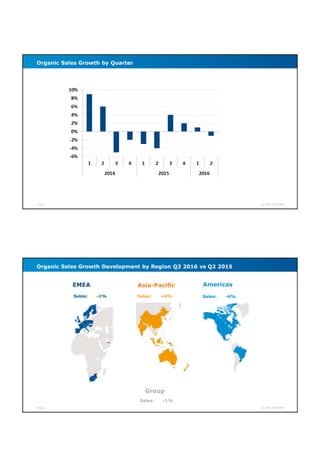
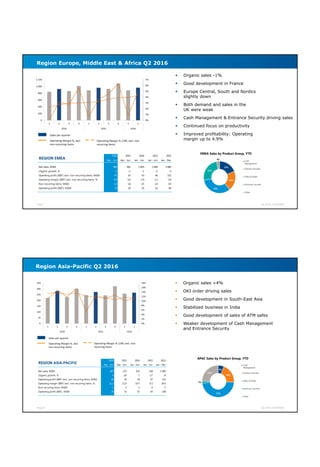
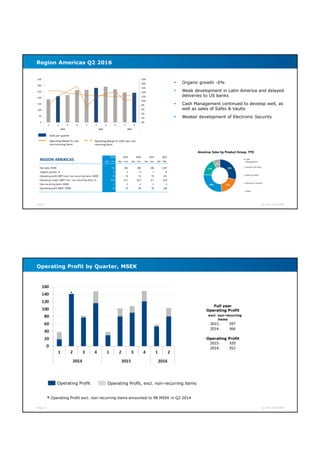
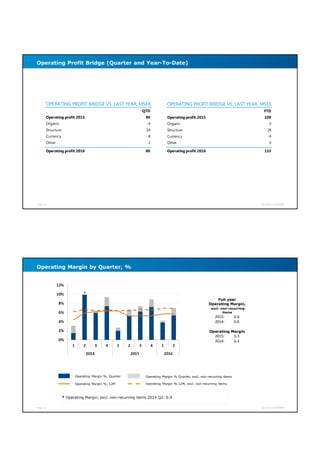
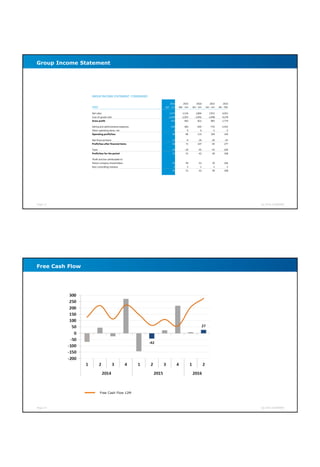
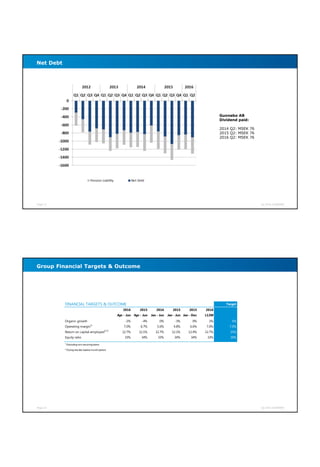

This interim report summarizes Gunnebo's financial performance for the second quarter of 2016. Some key points: - Sales were down 1% organically compared to Q2 2015, with growth in Asia-Pacific offset by declines in EMEA and Americas. - Operating margin excluding non-recurring items was 7.0%, up from 6.7% in Q2 2015. - Cash flow improved significantly with free cash flow of MSEK 27, compared to MSEK -42 in Q2 2015. - By product area, Cash Management and Entrance Security drove growth, while Electronic Security sales weakened.


