Download to read offline


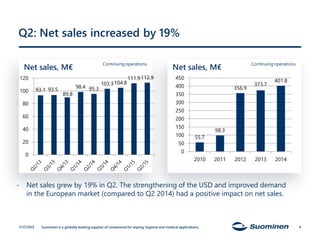
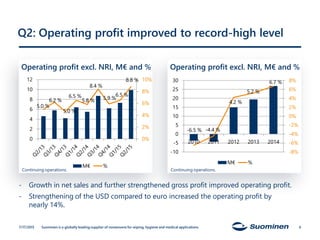


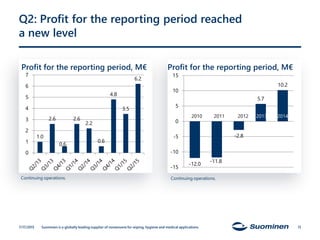


Suominen Corporation reported record results for Q2 2015. Net sales increased 19% to 112.9 million euros due to strengthened demand in Europe and a stronger US dollar. Operating profit excluding non-recurring items reached a record high of 9.9 million euros, up 8.8% compared to Q2 2014, driven by sales growth and an improved gross profit. The company reiterated its outlook for full-year 2015 of increased net sales and operating profit from 2014 levels.


