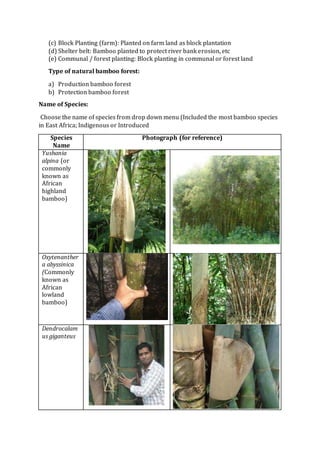
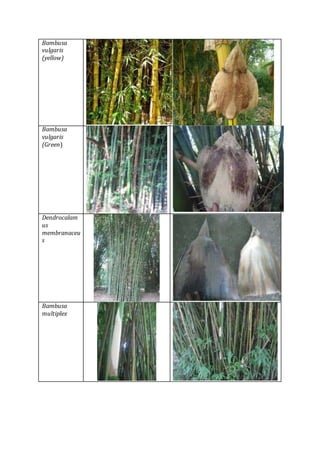
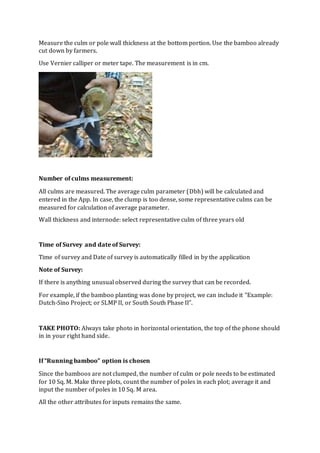
This document provides guidance on using different mapping features (points, polylines, polygons) to document bamboo resources and describes the various attributes to collect for bamboo plantations, natural bamboo forests, harvesting, and disturbances. Points can represent individual clumps, polylines can indicate farm boundaries or rows of clumps, and polygons delineate block plantations. The document outlines attributes like species, age, density, and measurements to record for clumps/culms based on the mapping feature and type of site being documented.
Tree improvement | Techniques & PracticesAnand Charvin
Tree improvement relies on understanding and using variation that naturally occurs in tree populations.
This presentation aims to allow the users to learn about tree improvement and the techniques and practices.
Tree improvement | Techniques & PracticesAnand Charvin
Tree improvement relies on understanding and using variation that naturally occurs in tree populations.
This presentation aims to allow the users to learn about tree improvement and the techniques and practices.
An increasingly industrialized global economy, rapid population growth, land degradation, land use pattern and role of various human activities have led to dramatically increased the pressure on the natural resources such as the available land for sustaining the livelihoods, and with over exploitation and extraction of the natural resources the ecosystems are becoming unsustainable and fragile since last century. The forest and tree cover of India is 78.92 million ha, accounting
for 24.01 per cent of the geographical area. But due to biotic disturbances such as over-grazing, deforestation, shifting cultivation and etc. also effect on regeneration of tree species inside and out side of the forest area.
This presentation provides an overview of a field-based practical exercise that allows students in forestry, ecology and natural resources to develop their understanding of forest stand dynamics. The exercise involves measurement of key tree growth parameters in four even-aged, single-species plantation stands of different age but occupying sites with similar soil and environmental characteristics. The selected stands represent key stages in stand development, from establishment to rotation age for fibre production. In the field, students work in small teams to gather data from an equal number of plots within each stand. Tree parameters include top height, crown diameter, live crown ratio and diameter at breast height. In addition, information on stand density and understorey vegetation is collected. Plot size and number can be varied to suit the constraints of class size and available time, though circular plots of 100 m2 are recommended. In the classroom, data are pooled and analysis focuses on presenting tree and vegetation changes through time. The simplest way of interpreting the data is to prepare graphs and charts for each of the parameters, though more advanced statistical interpretations are possible. The project as outlined here can be modified to meet the needs of different groups, and has been successfully used in undergraduate teaching of silviculture and forest ecology, as well as in postgraduate courses in natural resources management.
Download Paper at URL: http://www.researchgate.net/publication/254307252_The_development_of_even-aged_plantation_forests_an_exercise_in_forest_stand_dynamics
poplar trees field in kurdistan region of iraq.pptxjihad19
kurdish names of poplar trees are used because each information given from shiladiza/kurdistan.
the presentation about cultivation till harvesting of the poplar fields also some kurdish names of the tree are used, as well as the uses of such wood and at the end references are provided
How can bamboo help restore degraded land? With over 30 million hectares spread across the world (FAO 2010), bamboo offers a naturally abundant, strategic tool for poverty alleviation, environmental protection and climate change mitigation. A fact sheet, produced by INBAR and the Global Landscapes Forum.
Guide to Understand the Bamboo Resource:
- How much.?
- Distribution of Bamboo stock
- Major species
- Amount of carbon in bamboo forests
- How much can be extracted
When it comes to measuring biomass and carbon, bamboos are different from trees, mainly because bamboos
are hollow inside, and the correlation between the diameter or the diameter and height of the bamboo culm with bamboo biomass ornet bamboo volume largely depends on culm age, bamboo species and site condition.
This book serves as a guide to provide very specific details for measuring bamboos.
This manual is designed for field surveyors with basic understanding of using a smartphone/tablet and site navigation. The manual provides step-by-step instructions on collecting field data with the mobile client and conducting data analysis with the web platform.
More from INBAR Central Africa Regional Office (16)
Seminar of U.V. Spectroscopy by SAMIR PANDASAMIR PANDA
Spectroscopy is a branch of science dealing the study of interaction of electromagnetic radiation with matter.
Ultraviolet-visible spectroscopy refers to absorption spectroscopy or reflect spectroscopy in the UV-VIS spectral region.
Ultraviolet-visible spectroscopy is an analytical method that can measure the amount of light received by the analyte.
Phenomics assisted breeding in crop improvementIshaGoswami9
As the population is increasing and will reach about 9 billion upto 2050. Also due to climate change, it is difficult to meet the food requirement of such a large population. Facing the challenges presented by resource shortages, climate
change, and increasing global population, crop yield and quality need to be improved in a sustainable way over the coming decades. Genetic improvement by breeding is the best way to increase crop productivity. With the rapid progression of functional
genomics, an increasing number of crop genomes have been sequenced and dozens of genes influencing key agronomic traits have been identified. However, current genome sequence information has not been adequately exploited for understanding
the complex characteristics of multiple gene, owing to a lack of crop phenotypic data. Efficient, automatic, and accurate technologies and platforms that can capture phenotypic data that can
be linked to genomics information for crop improvement at all growth stages have become as important as genotyping. Thus,
high-throughput phenotyping has become the major bottleneck restricting crop breeding. Plant phenomics has been defined as the high-throughput, accurate acquisition and analysis of multi-dimensional phenotypes
during crop growing stages at the organism level, including the cell, tissue, organ, individual plant, plot, and field levels. With the rapid development of novel sensors, imaging technology,
and analysis methods, numerous infrastructure platforms have been developed for phenotyping.
Professional air quality monitoring systems provide immediate, on-site data for analysis, compliance, and decision-making.
Monitor common gases, weather parameters, particulates.
Salas, V. (2024) "John of St. Thomas (Poinsot) on the Science of Sacred Theol...Studia Poinsotiana
I Introduction
II Subalternation and Theology
III Theology and Dogmatic Declarations
IV The Mixed Principles of Theology
V Virtual Revelation: The Unity of Theology
VI Theology as a Natural Science
VII Theology’s Certitude
VIII Conclusion
Notes
Bibliography
All the contents are fully attributable to the author, Doctor Victor Salas. Should you wish to get this text republished, get in touch with the author or the editorial committee of the Studia Poinsotiana. Insofar as possible, we will be happy to broker your contact.
ANAMOLOUS SECONDARY GROWTH IN DICOT ROOTS.pptxRASHMI M G
Abnormal or anomalous secondary growth in plants. It defines secondary growth as an increase in plant girth due to vascular cambium or cork cambium. Anomalous secondary growth does not follow the normal pattern of a single vascular cambium producing xylem internally and phloem externally.
hematic appreciation test is a psychological assessment tool used to measure an individual's appreciation and understanding of specific themes or topics. This test helps to evaluate an individual's ability to connect different ideas and concepts within a given theme, as well as their overall comprehension and interpretation skills. The results of the test can provide valuable insights into an individual's cognitive abilities, creativity, and critical thinking skills
Toxic effects of heavy metals : Lead and Arsenicsanjana502982
Heavy metals are naturally occuring metallic chemical elements that have relatively high density, and are toxic at even low concentrations. All toxic metals are termed as heavy metals irrespective of their atomic mass and density, eg. arsenic, lead, mercury, cadmium, thallium, chromium, etc.
Nutraceutical market, scope and growth: Herbal drug technologyLokesh Patil
As consumer awareness of health and wellness rises, the nutraceutical market—which includes goods like functional meals, drinks, and dietary supplements that provide health advantages beyond basic nutrition—is growing significantly. As healthcare expenses rise, the population ages, and people want natural and preventative health solutions more and more, this industry is increasing quickly. Further driving market expansion are product formulation innovations and the use of cutting-edge technology for customized nutrition. With its worldwide reach, the nutraceutical industry is expected to keep growing and provide significant chances for research and investment in a number of categories, including vitamins, minerals, probiotics, and herbal supplements.
What is greenhouse gasses and how many gasses are there to affect the Earth.moosaasad1975
What are greenhouse gasses how they affect the earth and its environment what is the future of the environment and earth how the weather and the climate effects.
Earliest Galaxies in the JADES Origins Field: Luminosity Function and Cosmic ...Sérgio Sacani
We characterize the earliest galaxy population in the JADES Origins Field (JOF), the deepest
imaging field observed with JWST. We make use of the ancillary Hubble optical images (5 filters
spanning 0.4−0.9µm) and novel JWST images with 14 filters spanning 0.8−5µm, including 7 mediumband filters, and reaching total exposure times of up to 46 hours per filter. We combine all our data
at > 2.3µm to construct an ultradeep image, reaching as deep as ≈ 31.4 AB mag in the stack and
30.3-31.0 AB mag (5σ, r = 0.1” circular aperture) in individual filters. We measure photometric
redshifts and use robust selection criteria to identify a sample of eight galaxy candidates at redshifts
z = 11.5 − 15. These objects show compact half-light radii of R1/2 ∼ 50 − 200pc, stellar masses of
M⋆ ∼ 107−108M⊙, and star-formation rates of SFR ∼ 0.1−1 M⊙ yr−1
. Our search finds no candidates
at 15 < z < 20, placing upper limits at these redshifts. We develop a forward modeling approach to
infer the properties of the evolving luminosity function without binning in redshift or luminosity that
marginalizes over the photometric redshift uncertainty of our candidate galaxies and incorporates the
impact of non-detections. We find a z = 12 luminosity function in good agreement with prior results,
and that the luminosity function normalization and UV luminosity density decline by a factor of ∼ 2.5
from z = 12 to z = 14. We discuss the possible implications of our results in the context of theoretical
models for evolution of the dark matter halo mass function.
Remote Sensing and Computational, Evolutionary, Supercomputing, and Intellige...University of Maribor
Slides from talk:
Aleš Zamuda: Remote Sensing and Computational, Evolutionary, Supercomputing, and Intelligent Systems.
11th International Conference on Electrical, Electronics and Computer Engineering (IcETRAN), Niš, 3-6 June 2024
Inter-Society Networking Panel GRSS/MTT-S/CIS Panel Session: Promoting Connection and Cooperation
https://www.etran.rs/2024/en/home-english/
Observation of Io’s Resurfacing via Plume Deposition Using Ground-based Adapt...Sérgio Sacani
Since volcanic activity was first discovered on Io from Voyager images in 1979, changes
on Io’s surface have been monitored from both spacecraft and ground-based telescopes.
Here, we present the highest spatial resolution images of Io ever obtained from a groundbased telescope. These images, acquired by the SHARK-VIS instrument on the Large
Binocular Telescope, show evidence of a major resurfacing event on Io’s trailing hemisphere. When compared to the most recent spacecraft images, the SHARK-VIS images
show that a plume deposit from a powerful eruption at Pillan Patera has covered part
of the long-lived Pele plume deposit. Although this type of resurfacing event may be common on Io, few have been detected due to the rarity of spacecraft visits and the previously low spatial resolution available from Earth-based telescopes. The SHARK-VIS instrument ushers in a new era of high resolution imaging of Io’s surface using adaptive
optics at visible wavelengths.
Observation of Io’s Resurfacing via Plume Deposition Using Ground-based Adapt...
Guidelines for bamboo data measurement v1.1.2
1. Criteria for select a point or polyline or polygon
Point:
Point is commonly used for single or few bamboo clumps in an individual households
and in farm land.
Example pictures are as below:
Polyline:
Polyline can be commonly used for farm boundary planting, steam or river bank
planting. There can be single row of bamboo clumps in a line or two or three rows of
bamboo in a line
2. Polygon:
Polygon can be generally used for block planting in a farm (like a plantation). Pictures
illustrating this is shown below
3. Type of Survey:
There are three options on the type of survey
1) Plantation: Plantation is used for quantification or inventory of bamboo in
homesteads and farm land. This will be the most commonly used – as the
primary objective of the bamboo application is to quantify the bamboo resources
in a particular area.
2) Natural bamboo forest: Natural bamboo forest active use area (harvest and
management). Bamboo forest is forest that canopy cover consists of at least 50%
of bamboo.
3) Barren land for bamboo plantation: Areas of barren land that can be used for
establishment of bamboo plantation
PLANTATION/ NATURAL FOREST/ Barren land
Administrative details:
Select from the drop down list: The country, regions/ provinces are already included.
You cannot do manual entry as it creates error in data analysis.
District and other administrative units: You need to manually input the text of
administrative units. Please ensure inputting right spelling for all the entries.
Name of Owner: Enter the full name of owner manually.
Telephone Number: Enter the telephone number of owner manually. No need to put in
country code. This attribute feature is optional
Land tenure or Land Certificate: There are three options – Yes or No or under
processing. Choose from the drop down Menu.
FSC certificate: There are three options – Yes or No or under processing. Choose from
the drop down Menu.
Site Condition: There are three options (a) Mountainous with steep slope; (b) gentle
slope and (c) flat land (Choose one of them from the drop down menu according to the
site condition
Type of Soil: There are four options (a) rocky soil); (b) clayey soil; (c) sandy soil; (d)
loamy soil. Choose the appropriate soil from the drop down menu. Pictures are shown
below to illustrate the soil type for your reference:
4. Rocky Soil Loamy soil
Clayey soil Sandy Soil
Type of Bamboo:
In the drop down menu there are two options
(a) Clump bamboo: Most of the species in Africa – Yushania alpina, Oxytenanthera
abyssinica, Bambusa vulgaris, Dendrocalamus asper, Dendrocalamus giganteus,
etc are belonging to clumping variety. It is alternatively called as sympodial
bamboo.
(b) Running bamboo: This is monopodial bamboo; applies to Phyllostatchys species
found in Madagascar, Uganda (imported from China). It is also called monopodial
bamboo
Pictures of clumping bamboo and running bamboo are shown below for your reference:
5. Clumping Bamboo (Above)
Running bamboo
If Chosen, clump bamboo
Age of bamboo forest
Age of plantation means the age of bamboo clumps. There are different options
(1,2,3,4,5,6,7-10, 11-20, 21-30, 30+years). Choose form the drop down menu. For
example, if the bamboo planting was undertaken in current year. Choose ‘1’.
Age of natural forest: select N/A (Not Available)
Type of plantation:
There are different options in drop down menu
(a) Household Planting: One of few bamboo clumps planted in their household or in
homestead or in their farm.
(b) Farm Boundary planting: Bamboo planted on farm boundaries
6. (c) Block Planting (farm): Planted on farm land as block plantation
(d) Shelter belt: Bamboo planted to protect river bank erosion, etc
(e) Communal / forest planting: Block planting in communal or forest land
Type of natural bamboo forest:
a) Production bamboo forest
b) Protection bamboo forest
Name of Species:
Choose the name of species from drop down menu (Included the most bamboo species
in East Africa; Indigenous or Introduced
Species
Name
Photograph (for reference)
Yushania
alpina (or
commonly
known as
African
highland
bamboo)
Oxytenanther
a abyssinica
(Commonly
known as
African
lowland
bamboo)
Dendrocalam
us giganteus
11. Bambusa
bambos
Valiha diffusa
A. Small area, (estimation of the area is about 1 ha)
Number of Clumps: Count the number of clumps in the mapped area and input it
What is a clump? : A cluster of bamboo poles which are inter-connected or belonging to
a single bamboo plant
.
Average Clump Area: Identify the representative clump among the different clumps in
a point, polyline or polygon and measure the area.
12. Clump Area = Length X Width (LX W). Once the input of L X W is done, the application
automatically calculates the area of the clump. Please note, the measurement are in
meters.
Approx. number of poles / culm per clump of year 1
Approx. number of poles / culm per clump of year 2
Approx. number of poles / culm per clump of year 3
Approx. number of poles / culm per clump of year 3+
What is a culm: Individual or one bamboo pole in a clump is called as culm.
In the representative clump, count the number of bamboo poles / culm of Year 1, 2, 3.
and 3+ years and input it in the respective data entry tabs.
Year 1: Newly emerged bamboo poles (between Age 0 -1 years)
Year 2: Bamboo poles emerged before oneyear (between 1-2 years)
Year 3: Bamboo poles emerged before two years (between 2-3 years)
Year 3+: Bamboo poles emerged before three years (above 3 years of age)
If the bamboo planting was done in current year, you will not have to enter the data of
number of bamboo poles or culms of year 2, Year 3, year 3, Year 3+.
How to identify Year 1, 2, 3 and 3+:
Younger bamboo poles of Year 1 is mostly located on the outer periphery. It is having
culm sheath, white hairs and bright and appealing in color. Year 2 bamboo poles are
located on the inside perimeter of clump, it is dull in color and have slightly weathered
having slight moulds growth on the outer skin. It is dull coloured than year 1 bamboo
pole and less appealing. Year 3 and year 3+ bamboo poles are generally located on
center of clumps, due to weathering and environmental factors, it has high degree of
moulds and fungal growth on surface. As a thumb rule, older the bamboo poles, it has
more mould and fungal growth; thereby more uglier on the outside surface.
13. Year 1 (<1 Year) Year 2 (1-2 year) Year 3 (2-3 years) Year 3+
Average Clump Diameter:
From the drop-down menu, select the estimated or measure the diameter of clump.
Average Clump Height:
This is the height of the clump. Please note in many bamboo species, the bamboo poles
are bent down from the top, so, after estimating few bamboo clumps, input the height of
the clump.
Use the bamboo poles which are cut down by the farmers to measure average clump
height. Alternatively, an altimeter can be used.
Average culm / pole height:
Use the bamboo poles cut down by the farmers to measure the average pole height.
Average culm or pole diameter (cm).
Measurement is in Cm. The measurement can be taken at DBH or 150 cm height.
14. Circumference can be measured and the converted into Diameter
Option 1: Diameter = circumference / Pi or 3.14
Option 2: Just measure the diameter using calliper or meter tape
Culm / Pole internodal length (cm)
If there are culms / pole already cut down by the farmers, select he longest and measure
culm intermodal length
Culm / pole wall thickness:
15. Measure the culm or pole wall thickness at the bottom portion. Use the bamboo already
cut down by farmers.
Use Vernier calliper or meter tape. The measurement is in cm.
Number of culms measurement:
All culms are measured. The average culm parameter (Dbh) will be calculated and
entered in the App. In case, the clump is too dense, some representative culms can be
measured for calculation of average parameter.
Wall thickness and internode: select representative culm of three years old
Time of Survey and date of Survey:
Time of survey and Date of survey is automatically filled in by the application
Note of Survey:
If there is anything unusual observed during the survey that can be recorded.
For example, if the bamboo planting was done by project, we can include it “Example:
Dutch-Sino Project; or SLMP II, or South South Phase II”.
TAKE PHOTO: Always take photo in horizontal orientation, the top of the phone should
in in your right hand side.
If “Running bamboo” option is chosen
Since the bamboos are not clumped, the number of culm or pole needs to be estimated
for 10 Sq. M. Make three plots, count the number of poles in each plot; average it and
input the number of poles in 10 Sq. M area.
All the other attributes for inputs remains the same.
16. B. Large area(great than 1 ha)
Lay out some sample plots of 100 m2 each for measurement and calculation of average
parameters: (number of sample plots depends on the size and heterogeneity of the
areas)
Number of clump per ha:
Average clump diameter:
Average clump height:
Average number of culms per clump:
Average culm height
Average Dbh:
Average wall thickness:
Average internode:
HARVESTING.
This is mainly used by industries / entrepreneurs who purchase bamboo from farmers
to documentthe benefits to farmersdueto bamboo polesupply. This is mainly usedwhen
the supply chain is established, and the industries are procuring bamboo from the
farmers.
All the other attributes are same as “plantation”
Data specific to harvesting are explained below:
Approx. Date of harvesting: Input the approximate date of harvesting by selecting the
date, month and year from the menu.
Method of harvesting: There are two options in drop down menu (a) mature pole (3+
years harvesting) or (b) random harvesting.
Average number of culms harvested per year: This is equivalent to the number of
bamboo poles purchased from the farmers.
Average cost of culm /poles (in respective currency): Input the cost of bamboo pole
in your currency. No need to include currency before the numbers.
Condition of clump: There are two options, (a) healthy and (b) unhealthy. Input it
based on your observation. If the clumps have good proposition of year 1, Year 2 and
Year 3 and the emerging new poles are of good size (similar to old ones), then the
clumps are healthy or the clumps are unhealthy. There should be more number of
younger poles (Year 1 and Year 2) and less number of bamboo poles of more than 3
years standing in the clumps
17. Silvicultural treatment: Based on observation and information from farmers, input the
silvicultural treatments the farmers do from the drop down menu
Time of Survey and date of Survey:
Time of survey and Date of survey is automatically filled in by the application
Note of Survey:
If there is anything unusual observed during the survey that can be recorded.
Alternatively, this can also be used for “sustainable management observation”. Map the
area of forest / plantation brought under sustainable management and harvesting and
enter the attribute data.
Disturbance:
Disturbance data collection is included to document the disturbance to bamboo
plantation.
Most of the attribute data to be collected are same as in “plantation”. The specific
attributes or data are explained as below:
Total Area (Sq. M): In the case of point, measure the clump area; in the case of polyline,
the application automatically calculates are length; the user need to input the width, so
the area is automatically calculated. In the case of polygon, just walk around the area of
disturbance, after clicking the track log, the area of disturbance is automatically
calculated.
Approx. Date of Disturbance: Enter the date of disturbance
Type of disturbance: choose the type of disturbance from the drop down menu
Time of Survey and date of Survey:
Time of survey and Date of survey is automatically filled in by the application
Note of Survey:
If there is anything unusual observed during the survey that can be recorded.