Data recording sheets
•Download as DOCX, PDF•
0 likes•65 views

This file contains how to use the excel sheets and fill the tables to record data.

Recommended
More Related Content
More from INBAR Central Africa Regional Office
More from INBAR Central Africa Regional Office (9)
Recently uploaded
Recently uploaded (20)
Data recording sheets
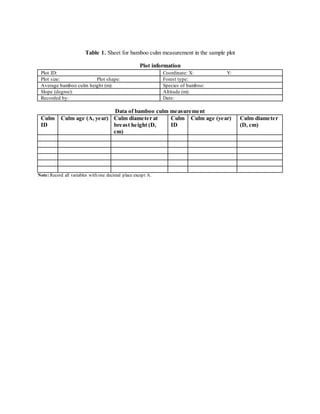
- 1. Table 1. Sheet for bamboo culm measurement in the sample plot Plot information Plot ID: Coordinate: X: Y: Plot size: Plot shape: Forest type: Average bamboo culm height (m): Species of bamboo: Slope (degree): Altitude (m): Recorded by: Date: Data of bamboo culm measurement Culm ID Culm age (A, year) Culm diameter at breast height (D, cm) Culm ID Culm age (year) Culm diameter (D, cm) Note: Record all variables with one decimal place except A.
- 2. Table 2. Sheetfor average bamboo culm measurement in clump-based sampling Plot information Plot ID: Coordinate: X: Y: Forest type: Species of bamboo: Slope (degree): Altitude (m): Distances (m): L1: L2: L3: L4: L5: Distances (m) for plantation only: Clump to clump in row: Row to row: Average bamboo culm height (m): Recorded by: Date: Data of average bamboo culm measurement Bamboo clump sample ID A (year) Nculm D1 (cm) / H1 (m) D2 (cm) / H2 (m) D3 (cm) / H3 (m) 3rd clump 1 2 3 4 5 5th clump 1 2 3 4 5 Note: Record all variables with one decimal place except A, Nculm.
- 3. Table 3. Sheet for culm measurement in clump-based sampling Plot information Plot ID: Coordinate: X: Y: Forest type: Species of bamboo: Slope (degree): Altitude (m): Distances (m): L1: L2: L3: L4: L5: Distances (m) for plantation only: Clump to clump in row: Row to row: Recorded by: Date: Data of average bamboo culm measurement Bamboo clump sample ID Nculm Gclump (cm) Hclump (m) 1 2 3 4 5 6 Note: Record all variables with one decimal place except Nculm.