
More Related Content
Similar to Grocery bags 195•• Eco-attributes of the materialsAttr.docx
Similar to Grocery bags 195•• Eco-attributes of the materialsAttr.docx (20)
More from whittemorelucilla
More from whittemorelucilla (20)
Recently uploaded
Recently uploaded (20)
Grocery bags 195•• Eco-attributes of the materialsAttr.docx
- 1. Grocery bags 195 •• Eco-attributes of the materials Attribute Polypropylene Polycarbonate Cardboard Embodied energy, virgin material (MJ/kg)* 95 110 28 Carbon footprint, virgin material CO2,equiv (kg/kg)* 2.7 5.6 1.4 Molding energy (MJ/kg)* 21 18.5 Molding carbon footprint, CO2,eQUiV (kg/kg)* l.6 l.4 Oil-equiv. energy for single wash, 1,000 cups (MJ) 195 *From the data sheets of Chapter 15 Suppose the reusable cups are used, on average, n times. Then they become more energy efficient when n Edisposable >Ereusable + (n -1)Ewash Inserting the data and solving for n reveal that reusable cups are more energy
- 2. efficient only if reused at least 15 times. This might be an achievable target in a restaurant, but for outdoor events it is totally unrealistic. Garrido and del Castillo, investigating a major outdoor event at the Barcelona Universal Forum of Culture in 2004, report the gloomy statistic that only 20% of reusable cups were actually returned. The rest ended up in trashcans or simply disappeared. Further reading Garrido, N. and del Castillo, M.D.A. (2007), "Environmental evaluation of single- use and reusable cups," Int. f. LeA, 12, pp. 252-256. Imhoff, D. (2005), Paper or plastic: searching for solutions to an overpackaged world, University of California Press, Berkeley, CA. ISBN-13: 978-1578051175. (What the title says: a study of packaging taking a critical stance) 8.3 Grocery bags Few products get a worse press than plastic grocery bags. They are distributed free, and in vast numbers. They are made from oil. They don't degrade. They litter the countryside, snare water birds, and choke turtles. Add your own gripe. Paper bags are made from-natural materials, and they biodegrade. Surely it's better
- 3. to use paper! And come to think of it, why not use bags made out of jute-it's a renew- able resource-and use them over and over? That must be the best of all? 196 CHAPTER 8: Case studies: ceo-audits A lot of questions. Let's see what answers the data sheets of Chapter 15 can give, using CO2 footprint as the measure of goodness or badness. First we must look at some real bags (Figure 8.2 and Table 8.3). The function of an eco-bag is "low-carbon containment," but there is more to it than that. Bag 1 is a typical one- use supermarket container. It is made of polyethylene (PE) and it weighs just 7 grams. Bag 2 is also PE but it is 3 times heavier and the designer graphics tell you something else: the bag is a statement of the cultural and intellectual standing of the store from which it comes (it is a bookshop). It is attractive and strong, too good to throwaway, at least not straight away. ~ Carrier bags. The lightest weighs 7grams, the heaviest weighs 257 grams . •• The characteristics of the carrier bags shown in Figure 8.2 Bag Material Mass (g) Material CO2 footprint (MJ/kg)* CO2 footprint, How many
- 4. 100 bags (kg) reuses? l.5 1 4.3 3· 6.4 5 7.6 6 20.3 14 28.3 19 Polyethylene (PEl 7 2.1 2 Polyethylene (PEl 20 2.1 3 Paper 46 1.4 4 Paper 54 l.4 5 Polypropylene (PPl 75 2.7 6 Juco-75% jute 25% cotton 257 l.l *From the data sheets of Chapter 15. 496 CHAPTER 15: Material profiles Polypropylene (PP) The material. Polypropylene, PP, first produced commercially in 1958, is the youn- ger brother of polyethylene-a very similar molecule with similar
- 5. price, processing methods, and application. Like PE it is produced i~ very large quantities (more than 40 million tons per year in 2010L growing at nearly 10% per year, and like PEl its molecule lengths and side branches can be tailored by clever catalysis, giving precise control of impact strength, and of the properties that influence molding and drawing. In its pure form polypropylene is flammable and degrades in sunlight. Fire retardants make it slow to burn and stabilizers give it extreme stability, both to UV radiation and to fresh and salt water and most aqueous solutions. Composition (CH2-CH(CH3l)n General properties Density Price Mechanical properties Young's modulus Yield strength (elastic limit) Tensile strength Elongation Hardness-Vickers Fatigue strength at 107 cycles Fracture toughness Thermal properties Melting point Maximum service temperature Thermal conductor or insulator?
- 6. Thermal conductivity Specificheat capacity Thermal expansion coefficient Electrical properties Electrical conductor or insulator? Electrical resistivity Dielectric constant Dissipation factor Dielectric strength 890 1.85 910 2.05 kg/m" USDIkg 0.9 1.55 GPa 21 37 MPa 28 41 MPa 100 600 % 6.2 11 HV 11 17 MPa 3 4.5 MPa·m1f2 150 175 DC 100 115 DC Good insulator 0.11 0.17 W/m·K 1,870 1,960 JIkg.K 122 180 ustrain/rC Good insulator
- 7. 3.3 X 10²² 2.1 3 X 10--4 22.7 3 X 10²³ 2.3 7 X 10⁻⁴ 24.6 uohrrr-cm Polymers 497 Polypropylene is widely used in household products. Eco properties: material Global production, main component Embodied energy, primary production CO2 footprint, primary production Water usage Eco-indicator 44 X 106 75 2.9 189 254 Eco properties: processing Polymer molding energy Polymer molding CO2 footprint
- 8. Polymer extrusion energy Polymer extrusion CO2 footprint 20.4 1.5 5.9 0.44 End of life Embodied energy, recycling CO2 footprint, recycling Recycle fraction in current supply Heat of combustion Combustion CO2 Recycle mark 45 2.0 5 44 3.1 metric tonlyr 83 MT/kg 3.2 kgIkg 209 Ukg millipoints/kg 22.6 MT/kg 1.7 kglkg 6.5 MT/kg 0.49 kgIkg 55 MT/kg 22 kglkg
- 9. 6 % 46 MT/kg 3.2 kgIkg &pp Typical uses. Ropes, general polymer engineering, automobile air ducting, parcel shelving and air-cleaners, garden furniture, washing machine tank, wet-cell battery cases, pipes and pipe fittings, beer bottle crates, chair shells, capacitor dielectrics, cable insulation, kitchen kettles, car bumpers, shatter proof glasses, crates, suit- cases, artificial turf, thermal underwear. 498 CHAPTER 15: Material profiles Polyethylene (PE) The material. Polyethylene, (- CH2 -)ll/ first synthesized in 1933, looks like the simplest of molecules, but the number of ways in which the- CH2-units can be linked is large. It is the first of the polyolefins, the bulk thermoplastic polymers that account for a dominant fraction of all ,polymer consumption. Polyethylene is inert, and extremely resistant to fresh and salt water, food, and most water-based solutions. Because of this it is widely used in household products, food containers, and chopping boards. Polyethylene is cheap, and particularly easy to mold and fabricate. It accepts a wide range of colors, can be transparent, translucent, or opaque, has a pleasant,
- 10. slightly waxy feel, can be textured or metal coated, but is difficult to print on. Composition (-CH2-CH2-)n General properties Density Price 960 1.9 kg/m" USD/kg 939 1.7 Mechanical properties Young's modulus Yield strength (elastic limit) Tensile strength Elongation Hardness-Vickers Fatigue strength at 107 cycles Fracture toughness 0.62 0.86 CPa 18 29 MPa 21 45 MPa 200 800 % 5.4 8.7 HV 21 23 MPa 1.4 1.7 MPa·m1l2
- 11. Thermal properties Melting point Maximum service temperature Thermal conductor or insulator? Thermal conductivity Specificheat capacity Thermal expansion coefficient 125 132 °C 90 110 °C Cood insulator 0.4 0.44 W/m·K 1,810 1,880 J/kg·K 126 198 ustrain/rC Electrical properties Electrical conductor or insulator? Electrical resistivity Dielectric constant Dissipation factor Dielectric strength Good insulator 3.3x 10²² 2.2 3 x 10⁻⁴ 17.7 3 X 1024 2.4 6 x 10⁻⁴ 19.7 uohm vcm
- 12. Further reading 197 Bags 3 and 4 are made of paper. Paper bags suggest a concern for the environ- ment, a deliberate avoidance of plastic, good for company image. But there is more mass of material here-about seven times more than that of Bag 1. And finally, reusable bags-"Bags for life" as one supermarket calls them. Bag 5 is an example. It is robust and durable and looks and feels as if it is made from a, woven fabric, but it's not-it's a textured polypropylene sheet. The color, the "Saving Australia" logo, and the sense that it really is green propelled this bag into near-universal popularity there. Here is one Aussi paper: "Forget the little black dress. The hot new item around town is the little green bag." But isn't murmuring "Green" and "Save the planet" a little bit, well, yesterday? Today is Bag 6. Discrete, understated, almost-but not quite- unnoticeable. Those who have one have the quiet satisfaction of knowing that it is made of [uco, a mix of 75% jute and 25% cotton. But it uses a great deal of material- 36 times more than Bag 1. So you see the difficulty. We have wandered here into a world that is not just about eontainment but also about self-image and company branding. Our interest
- 13. here is eeo-analysis, not psychoanalysis. So consider the following question. If the 7 gram plastic bags are really used only once, how many times do you have to use the others to do better in eeo-terms? The data sheets of Chapter 15 help here. The fourth column of Table 8.3 lists their values for the carbon footprints of PE, PP, paper, and jute (that for jute includes spinning and weaving). If you multiply these values by the masses, taking 100 bags as the unit of study, you get the numbers in the fifth column. Divide these by the value for the single-use bag, and you get the number of times the others must be used to provide containment at lower carbon per use than Bag I-last column. Now you must make your own judgment. Would you re-use a paper bag six or more times? Unlikely-they tear easily and get soggy when wet. If you don't, Bag 1 wins. Would you use the green Bag 5 more than fourteen times? I have one and it has already been used more than that, so it looks like a winner. Finally Bag 6, the thinking person's eco-bag, is less good than plastic until you've used it 19 times. Not impossi- ble, provided nothing leaks or breaks inside it, causing terminal contamination. So from a carbon and energy point of view, single-use bags are not necessarily bad-it depends how meticulous you are about reusing any of the others. The real problem with plastic is its negligible value (so people discard it
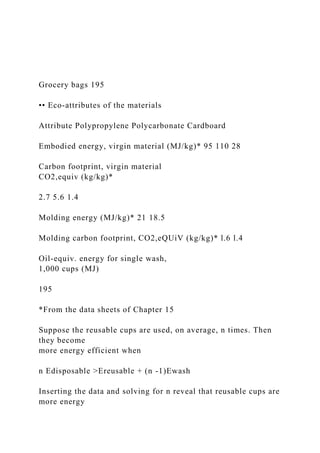
- 14. without a thought) and its long life, causing it to accumulate on land, in rivers and lakes, and in the sea where it disfigures the countryside and harms wildlife. Further reading Edwards, C. and Fry, J.M. (2011), "Life-cycleassessment of supermarket carrier bags," Report: SC030148, The Environment Agency, Bristol, UK. www.environment- agency.gov.ul<lstaticidocumentslResearchiCarrier _Bags_final_18-02-11.pdf. Accessed January 2011. (An exemplar of LCA at its most LCA- liRe) Grocery bags 195 •• Eco-attributes of the materials Attribute Polypropylene Polycarbonate Cardboard Embodied energy, virgin material (MJ/kg)* 95 110 28 Carbon footprint, virgin material CO2,equiv (kg/kg)* 2.7 5.6 1.4 Molding energy (MJ/kg)* 21 18.5 Molding carbon footprint, CO2,eQUiV (kg/kg)* l.6 l.4
- 15. Oil-equiv. energy for single wash, 1,000 cups (MJ) 195 *From the data sheets of Chapter 15 Suppose the reusable cups are used, on average, n times. Then they become more energy efficient when n Edisposable >Ereusable + (n -1)Ewash Inserting the data and solving for n reveal that reusable cups are more energy efficient only if reused at least 15 times. This might be an achievable target in a restaurant, but for outdoor events it is totally unrealistic. Garrido and del Castillo, investigating a major outdoor event at the Barcelona Universal Forum of Culture in 2004, report the gloomy statistic that only 20% of reusable cups were actually returned. The rest ended up in trashcans or simply disappeared. Further reading Garrido, N. and del Castillo, M.D.A. (2007), "Environmental evaluation of single- use and reusable cups," Int. f. LeA, 12, pp. 252-256. Imhoff, D. (2005), Paper or plastic: searching for solutions to an overpackaged world, University of California Press, Berkeley, CA. ISBN-13:
- 16. 978-1578051175. (What the title says: a study of packaging taking a critical stance) 8.3 Grocery bags Few products get a worse press than plastic grocery bags. They are distributed free, and in vast numbers. They are made from oil. They don't degrade. They litter the countryside, snare water birds, and choke turtles. Add your own gripe. Paper bags are made from-natural materials, and they biodegrade. Surely it's better to use paper! And come to think of it, why not use bags made out of jute-it's a renew- able resource-and use them over and over? That must be the best of all? 196 CHAPTER 8: Case studies: ceo-audits A lot of questions. Let's see what answers the data sheets of Chapter 15 can give, using CO2 footprint as the measure of goodness or badness. First we must look at some real bags (Figure 8.2 and Table 8.3). The function of an eco-bag is "low-carbon containment," but there is more to it than that. Bag 1 is a typical one- use supermarket container. It is made of polyethylene (PE) and it weighs just 7 grams. Bag 2 is also PE but it is 3 times heavier and the designer graphics tell you
- 17. something else: the bag is a statement of the cultural and intellectual standing of the store from which it comes (it is a bookshop). It is attractive and strong, too good to throwaway, at least not straight away. ~ Carrier bags. The lightest weighs 7grams, the heaviest weighs 257 grams . •• The characteristics of the carrier bags shown in Figure 8.2 Bag Material Mass (g) Material CO2 footprint (MJ/kg)* CO2 footprint, How many 100 bags (kg) reuses? l.5 1 4.3 3· 6.4 5 7.6 6 20.3 14 28.3 19 Polyethylene (PEl 7 2.1 2 Polyethylene (PEl 20 2.1 3 Paper 46 1.4 4 Paper 54 l.4
- 18. 5 Polypropylene (PPl 75 2.7 6 Juco-75% jute 25% cotton 257 l.l *From the data sheets of Chapter 15. 496 CHAPTER 15: Material profiles Polypropylene (PP) The material. Polypropylene, PP, first produced commercially in 1958, is the youn- ger brother of polyethylene-a very similar molecule with similar price, processing methods, and application. Like PE it is produced i~ very large quantities (more than 40 million tons per year in 2010L growing at nearly 10% per year, and like PEl its molecule lengths and side branches can be tailored by clever catalysis, giving precise control of impact strength, and of the properties that influence molding and drawing. In its pure form polypropylene is flammable and degrades in sunlight. Fire retardants make it slow to burn and stabilizers give it extreme stability, both to UV radiation and to fresh and salt water and most aqueous solutions. Composition (CH2-CH(CH3l)n General properties Density
- 19. Price Mechanical properties Young's modulus Yield strength (elastic limit) Tensile strength Elongation Hardness-Vickers Fatigue strength at 107 cycles Fracture toughness Thermal properties Melting point Maximum service temperature Thermal conductor or insulator? Thermal conductivity Specificheat capacity Thermal expansion coefficient Electrical properties Electrical conductor or insulator? Electrical resistivity Dielectric constant Dissipation factor Dielectric strength 890 1.85 910 2.05 kg/m" USDIkg 0.9 1.55 GPa
- 20. 21 37 MPa 28 41 MPa 100 600 % 6.2 11 HV 11 17 MPa 3 4.5 MPa·m1f2 150 175 DC 100 115 DC Good insulator 0.11 0.17 W/m·K 1,870 1,960 JIkg.K 122 180 ustrain/rC Good insulator 3.3 X 10²² 2.1 3 X 10--4 22.7 3 X 10²³ 2.3 7 X 10⁻⁴ 24.6 uohrrr-cm Polymers 497 Polypropylene is widely used in household products. Eco properties: material
- 21. Global production, main component Embodied energy, primary production CO2 footprint, primary production Water usage Eco-indicator 44 X 106 75 2.9 189 254 Eco properties: processing Polymer molding energy Polymer molding CO2 footprint Polymer extrusion energy Polymer extrusion CO2 footprint 20.4 1.5 5.9 0.44 End of life Embodied energy, recycling CO2 footprint, recycling Recycle fraction in current supply Heat of combustion Combustion CO2 Recycle mark 45 2.0 5 44 3.1
- 22. metric tonlyr 83 MT/kg 3.2 kgIkg 209 Ukg millipoints/kg 22.6 MT/kg 1.7 kglkg 6.5 MT/kg 0.49 kgIkg 55 MT/kg 22 kglkg 6 % 46 MT/kg 3.2 kgIkg &pp Typical uses. Ropes, general polymer engineering, automobile air ducting, parcel shelving and air-cleaners, garden furniture, washing machine tank, wet-cell battery cases, pipes and pipe fittings, beer bottle crates, chair shells, capacitor dielectrics, cable insulation, kitchen kettles, car bumpers, shatter proof glasses, crates, suit- cases, artificial turf, thermal underwear. 498 CHAPTER 15: Material profiles Polyethylene (PE) The material. Polyethylene, (- CH2 -)ll/ first synthesized in
- 23. 1933, looks like the simplest of molecules, but the number of ways in which the- CH2-units can be linked is large. It is the first of the polyolefins, the bulk thermoplastic polymers that account for a dominant fraction of all ,polymer consumption. Polyethylene is inert, and extremely resistant to fresh and salt water, food, and most water-based solutions. Because of this it is widely used in household products, food containers, and chopping boards. Polyethylene is cheap, and particularly easy to mold and fabricate. It accepts a wide range of colors, can be transparent, translucent, or opaque, has a pleasant, slightly waxy feel, can be textured or metal coated, but is difficult to print on. Composition (-CH2-CH2-)n General properties Density Price 960 1.9 kg/m" USD/kg 939 1.7 Mechanical properties Young's modulus
- 24. Yield strength (elastic limit) Tensile strength Elongation Hardness-Vickers Fatigue strength at 107 cycles Fracture toughness 0.62 0.86 CPa 18 29 MPa 21 45 MPa 200 800 % 5.4 8.7 HV 21 23 MPa 1.4 1.7 MPa·m1l2 Thermal properties Melting point Maximum service temperature Thermal conductor or insulator? Thermal conductivity Specificheat capacity Thermal expansion coefficient 125 132 °C 90 110 °C Cood insulator 0.4 0.44 W/m·K 1,810 1,880 J/kg·K 126 198 ustrain/rC Electrical properties Electrical conductor or insulator? Electrical resistivity Dielectric constant Dissipation factor Dielectric strength
- 25. Good insulator 3.3x 10²² 2.2 3 x 10⁻⁴ 17.7 3 X 1024 2.4 6 x 10⁻⁴ 19.7 uohm vcm Further reading 197 Bags 3 and 4 are made of paper. Paper bags suggest a concern for the environ- ment, a deliberate avoidance of plastic, good for company image. But there is more mass of material here-about seven times more than that of Bag 1. And finally, reusable bags-"Bags for life" as one supermarket calls them. Bag 5 is an example. It is robust and durable and looks and feels as if it is made from a, woven fabric, but it's not-it's a textured polypropylene sheet. The color, the "Saving Australia" logo, and the sense that it really is green propelled this bag into near-universal popularity there. Here is one Aussi paper: "Forget the little black dress. The hot new item around town is the little green bag."
- 26. But isn't murmuring "Green" and "Save the planet" a little bit, well, yesterday? Today is Bag 6. Discrete, understated, almost-but not quite- unnoticeable. Those who have one have the quiet satisfaction of knowing that it is made of [uco, a mix of 75% jute and 25% cotton. But it uses a great deal of material- 36 times more than Bag 1. So you see the difficulty. We have wandered here into a world that is not just about eontainment but also about self-image and company branding. Our interest here is eeo-analysis, not psychoanalysis. So consider the following question. If the 7 gram plastic bags are really used only once, how many times do you have to use the others to do better in eeo-terms? The data sheets of Chapter 15 help here. The fourth column of Table 8.3 lists their values for the carbon footprints of PE, PP, paper, and jute (that for jute includes spinning and weaving). If you multiply these values by the masses, taking 100 bags as the unit of study, you get the numbers in the fifth column. Divide these by the value for the single-use bag, and you get the number of times the others must be used to provide containment at lower carbon per use than Bag I-last column. Now you must make your own judgment. Would you re-use a paper bag six or more times? Unlikely-they tear easily and get soggy when wet.
- 27. If you don't, Bag 1 wins. Would you use the green Bag 5 more than fourteen times? I have one and it has already been used more than that, so it looks like a winner. Finally Bag 6, the thinking person's eco-bag, is less good than plastic until you've used it 19 times. Not impossi- ble, provided nothing leaks or breaks inside it, causing terminal contamination. So from a carbon and energy point of view, single-use bags are not necessarily bad-it depends how meticulous you are about reusing any of the others. The real problem with plastic is its negligible value (so people discard it without a thought) and its long life, causing it to accumulate on land, in rivers and lakes, and in the sea where it disfigures the countryside and harms wildlife. Further reading Edwards, C. and Fry, J.M. (2011), "Life-cycleassessment of supermarket carrier bags," Report: SC030148, The Environment Agency, Bristol, UK. www.environment- agency.gov.ul<lstaticidocumentslResearchiCarrier _Bags_final_18-02-11.pdf. Accessed January 2011. (An exemplar of LCA at its most LCA- liRe)
- 28. MEE 6201, Advanced Pollution Prevention 1 Course Learning Outcomes for Unit III Upon completion of this unit, students should be able to: 3. Explain pollution prevention audits. Reading Assignment Chapter 7: Eco-audits and eco-audit tools Chapter 8: Case studies: eco-audits In order to access the resources below, you must first log into the myCSU Student Portal and access the Academic OneFile database within the CSU Online Library. Cheremisinoff, N. P. (2002). How to conduct a pollution prevention audit – Part 1: Do an audit in-house and avoid surprises. Pollution Engineering, 34(3), 24-28. Cheremisinoff, N. P. (2002). Conduct a pollution prevention audit – Part 2: Do an audit in-house and avoid surprises. Pollution Engineering, 34(4), 16-19. Unit Lesson
- 29. Nice job progressing through Units I and II. In Unit III, we'll study audits. Chapters 7 and 8 in the textbook discuss eco-audits. This lecture will teach pollution prevention audits. An eco-audit tends to focus on reducing energy use and reducing carbon dioxide (CO2) emissions. If non-fossil energy sources are used, then CO2 emissions are automatically eliminated, and the focus is on energy reduction to conserve resources. If fossil sources are used for energy, then the challenge, though somewhat the same, moves more toward CO2 reduction, which can occur from reducing energy consumption. While eco-audits focus on reducing energy consumption and reducing CO2 emissions, the P2 audit encompasses more than energy and has an ultimate goal of source reduction. Though the Pollution Prevention Act focuses on source reduction, over the years, businesses have broadened what they consider as pollution prevention (P2). According to Cheremisinoff (2002a): P2 is any practice that: contaminant reentering any waste stream or otherwise released into the environment prior to recycling, treatment and disposal. associated with the release of such substances, pollutants or contaminants.
- 30. increased efficiency in the use of raw materials or through protection of natural resources by conservation. (p. 24) Cheremisinoff (2002b) includes the corporate bottom line, "A P2 investment must be able to stand up to every other funding request and effectively compete for money on its own merits" (p. 16). Thus, though companies must comply with the laws listed in the Unit I lecture (often seen as costs rather than benefits to management) UNIT III STUDY GUIDE Pollution Prevention Audits MEE 6201, Advanced Pollution Prevention 2 UNIT x STUDY GUIDE Title as they conduct their business, it behooves companies to look at P2. Not only is P2 helpful to the environment, good P2 programs benefit a company's finances. In Unit II, you were introduced to life cycle analysis (LCA). Understanding the life cycle of a product enables the P2 manager to locate P2 possibilities, such as fixing leaky pipes or using more efficient fuel sources. The textbook reading for Unit III covers eco-audits, while the
- 31. supplemental readings cover P2 audits. What is the difference? An eco-audit focuses on energy use and carbon dioxide (CO2) emissions with the goal being to reduce those two quantities. While a P2 audit will locate production areas where energy usage can be reduced, it doesn't have the same focus on reducing CO2 emissions as in an eco-audit. A P2 audit looks at all types of pollution produced, excess energy used, and protection of resources. Thus, it is broader than an eco-audit. The LCA and P2 audit tend to overlap in coverage but differ in when they are conducted. An LCA is often conducted before a process is built, while a P2 audit is conducted during operation. Cheremisinoff (2002b) outlines the elements of a P2 audit. The primary phases are: 1. Phase I: Pre-assessment for audit preparation. 2. Phase II: The in-plant assessment. 3. Phase III: Synthesis, benchmarking, and corrective actions. (p. 17) Table 1 shows the steps within each phase of a P2 audit. Phase I: The Pre-assessment (quoted from Cheremisinoff, 2002b) Step 1 Audit Focus and Preparation Step 1.1 Get Ready
- 32. Step 1.2 Assemble the Audit Team Step 1.3 Identify and Allocate Additional Resources Step 1.4 Select the Subject Facility Step 1.5 Define the Audit Objectives Step 1.6 Review Documentation Step 1.7 Gain Employee Buy-in and Participation Step 2 List the Unit Operations Step 2.1 Refine Our Initial Checklist Step 2.2 Conduct an Initial Walk-through Step 3 Constructing Process Flow Sheets Step4 Preliminary Assessment and Next Steps MEE 6201, Advanced Pollution Prevention 3 UNIT x STUDY GUIDE Title Phase II: The In-plant Assessment
- 33. Step 5 Determining the Inputs Step 5.1 Determine the Total Inputs Step 5.2 Determine the Inputs to Unit Operations Step 5.3 Consider the Energy Inputs Step 5.4 Record Information on Process Flow Sheets Step 6 Accounting for Water Usage Step 7 Measuring Current Levels of Water Use and Recycling Step 8 Quantifying Process Outputs Step 9 Accounting for Wastewater Flows Step 9.1 Identify the Effluent Discharge Points Step 9.2 Plan and Implement a Monitoring Program Step 9.3 Reconciling Wastewater Flows Step 9.4 Determine the Concentrations of Contaminants Step 9.5 Tabulate Flows and Concentrations Step 10 Accounting for Gaseous Emissions Step 10.1 Quantify the Gaseous Emissions Step 10.2 Tabulate Flows and Concentrations Step 11 Accounting for Off-Site Wastes
- 34. Step 12 Final Preparation for the Material-Balance System Step 13 Construct a Material Balance Information Sheet Step 14 Evaluating Material Balances Step 14.1 Classify the Material Balances Step 14.2 Determine the Gaps and Inaccuracies Step 15 Refine the Material Balances Phase III: Synthesis, Benchmarking, and Corrective Actions Step 16 Low-cost/No-cost Recommendations Step 17 Targeting and Characterizing Problem Wastes Step 18 Segregation Step 19 Developing Long-Term Waste-reduction Options Step 20 Environmental and Economic Evaluation of P2 Options Step 21 Developing and Implementing the Action Plan (p. 17) Table 1 is a good outline of a P2 audit. Specific industries or processes may have other steps, however. Several sections of the audit will be presented as examples. As an example, consider a fictitious company called ALref that refines aluminum. Recall from Unit II that a
- 35. refinery separates aluminum oxide from bauxite rock and creates alumina. Alumina chemically is Al2O3 and looks like white powder. Example of Step 1.1 Step 1.1 Get Ready: April 11, 2016: Have staff in place for audit. Begin Phase I. May 6, 2016: Have Phase I completed. May 9-20, 2016: Discuss Phase I. Modify Phase II and III as needed. May 23, 2016: Begin Phase II. July 22, 2016: Have Phase II completed. July 25 - Aug 5, 2016: Discuss Phase II. Modify Phase III as needed. MEE 6201, Advanced Pollution Prevention 4 UNIT x STUDY GUIDE Title Aug. 8, 2016: Begin Phase III. Nov. 18, 2016: Complete Phase III. Nov. 21 - Dec. 9, 2016: Discuss Phase III. Example of Step 1.7 Step 1.7 Gain Employee Buy-in and Participation:
- 36. Set up incentive program for employees to report leaks, suggest where there are inefficiencies, suggest alternative energy sources, and suggest P2 opportunities that they spot. Do not chastise employees for trying to change anything. Encourage them to find and discuss possibilities for improvement. Provide $20 gift cards to lower-level staff who propose ideas that get implemented. Example of Step 2 (unit operations from Advameg, 2015) Step 2. Listing the Unit Operations: water to the crushed rock to dissolve it and create liquid slurry containing small-sized ore particles. lets it digest for an hour or so, then depressurize and reduce the temperature. Result is a mixture of suspended solids. waste products called "red mud" (sand, iron oxides and trace elements from the bauxite). The liquid in the tanks has a consistency of coffee and is filtered. Material on the filters is aluminum oxide but is not yet the finished product. precipitation tank where aluminum oxide crystals are added as a seed to the wet aluminum oxide. The wet aluminum oxide gathers on the seed making bigger crystals. The crystals settle out.
- 37. process are heated to dry them. The result is the final alumina product. The unit operations are the key to a P2 audit since they will lead to P2 opportunities that can be listed in Phase III. As a student preparing a P2 audit for our course, you will likely have references (such as the ones listed in this lecture) due to unfamiliarity with the processes. However, as a real employee of a company preparing a P2 audit, you will be familiar with the unit operations and thus would not have references. As you move into Phase II of the P2 audit, useful information for Steps 5 ("Determining the Inputs") and 6 ("Accounting for Water Usage") can be found in Chapter 15 of our textbook. The chapter has over 100 pages of energy and water requirements to produce various products. Example of Phase II's Step 13 Material Balance Using flow meters, measure flow rate Q1 (gpm, i.e. gallons per minute) of water into the grinding process. From stoichiometry and heat balances, determine how much water is used in the process (Q2). Measure Q3, which is the flow of water (gpm) out of the process. Ideally, Q3=Q1+Q2. If the computed Q3 and measured Q3 are different by over 10%, then look for leaks in the system. List material balances for all processes. This lecture presents a P2 audit outline with examples of some of the sections as well. Please refer to Chapter 8 of our textbook, "Case studies: eco-audits," for examples of eco- audits. Some of the information from an eco-audit (e.g. energy
- 38. usage, materials used, and water consumption) can be used in a P2 audit. The recommendations in Phase III of the P2 audit should be very specific. As an ALref P2 manager, you will have walked around the alumina refinery numerous times, becoming very familiar with the workers and processes. That familiarity, along with math computations of material and energy balances, will provide you with knowledge of where source reduction and other P2 options can be implemented. Chapter 8 of our textbook gives very specific numbers for energy use, material quantities, water consumption, and other items. That type of detail should be in a P2 audit. Cheremisinoff (2002a) provides additional examples of P2 audits. MEE 6201, Advanced Pollution Prevention 5 UNIT x STUDY GUIDE Title This lecture has contained a lot of information. You now have an idea of the aspects of a P2 audit. Now, it's time to go to work and prepare an audit! References Advameg, Inc. (2015). How products are made: Volume 5 –
- 39. aluminum. Retrieved from http://www.madehow.com/Volume-5/Aluminum.html Ashby, M. F. (2013). Materials and the environment: Eco- informed material choice (2nd ed.). Waltham, MA: Butterworth-Heinemann. Cheremisinoff, N. P. (2002a). How to conduct a pollution prevention audit – Part 1: Do an audit in-house and avoid surprises. Pollution Engineering, 34(3), 24-28. Cheremisinoff, N. P. (2002b). Conduct a pollution prevention audit – Part 2: Do an audit in-house and avoid surprises. Pollution Engineering, 34(4), 16-19. Suggested Reading The following reading addresses eco-data. Chapter 6: Eco-data: values, sources, precision The chapter includes detailed costs, mechanical, thermal, electrical, and eco properties of many materials, which are useful to a P2 analysis and/or audit. Chapter 15: Material profiles
- 40. MEE 6201, Advanced Pollution Prevention 1 Course Description An in-depth study of advanced pollution prevention practices with the preparation of a pollution prevention management plan. Emphasizes methodologies that achieve environmental compliance through less expensive pollution control methods. Course Textbook Ashby, M. F. (2013). Materials and the environment: Eco- informed material choice (2nd ed.). Waltham, MA: Butterworth- Heinemann. Course Learning Outcomes Upon completion of this course, students should be able to: 1. Describe federal laws related to pollution prevention. 2. Conduct life cycle analyses. 3. Explain pollution prevention audits. 4. Evaluate economics of pollution prevention strategies. 5. Examine impact of corporate philosophy on pollution
- 41. prevention. 6. Describe pollution prevention strategies for various industries. 7. Identify best available technologies for various industries. 8. Evaluate the impact of pollution prevention on ecosystems and biological communities. Credits Upon completion of this course, the students will earn three (3) hours of college credit. Course Structure 1. Study Guide: Each unit contains a Study Guide that provides students with the learning outcomes, unit lesson, required reading assignments, and supplemental resources. 2. Learning Outcomes: Each unit contains Learning Outcomes that specify the measurable skills and knowledge students should gain upon completion of the unit. 3. Unit Lesson: Each unit contains a Unit Lesson, which discusses lesson material. 4. Reading Assignments: Each unit contains Reading Assignments from one or more chapters from the textbook. 5. Suggested Reading: Suggested Readings are listed in Units I- VI and Unit VIII study guides. Students are encouraged to read the resources listed if the opportunity arises, but they will not be tested on their knowledge of the Suggested Readings.
- 42. 6. Discussion Boards: Discussion Boards are part of all CSU term courses. More information and specifications can be found in the Student Resources link listed in the Course Menu bar. 7. Unit Assignments: Students are required to submit for grading Unit Assignments in Units I-VIII. Specific information and instructions regarding these assignments are provided below. Grading rubrics are included with each assignment. Specific information about accessing these rubrics is provided below. MEE 6201, Advanced Pollution Prevention Course Syllabus MEE 6201, Advanced Pollution Prevention 2 8. Ask the Professor: This communication forum provides you with an opportunity to ask your professor general or course content related questions. 9. Student Break Room: This communication forum allows for casual conversation with your classmates. CSU Online Library The CSU Online Library is available to support your courses and programs. The online library includes databases, journals, e-books, and research guides. These resources are always accessible and can be reached through the library
- 43. webpage. To access the library, log into the myCSU Student Portal, and click on “CSU Online Library.” You can also access the CSU Online Library from the “My Library” button on the course menu for each course in Blackboard. The CSU Online Library offers several reference services. E- mail ([email protected]) and telephone (1.877.268.8046) assistance is available Monday – Thursday from 8 am to 5 pm and Friday from 8 am to 3 pm. The library’s chat reference service, Ask a Librarian, is available 24/7; look for the chat box on the online library page. Librarians can help you develop your research plan or assist you in finding relevant, appropriate, and timely information. Reference requests can include customized keyword search strategies, links to articles, database help, and other services. Unit Assignments Unit I Scholarly Activity Select two out of the three writing prompts listed below. Your responses to your two chosen prompts should be at least 500 words each. No title page is needed, but be sure to indicate which writing prompts you are addressing at the top of each response. Each response needs its own reference page. Writing Prompts (respond to two only): 1. Explain the origin of the federal Pollution Prevention Act, including the year it was passed, events leading to its passage, politics leading up to its passage, by how wide of a
- 44. vote it was passed, and which president signed it. Please use the CSU Online Library, the Internet, the textbook, and/or other resources to respond. Please cite and reference all sources used. 2. In Chapters 1 and 2 of the course textbook, Ashby (2013) discusses materials and energy. After studying the chapters, select four items total (materials and/or energy) where minimal cost pollution prevention efforts can provide the most gain in environmental benefit. Also, discuss which of the laws listed in the Unit I Lesson apply to your selections. 3. Address one of the five principles described on page 102 of the textbook. In your essay, include the date that the principle was initiated, events that led to the creation of the principle, the purpose of the principle, your thoughts about the usefulness of the principle, and any recent developments that occurred as a result of the principle. You are required to use at least your textbook as source material for both of your responses. All sources used, including the textbook, must be referenced; paraphrased and quoted material must have accompanying citations. Information about accessing the Blackboard Grading Rubric for this assignment is provided below. Unit II Scholarly Activity Select two out of the three writing prompts listed below. Your
- 45. responses to your two chosen prompts should be at least 500 words each. No title page is needed, but be sure to indicate which writing prompts you are addressing at the top of each response. Each response needs its own reference page. Writing Prompts (respond to two only): 1. Using the life cycle concepts discussed in Chapter 3, select a product, and describe its life cycle. mailto:[email protected] MEE 6201, Advanced Pollution Prevention 3 2. Imagine that you broke a compact disk (CD) that had music on it. Please respond to the following questions in paragraph form: would be needed in your community in order to have the best end of life option, which is reuse? If reuse is not possible, discuss re-engineering, recycling, or combustion as options instead of disposal in a landfill. 4.1, is recycling a possibility?
- 46. 3. Imagine that you have a smart phone that has been crushed and is no longer usable. Please respond to the following questions in paragraph form: mart phones? would be needed in your community in order to have the best end of life option, which is reuse? If reuse is not possible, discuss re-engineering, recycling, combustion as options instead of disposal in a landfill. Table 4.1, is recycling a possibility? You are required to use at least your textbook as source material for both of your responses. All sources used, including the textbook, must be referenced; paraphrased and quoted material must have accompanying citations. Information about accessing the Blackboard Grading Rubric for this assignment is provided below. Unit III Case Study Select one of the products described in the eco-audit case study in Chapter 8 of your textbook (e.g., cups, grocery bags, electric kettle). Using the data in the textbook from the eco- audit, additional data from Chapter 15 (as necessary), and any additional resources that you find helpful, prepare a pollution prevention audit for the product that you have selected. Base your P2 audit on the steps shown in the Unit III Lesson.
- 47. You do not need to use all of the P2 audit steps shown in the Unit III Lesson, but use at least three major steps from each phase (a major step being Step 5 rather than Step 5.1). Since you will not be using all of the steps shown in the Unit Lesson, you may re-number them if you wish so that your audit proceeds sequentially without skipping numbers. Your audit should include an introductory paragraph explaining both the purpose of a P2 audit and the reasons for including the steps that you have selected. Your case study must be at least two full pages in length. All sources used, including the textbook, must be referenced; paraphrased and quoted material must have accompanying citations. All references and citations used must be in APA style. The introduction should be formatted in paragraph form, and the steps can be formatted as a list. Information about accessing the Blackboard Grading Rubric for this assignment is provided below. Unit IV Scholarly Activity Address all three of the following writing prompts. Your responses to your three chosen prompts should be at least 350 words each. No title page is needed, but be sure to indicate which writing prompts you are addressing at the top of each response. Each response needs its own reference page. Writing Prompts (respond to all three): 1. Review the Reading Assignment titled as "Pollution Prevention Practices in Oregon's Electronics Industry" by Harding and Jones. In your review, include:
- 48. industry, tions discussed in the article, MEE 6201, Advanced Pollution Prevention 4 2. Review the Reading Assignment titled as "Optimal Deployment of Emissions Reduction Technologies for Construction Equipment" by Barl, Zietsman, Quadrifoglio, and Farzaneh. In your review: t (HE), selective catalytic reduction (SCR), and fuel additive (FA) technologies. FA, including a discussion of costs. the best technology? Explain.
- 49. technology (HE, SCR, and/or FA) should be used, or should none be used? 3. Review the Reading Assignment titled as "Flue Gas Desulfurization: The State of the Art" by Srivastava and Jozewicz. In your review: -fired power plants and why it is used. -through process and one regenerable process. mmarize the section titled "The MEL [magnesium enhanced slurry] Cost Model." manager. Available Technology (BAT) and whether any of the FGD processes described in the article are considered BATs. You are required to use at least your textbook as source material for all of your responses. All sources used, including the textbook, must be referenced; paraphrased and quoted material must have accompanying citations. Information about accessing the Blackboard Grading Rubric for
- 50. this assignment is provided below. Unit V Essay Please write an essay about pollution prevention in the dry cleaning and hydraulic fracturing industries. Include the following items: 1. one-paragraph introduction; 2. five-paragraph review of the Sinshelmer, Grout, Namkoong, Gottlieb, and Latif (2007) dry cleaning article, including an explanation of the common dry cleaning process using perchloroethylene (PCE), problems with PCE, and a review of options to PCE presented in the paper; 3. five-paragraph review (total—not five paragraphs for each article) of the Heywood (2012) article and the Chen, Al- Wadei, Kennedy, and Terry (2014) article on hydraulic fracturing, including environmental issues with hydraulic fracturing and the P2 solutions presented in each of the two articles (include the use of liquid carbon dioxide); 4. five-paragraph review of the Taylor, Carbonell, and Desimone (2010) article on using liquid carbon dioxide for P2, focusing on how liquid carbon dioxide can be used as a substitute in the dry cleaning industry and in the hydraulic fracturing industry; and a 5. two-paragraph summary to include your overall thoughts about P2 in the dry cleaning and hydraulic fracturing industries, and specifically whether liquid carbon dioxide is a reasonable, cost-effective, and environmentally- friendly alternative to traditional methods.
- 51. In order to access the resources below, you must first log into the myCSU Student Portal and access the Academic Search Complete database within the CSU Online Library. Use at least the following references: Chen, J., Al-Wadei, M. H., Kennedy, C. M., & Terry, P. D. (2014). Hydraulic fracturing: Paving the way for a sustainable future? Journal of Environmental and Public Health, 1-10. Heywood, P. (2012, April). Fracking safer and greener? TCE: The Chemical Engineer, 850, 42-45. MEE 6201, Advanced Pollution Prevention 5 Sinshelmer, P., Grout, C., Namkoong, A., Gottlieb, R., & Latif, A. (2007). The viability of professional wet cleaning as a pollution prevention alternative to perchloroethylene dry cleaning. Air and Waste Management Association, 57, 172-178. Taylor, D. K., Carbonell, R., & Desimone, J. M. (2010). Opportunities for pollution prevention and energy efficiency enabled by the carbon dioxide technology platform. Annual Review of Energy and the Environment, 25(1), 115-148. Your paper must be at least three full pages in length, not
- 52. including the title page and reference page. All sources used, including the textbook, must be referenced; paraphrased and quoted material must have accompanying citations. All references and citations used must be in APA style. Information about accessing the Blackboard Grading Rubric for this assignment is provided below. Unit VI Scholarly Activity Address both of the following writing prompts. Your responses to both of your chosen prompts should be at least 500 words each. No title page is needed, but be sure to indicate which writing prompts you are addressing at the top of each response. Each response needs its own reference page. Writing Prompts (respond to both): 1. Review the Reading Assignment titled as "The Greening of a Pulp and Paper Mill" by Hill, Saviello, and Groves. In your review, describe: built, the strike, number of employees, and amount of paper produced, ng process, technologies, and economics, and
- 53. mill from an environmental problem to an environmental success. 2. Review the Reading Assignment titled as "Greenhouse Gas Emissions Reduction Opportunities for Concrete Pavements" by Santero, Loojos, and Ochsendorf. In your review, describe: on of pavements, embodied emissions, albedo, carbonation, and vehicle fuel consumption, 861, lated to concrete paving, and You are required to use at least your textbook as source material for both of your responses. All sources used, including the textbook, must be referenced; paraphrased and quoted material must have accompanying citations. Information about accessing the Blackboard Grading Rubric for this assignment is provided below. Unit VII Scholarly Activity Address both of the following writing prompts. Your responses
- 54. to both of your chosen prompts should be at least 500 words each. No title page is needed, but be sure to indicate which writing prompts you are addressing at the top of each response. Each response needs its own reference page. Writing Prompts (respond to both): 1. Review the Reading Assignment titled as "Designing a Low- Cost Pollution Prevention Plan to Pay Off at the University of Houston" by Bialowas, Sullivan, and Schneller. In your review, describe: P2 plan, modifications, and cost savings, MEE 6201, Advanced Pollution Prevention 6 about the university's P2 program. 2. Review the Reading Assignment titled as "Effectiveness of State Pollution Prevention Programs and Policies" by Donna Harrington. In your review, describe:
- 55. leases Inventory (TRI) and its impact on P2, conclusions. You are required to use at least your textbook as source material for both of your responses. All sources used, including the textbook, must be referenced; paraphrased and quoted material must have accompanying citations. Information about accessing the Blackboard Grading Rubric for this assignment is provided below. Unit VIII Research Paper Please write a research paper addressing the following: How important is corporate philosophy to a company's pollution prevention efforts? Please use an example of one or more companies to support your position. The completed assignment must be a minimum of 4-5 pages in length, not including the title page and reference page. The paper should have a minimum of three sections: an introduction, a body, and a conclusion. A minimum of three references should be used, and at least one of these must be from a scholarly, peer-reviewed journal. All sources used, including the textbook, must be referenced; paraphrased and quoted material must have accompanying citations. You may use articles cited in previous portions of the course but you must write new, unique content that was not in any of
- 56. your previous submissions in this (or any other) course. Information about accessing the Blackboard Grading Rubric for this assignment is provided below. APA Guidelines The application of the APA writing style shall be practical, functional, and appropriate to each academic level, with the primary purpose being the documentation (citation) of sources. CSU requires that students use APA style for certain papers and projects. Students should always carefully read and follow assignment directions and review the associated grading rubric when available. Students can find CSU’s Citation Guide by clicking here. This document includes examples and sample papers and provides information on how to contact the CSU Success Center. Grading Rubrics This course utilizes analytic grading rubrics as tools for your professor in assigning grades for all learning activities. Each rubric serves as a guide that communicates the expectations of the learning activity and describes the criteria for each level of achievement. In addition, a rubric is a reference tool that lists evaluation criteria and can help you organize your efforts to meet the requirements of that learning activity. It is imperative for you to familiarize yourself with these rubrics because these are the primary tools your professor uses for assessing learning activities. Rubric categories include: (1) Discussion Board, (2) Assessment
- 57. (Written Response), and (3) Assignment. However, it is possible that not all of the listed rubric types will be used in a single course (e.g., some courses may not have Assessments). The Discussion Board rubric can be found within Unit I’s Discussion Board submission instructions. The Assessment (Written Response) rubric can be found embedded in a link within the directions for each Unit Assessment. However, these rubrics will only be used when written-response questions appear within the Assessment. http://www.columbiasouthern.edu/downloads/pdf/success/citatio n-guide MEE 6201, Advanced Pollution Prevention 7 Each Assignment type (e.g., article critique, case study, research paper) will have its own rubric. The Assignment rubrics are built into Blackboard, allowing students to review them prior to beginning the Assignment and again once the Assignment has been scored. This rubric can be accessed via the Assignment link located within the unit where it is to be submitted. Students may also access the rubric through the course menu by selecting “Tools” and then “My Grades.” Again, it is vitally important for you to become familiar with these rubrics because their application to your Discussion Boards, Assessments, and Assignments is the method by which your instructor assigns all grades.
- 58. Communication Forums These are non-graded discussion forums that allow you to communicate with your professor and other students. Participation in these discussion forums is encouraged, but not required. You can access these forums with the buttons in the Course Menu. Instructions for subscribing/unsubscribing to these forums are provided below. Click here for instructions on how to subscribe/unsubscribe and post to the Communication Forums. Ask the Professor This communication forum provides you with an opportunity to ask your professor general or course content questions. Questions may focus on Blackboard locations of online course components, textbook or course content elaboration, additional guidance on assessment requirements, or general advice from other students. Questions that are specific in nature, such as inquiries regarding assessment/assignment grades or personal accommodation requests, are NOT to be posted on this forum. If you have questions, comments, or concerns of a non- public nature, please feel free to email your professor. Responses to your post will be addressed or emailed by the professor within 48 hours. Before posting, please ensure that you have read all relevant course documentation, including the syllabus, assessment/assignment instructions, faculty feedback, and other important information. Student Break Room
- 59. This communication forum allows for casual conversation with your classmates. Communication on this forum should always maintain a standard of appropriateness and respect for your fellow classmates. This forum should NOT be used to share assessment answers. Grading Discussion Boards (8 @ 2%) = 16% Scholarly Activities (5 @ 9%) = 45% Unit III Case Study = 12% Unit V Essay = 12% Unit VIII Research Paper = 15% Total = 100% Course Schedule/Checklist (PLEASE PRINT) The following pages contain a printable Course Schedule to assist you through this course. By following this schedule, you will be assured that you will complete the course within the time allotted. https://online.columbiasouthern.edu/CSU_Content/common_file s/instructions/DB/Create_New_Thread_Subscribe.pdf MEE 6201, Advanced Pollution Prevention 8
- 60. MEE 6201, Advanced Pollution Prevention Course Schedule By following this schedule, you will be assured that you will complete the course within the time allotted. Please keep this schedule for reference as you progress through your course. Unit I Introduction to Pollution Prevention Read: ide Discuss: Discussion Board question by Saturday,11:59 p.m (Central Time) Discussion Board response by Tuesday,11:59 p.m (Central Time) Time) Notes/Goals:
- 61. Unit II Life Cycle Assessment as it Relates to Pollution Prevention Read: The material life cycle Discuss: Discussion Board question by Saturday,11:59 p.m (Central Time) Discussion Board response by Tuesday,11:59 p.m (Central Time) Time) Notes/Goals:
- 62. MEE 6201, Advanced Pollution Prevention 9 MEE 6201, Advanced Pollution Prevention Course Schedule Unit III Pollution Prevention Audits Read: -audits and eco-audit tools ase studies: eco-audits Discuss: Discussion Board question by Saturday,11:59 p.m (Central Time) cussion Board Comment: Comment on another student’s Discussion Board response by Tuesday,11:59 p.m (Central Time) Notes/Goals:
- 63. Unit IV Pollution Prevention in Specific Industries – Construction, Electronics, and Coal-Fired Power Plants Read: Discuss: Discussion Board question by Saturday,11:59 p.m (Central Time) Discussion Board response by Tuesday,11:59 p.m (Central Time) Time) Notes/Goals: Unit V Pollution Prevention in Specific Industries – Dry
- 64. Cleaning and Hydraulic Fracturing Read: Discuss: e: Submit your response to the Discussion Board question by Saturday,11:59 p.m (Central Time) Discussion Board response by Tuesday,11:59 p.m (Central Time) (Central Time) Notes/Goals: MEE 6201, Advanced Pollution Prevention 10 MEE 6201, Advanced Pollution Prevention Course Schedule Unit VI Pollution Prevention in Specific Industries – Pulp and
- 65. Paper Milling and Concrete Paving Review: Read: Discuss: Discussion Board question by Saturday,11:59 p.m (Central Time) oard Comment: Comment on another student’s Discussion Board response by Tuesday,11:59 p.m (Central Time) Time) Notes/Goals: Unit VII Pollution Prevention Economics t Study Guide Discuss:
- 66. Discussion Board question by Saturday,11:59 p.m (Central Time) Discussion Board response by Tuesday,11:59 p.m (Central Time) Time) Notes/Goals: Unit VIII Corporate Philosophy Read: Guide Discuss: Discussion Board question by Saturday,11:59 p.m (Central Time) Discussion Board response by
- 67. Tuesday,11:59 p.m (Central Time) Notes/Goals: