Download to read offline


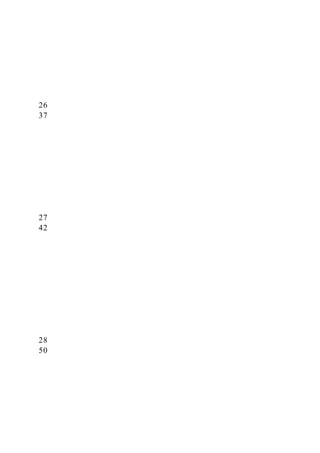
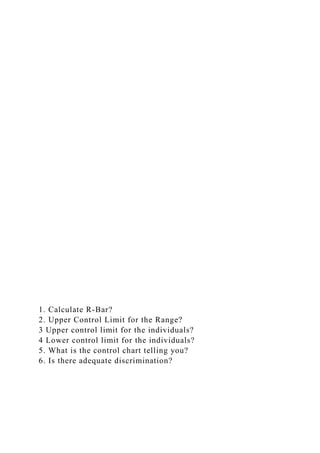


The document consists of a data table listing hours and corresponding cycle times for a 24-hour period. It also poses several questions related to statistical process control, including calculations for r-bar, control limits, and interpretations of the control chart. The aim is to assess the process's performance and the adequacy of discrimination in the control chart.


