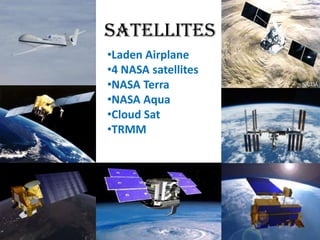
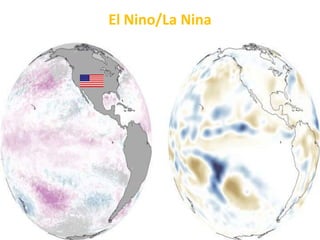
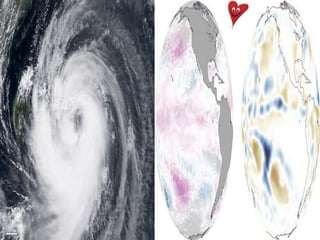
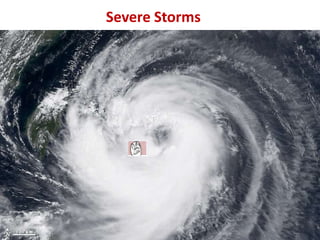
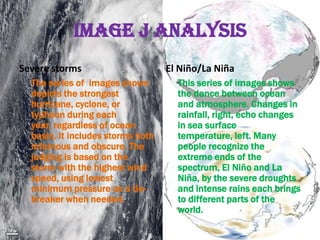
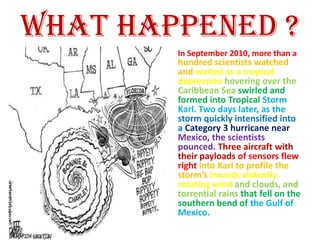
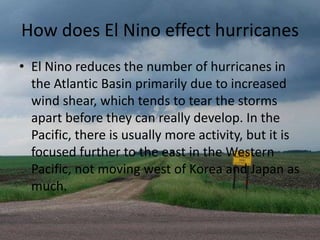
SlideShare a Scribd company logo
1 of 13
Gripping
hurricanes
again
By: August Sempsrott
Alex nordell
hurricaneshurricaneshurricaneshurricaneshurricaneshurricaneshurricaneshurricaneshurricaneshurricaneshu
rricaneshurricaneshurricaneshurricaneshurricaneshurricaneshurricaneshurricaneshurricaneshurricaneshurri

                     By: Natasha Vizcarra
caneshurricaneshurricaneshurricaneshurricaneshurricaneshurricaneshurricaneshurricaneshurricaneshurrica
neshurricaneshurricaneshurricaneshurricaneshurricaneshurricaneshurricaneshurricaneshurricaneshurricane
shurricaneshurricaneshurricaneshurricaneshurricaneshurricaneshurricaneshurricaneshurricaneshurricanesh
urricaneshurricaneshurricaneshurricaneshurricaneshurricaneshurricaneshurricaneshurricaneshurricaneshurr
icaneshurricaneshurricaneshurricaneshurricaneshurricaneshurricaneshurricaneshurricaneshurricaneshurrica
neshurricaneshurricaneshurricaneshurricaneshurricaneshurricaneshurricaneshurricaneshurricaneshurricane
shurricaneshurricaneshurricaneshurricaneshurricaneshurricaneshurricaneshurricaneshurricaneshurricanesh
urricaneshurricaneshurricaneshurricaneshurricaneshurricaneshurricaneshurricaneshurricaneshurricaneshurr
Satellites
•Laden Airplane
•4 NASA satellites
•NASA Terra
•NASA Aqua
•Cloud Sat
•TRMM
“GRIP’s mission is to
Why did they do this?   understand the physical
                        processes happening in
                        a hurricane, but we will
                        also take that
                        information to improve
                        forecasts,” said Michael
                        Goodman, an
                        atmospheric scientist at
                        NASA Marshall Space
                        Flight Center.
Their Findings
“By having multiple aircraft with the   Nine months after the field
right array of sensors, we measured     mission and in the midst of
several different aspects of the        processing the large amount of
storm simultaneously,” Braun said.
“We measured characteristics of the     data they collected, the
large-scale environment better, but     scientists are seeing glimmers
we also measured the evolution of       of surprising observations that
these smaller cloud systems, how        challenge what they thought
they evolved into bigger cloud          they already knew about
systems, and hopefully how they         hurricanes. Although still raw
were interacting with the
environment.” In addition to three      and very preliminary, the data
aircraft loaded with updated and        are prompting the GRIP
new instruments, the NASA               scientists to ask new questions.
Terra, Aqua, Cloud Sat, and Tropical    “You don’t often go into the
Rainfall Measuring Mission (TRMM)       field and come off the airplane
satellites captured the hurricanes’     and have ‘Eureka!’
clouds and rainfall, as well as
environmental conditions from
space.
Three hundred
  scientists, engineers, pilots, and crew who
   have been pursuing hurricanes to gather
     more observations through the NASA
 Genesis and Rapid Intensification Processes
   (GRIP) experiment. The scientists tracked
   and studied several storms in August and
September of 2010, as they formed over the
   Atlantic Ocean and either petered out or
grew into much larger hurricanes. They took
 measurements in, outside, and around the
storms using sensor-laden airplanes and four
     NASA satellites watching from space.
El Nino/La Nina
Severe Storms
Image J Analysis
Severe storms                      El Niño/La Niña
  The series of images shown         This series of images shows
  depicts the strongest              the dance between ocean
  hurricane, cyclone, or             and atmosphere. Changes in
  typhoon during each                rainfall, right, echo changes
  year, regardless of ocean          in sea surface
  basin. It includes storms both     temperature, left. Many
  infamous and obscure. The          people recognize the
  judging is based on the            extreme ends of the
  storm with the highest wind        spectrum, El Niño and La
  speed, using lowest                Niña, by the severe droughts
  minimum pressure as a tie-         and intense rains each brings
  breaker when needed.               to different parts of the
                                     world.
What happened ?
        In September 2010, more than a
        hundred scientists watched
        and waited as a tropical
        depression hovering over the
        Caribbean Sea swirled and
        formed into Tropical Storm
        Karl. Two days later, as the
        storm quickly intensified into
        a Category 3 hurricane near
        Mexico, the scientists
        pounced. Three aircraft with
        their payloads of sensors flew
        right into Karl to profile the
        storm’s innards violently
        rotating wind and clouds, and
        torrential rains that fell on the
        southern bend of the Gulf of
        Mexico.
Today's lesson: Hurricanes!
With hurricanes it turns out, forecasting
a storm’s intensity is a trickier problem
to solve. A storm’s track is an easier
problem to figure out, Storms are
steered around by the surrounding
winds, which in turn are governed by the
pattern of trade winds that push the
ocean around in the tropics. Large-scale
processes like the trade winds evolve
more slowly which makes them, in some
ways, more predictable. To the extent
that               we are able to observe
the large               scale
winds, scientists can
   forecast track pretty readily.
How does El Nino effect hurricanes
• El Nino reduces the number of hurricanes in
  the Atlantic Basin primarily due to increased
  wind shear, which tends to tear the storms
  apart before they can really develop. In the
  Pacific, there is usually more activity, but it is
  focused further to the east in the Western
  Pacific, not moving west of Korea and Japan as
  much.

More Related Content

What's hot

Lesson 4 the weather
Lesson 4   the weatherLesson 4   the weather
Lesson 4 the weatherpauenglish
 
Weather forecasting
Weather forecastingWeather forecasting
Weather forecastingESSBY
 
Richter scale and mercalli scale
Richter scale and mercalli scaleRichter scale and mercalli scale
Richter scale and mercalli scaleWaleed Liaqat
 
Solar energy and it's affect on Earth's atmosphere
Solar energy and it's affect on Earth's atmosphereSolar energy and it's affect on Earth's atmosphere
Solar energy and it's affect on Earth's atmosphereJeremy Lowe
 
CAPSTONE course_Aerosol Distribution
CAPSTONE course_Aerosol DistributionCAPSTONE course_Aerosol Distribution
CAPSTONE course_Aerosol DistributionTurner H. Glasgow
 
Earthquakes lesson 115
Earthquakes lesson 115Earthquakes lesson 115
Earthquakes lesson 115ladymandona
 
History of meteorology
History of meteorologyHistory of meteorology
History of meteorologyflorenceann
 
History of meteorology and invention of weather instruments by lota joy
History of meteorology and invention of weather instruments by lota joyHistory of meteorology and invention of weather instruments by lota joy
History of meteorology and invention of weather instruments by lota joyLotz Malaluan
 
Tornados, hurricanes and global weather
Tornados, hurricanes and global weatherTornados, hurricanes and global weather
Tornados, hurricanes and global weathercbrannon
 
history of meteorology and weather instrument
history of meteorology and weather instrumenthistory of meteorology and weather instrument
history of meteorology and weather instrumentJhessa France Dela Cruz
 
Structure of the atmosphere (1)
Structure of the atmosphere (1)Structure of the atmosphere (1)
Structure of the atmosphere (1)lekshmisunil
 
Predictability of groundwater drought severity in Sweden - Ezra Haaf, Ronja J...
Predictability of groundwater drought severity in Sweden - Ezra Haaf, Ronja J...Predictability of groundwater drought severity in Sweden - Ezra Haaf, Ronja J...
Predictability of groundwater drought severity in Sweden - Ezra Haaf, Ronja J...Geological Survey of Sweden
 
Atmosphere Activity
Atmosphere ActivityAtmosphere Activity
Atmosphere ActivityDavid Genis
 
OLM Science6_15
OLM Science6_15OLM Science6_15
OLM Science6_15gosomers
 

What's hot (20)

Lesson 4 the weather
Lesson 4   the weatherLesson 4   the weather
Lesson 4 the weather
 
Weather forecasting
Weather forecastingWeather forecasting
Weather forecasting
 
Weather Factors and Instruments
Weather Factors and InstrumentsWeather Factors and Instruments
Weather Factors and Instruments
 
Earthquake .tani
Earthquake .taniEarthquake .tani
Earthquake .tani
 
19. atmospheric processes 2
19. atmospheric processes 219. atmospheric processes 2
19. atmospheric processes 2
 
Xiao & Chris%27s poster
Xiao & Chris%27s posterXiao & Chris%27s poster
Xiao & Chris%27s poster
 
Richter scale and mercalli scale
Richter scale and mercalli scaleRichter scale and mercalli scale
Richter scale and mercalli scale
 
Solar energy and it's affect on Earth's atmosphere
Solar energy and it's affect on Earth's atmosphereSolar energy and it's affect on Earth's atmosphere
Solar energy and it's affect on Earth's atmosphere
 
CAPSTONE course_Aerosol Distribution
CAPSTONE course_Aerosol DistributionCAPSTONE course_Aerosol Distribution
CAPSTONE course_Aerosol Distribution
 
Earthquakes lesson 115
Earthquakes lesson 115Earthquakes lesson 115
Earthquakes lesson 115
 
History of meteorology
History of meteorologyHistory of meteorology
History of meteorology
 
History of meteorology and invention of weather instruments by lota joy
History of meteorology and invention of weather instruments by lota joyHistory of meteorology and invention of weather instruments by lota joy
History of meteorology and invention of weather instruments by lota joy
 
Weather and Climate
Weather and ClimateWeather and Climate
Weather and Climate
 
Climate vs Weather
Climate vs WeatherClimate vs Weather
Climate vs Weather
 
Tornados, hurricanes and global weather
Tornados, hurricanes and global weatherTornados, hurricanes and global weather
Tornados, hurricanes and global weather
 
history of meteorology and weather instrument
history of meteorology and weather instrumenthistory of meteorology and weather instrument
history of meteorology and weather instrument
 
Structure of the atmosphere (1)
Structure of the atmosphere (1)Structure of the atmosphere (1)
Structure of the atmosphere (1)
 
Predictability of groundwater drought severity in Sweden - Ezra Haaf, Ronja J...
Predictability of groundwater drought severity in Sweden - Ezra Haaf, Ronja J...Predictability of groundwater drought severity in Sweden - Ezra Haaf, Ronja J...
Predictability of groundwater drought severity in Sweden - Ezra Haaf, Ronja J...
 
Atmosphere Activity
Atmosphere ActivityAtmosphere Activity
Atmosphere Activity
 
OLM Science6_15
OLM Science6_15OLM Science6_15
OLM Science6_15
 

Viewers also liked

Neopaleolimnology of urban and suburban lakes in multidisciplinary geoscience...
Neopaleolimnology of urban and suburban lakes in multidisciplinary geoscience...Neopaleolimnology of urban and suburban lakes in multidisciplinary geoscience...
Neopaleolimnology of urban and suburban lakes in multidisciplinary geoscience...SERC at Carleton College
 
Connecting the dots from “Hand Outs” to Research-based Pedagogy: ...
Connecting the dots from “Hand Outs” to Research-based Pedagogy: ...Connecting the dots from “Hand Outs” to Research-based Pedagogy: ...
Connecting the dots from “Hand Outs” to Research-based Pedagogy: ...SERC at Carleton College
 
Sea Chlorophyll and Temperature Project PPT
Sea Chlorophyll and Temperature Project PPTSea Chlorophyll and Temperature Project PPT
Sea Chlorophyll and Temperature Project PPTSERC at Carleton College
 

Viewers also liked (7)

Mapping Evidence: The Trash Bag Killer
Mapping Evidence: The Trash Bag KillerMapping Evidence: The Trash Bag Killer
Mapping Evidence: The Trash Bag Killer
 
03 Introduction to Carbon Cycle
03 Introduction to Carbon Cycle03 Introduction to Carbon Cycle
03 Introduction to Carbon Cycle
 
Neopaleolimnology of urban and suburban lakes in multidisciplinary geoscience...
Neopaleolimnology of urban and suburban lakes in multidisciplinary geoscience...Neopaleolimnology of urban and suburban lakes in multidisciplinary geoscience...
Neopaleolimnology of urban and suburban lakes in multidisciplinary geoscience...
 
Are we melting
Are we meltingAre we melting
Are we melting
 
Connecting the dots from “Hand Outs” to Research-based Pedagogy: ...
Connecting the dots from “Hand Outs” to Research-based Pedagogy: ...Connecting the dots from “Hand Outs” to Research-based Pedagogy: ...
Connecting the dots from “Hand Outs” to Research-based Pedagogy: ...
 
Sea Chlorophyll and Temperature Project PPT
Sea Chlorophyll and Temperature Project PPTSea Chlorophyll and Temperature Project PPT
Sea Chlorophyll and Temperature Project PPT
 
Sea Surface temperature
Sea Surface temperatureSea Surface temperature
Sea Surface temperature
 

Similar to NASA scientists track hurricanes to understand intensification

Fiji Times article - Energy to destroy 06-04-2015
Fiji Times article - Energy to destroy 06-04-2015Fiji Times article - Energy to destroy 06-04-2015
Fiji Times article - Energy to destroy 06-04-2015Ashneel Chandra
 
Hurricanes
HurricanesHurricanes
HurricanesRaza Ch
 
252 CHAPTER 8Geologic Time (232 chapter 7Fire.docx
252      CHAPTER 8Geologic Time (232      chapter 7Fire.docx252      CHAPTER 8Geologic Time (232      chapter 7Fire.docx
252 CHAPTER 8Geologic Time (232 chapter 7Fire.docxeugeniadean34240
 
Weather and climate by Daniel Portelli 3.02
Weather and climate by Daniel Portelli 3.02Weather and climate by Daniel Portelli 3.02
Weather and climate by Daniel Portelli 3.02geographystudents
 
Weather-and-Climate-PPT-Dacquiado-Amiel-V.pptx
Weather-and-Climate-PPT-Dacquiado-Amiel-V.pptxWeather-and-Climate-PPT-Dacquiado-Amiel-V.pptx
Weather-and-Climate-PPT-Dacquiado-Amiel-V.pptxFrancis de Castro
 
Eyewall replacement cycle - Wiki
Eyewall replacement cycle - WikiEyewall replacement cycle - Wiki
Eyewall replacement cycle - WikiNot Relevant
 
04VolcanicRelief.ppt
04VolcanicRelief.ppt04VolcanicRelief.ppt
04VolcanicRelief.pptEnginAltan4
 
Active and inactive faults
Active and inactive faultsActive and inactive faults
Active and inactive faultsJowemIvanBabao
 
Resilient NJ Shore 12 7-12 broccoli
Resilient NJ Shore 12 7-12 broccoliResilient NJ Shore 12 7-12 broccoli
Resilient NJ Shore 12 7-12 broccoliNew Jersey Future
 
NISAR NASA-ISRO Synthetic Aperture Radar (NISAR) Volcanic Hazards
NISAR NASA-ISRO Synthetic Aperture Radar (NISAR)  Volcanic HazardsNISAR NASA-ISRO Synthetic Aperture Radar (NISAR)  Volcanic Hazards
NISAR NASA-ISRO Synthetic Aperture Radar (NISAR) Volcanic HazardsDr. Pankaj Dhussa
 
N A S A Supporting Earth System Science 2005
N A S A  Supporting  Earth  System  Science 2005N A S A  Supporting  Earth  System  Science 2005
N A S A Supporting Earth System Science 2005Peerasak C.
 
Stealing the Oceans: Humanity Struggles for Survival in This 1000 Year Epic W...
Stealing the Oceans: Humanity Struggles for Survival in This 1000 Year Epic W...Stealing the Oceans: Humanity Struggles for Survival in This 1000 Year Epic W...
Stealing the Oceans: Humanity Struggles for Survival in This 1000 Year Epic W...Rick Doble
 
Technology & disaster
Technology & disasterTechnology & disaster
Technology & disasterdgoodpaster1
 
Largest Volcano on Earth
Largest Volcano on EarthLargest Volcano on Earth
Largest Volcano on EarthJames Dunn
 
NISAR NASA-ISRO Synthetic Aperture Radar (NISAR) Induced Seismicity
NISAR NASA-ISRO Synthetic Aperture Radar (NISAR) Induced SeismicityNISAR NASA-ISRO Synthetic Aperture Radar (NISAR) Induced Seismicity
NISAR NASA-ISRO Synthetic Aperture Radar (NISAR) Induced SeismicityDr. Pankaj Dhussa
 
Meteorologcal application of satellites
Meteorologcal application of satellitesMeteorologcal application of satellites
Meteorologcal application of satellitesSARANYA VS
 

Similar to NASA scientists track hurricanes to understand intensification (20)

Fiji Times article - Energy to destroy 06-04-2015
Fiji Times article - Energy to destroy 06-04-2015Fiji Times article - Energy to destroy 06-04-2015
Fiji Times article - Energy to destroy 06-04-2015
 
Hurricanes
HurricanesHurricanes
Hurricanes
 
252 CHAPTER 8Geologic Time (232 chapter 7Fire.docx
252      CHAPTER 8Geologic Time (232      chapter 7Fire.docx252      CHAPTER 8Geologic Time (232      chapter 7Fire.docx
252 CHAPTER 8Geologic Time (232 chapter 7Fire.docx
 
hurricanes-math
hurricanes-mathhurricanes-math
hurricanes-math
 
Weather and climate by Daniel Portelli 3.02
Weather and climate by Daniel Portelli 3.02Weather and climate by Daniel Portelli 3.02
Weather and climate by Daniel Portelli 3.02
 
Weather-and-Climate-PPT-Dacquiado-Amiel-V.pptx
Weather-and-Climate-PPT-Dacquiado-Amiel-V.pptxWeather-and-Climate-PPT-Dacquiado-Amiel-V.pptx
Weather-and-Climate-PPT-Dacquiado-Amiel-V.pptx
 
Eyewall replacement cycle - Wiki
Eyewall replacement cycle - WikiEyewall replacement cycle - Wiki
Eyewall replacement cycle - Wiki
 
04VolcanicRelief.ppt
04VolcanicRelief.ppt04VolcanicRelief.ppt
04VolcanicRelief.ppt
 
New Energy Part 3: The Science - Why we need New Energy now
New Energy Part 3: The Science - Why we need New Energy nowNew Energy Part 3: The Science - Why we need New Energy now
New Energy Part 3: The Science - Why we need New Energy now
 
Active and inactive faults
Active and inactive faultsActive and inactive faults
Active and inactive faults
 
Resilient NJ Shore 12 7-12 broccoli
Resilient NJ Shore 12 7-12 broccoliResilient NJ Shore 12 7-12 broccoli
Resilient NJ Shore 12 7-12 broccoli
 
NISAR NASA-ISRO Synthetic Aperture Radar (NISAR) Volcanic Hazards
NISAR NASA-ISRO Synthetic Aperture Radar (NISAR)  Volcanic HazardsNISAR NASA-ISRO Synthetic Aperture Radar (NISAR)  Volcanic Hazards
NISAR NASA-ISRO Synthetic Aperture Radar (NISAR) Volcanic Hazards
 
N A S A Supporting Earth System Science 2005
N A S A  Supporting  Earth  System  Science 2005N A S A  Supporting  Earth  System  Science 2005
N A S A Supporting Earth System Science 2005
 
Stealing the Oceans: Humanity Struggles for Survival in This 1000 Year Epic W...
Stealing the Oceans: Humanity Struggles for Survival in This 1000 Year Epic W...Stealing the Oceans: Humanity Struggles for Survival in This 1000 Year Epic W...
Stealing the Oceans: Humanity Struggles for Survival in This 1000 Year Epic W...
 
Mauna Kea - TMT - Aloha means Hello and Goodbye
Mauna Kea - TMT - Aloha  means Hello and Goodbye Mauna Kea - TMT - Aloha  means Hello and Goodbye
Mauna Kea - TMT - Aloha means Hello and Goodbye
 
Technology & disaster
Technology & disasterTechnology & disaster
Technology & disaster
 
Largest Volcano on Earth
Largest Volcano on EarthLargest Volcano on Earth
Largest Volcano on Earth
 
HURRICANES
HURRICANESHURRICANES
HURRICANES
 
NISAR NASA-ISRO Synthetic Aperture Radar (NISAR) Induced Seismicity
NISAR NASA-ISRO Synthetic Aperture Radar (NISAR) Induced SeismicityNISAR NASA-ISRO Synthetic Aperture Radar (NISAR) Induced Seismicity
NISAR NASA-ISRO Synthetic Aperture Radar (NISAR) Induced Seismicity
 
Meteorologcal application of satellites
Meteorologcal application of satellitesMeteorologcal application of satellites
Meteorologcal application of satellites
 

More from SERC at Carleton College

StatVignette03_Sig.Figs_v04_07_15_2020.pptx
StatVignette03_Sig.Figs_v04_07_15_2020.pptxStatVignette03_Sig.Figs_v04_07_15_2020.pptx
StatVignette03_Sig.Figs_v04_07_15_2020.pptxSERC at Carleton College
 
Cretaceous Coatlines and Modern Voting Patterns Presentation
Cretaceous Coatlines and Modern Voting Patterns PresentationCretaceous Coatlines and Modern Voting Patterns Presentation
Cretaceous Coatlines and Modern Voting Patterns PresentationSERC at Carleton College
 
Presentation: Unit 1 Introduction to the hydrological cycle
Presentation: Unit 1 Introduction to the hydrological cyclePresentation: Unit 1 Introduction to the hydrological cycle
Presentation: Unit 1 Introduction to the hydrological cycleSERC at Carleton College
 
KSKL_Chapter 4_ Chem Properties of Soils.pptx
KSKL_Chapter 4_ Chem Properties of Soils.pptxKSKL_Chapter 4_ Chem Properties of Soils.pptx
KSKL_Chapter 4_ Chem Properties of Soils.pptxSERC at Carleton College
 
Presentation: Unit 3 background information
Presentation: Unit 3 background informationPresentation: Unit 3 background information
Presentation: Unit 3 background informationSERC at Carleton College
 
Presentation: Unit 2 Measuring Groundwater Background Information
Presentation: Unit 2 Measuring Groundwater Background InformationPresentation: Unit 2 Measuring Groundwater Background Information
Presentation: Unit 2 Measuring Groundwater Background InformationSERC at Carleton College
 

More from SERC at Carleton College (20)

StatVignette03_Sig.Figs_v04_07_15_2020.pptx
StatVignette03_Sig.Figs_v04_07_15_2020.pptxStatVignette03_Sig.Figs_v04_07_15_2020.pptx
StatVignette03_Sig.Figs_v04_07_15_2020.pptx
 
StatVignette06_HypTesting.pptx
StatVignette06_HypTesting.pptxStatVignette06_HypTesting.pptx
StatVignette06_HypTesting.pptx
 
Unit 1 (optional slides)
Unit 1 (optional slides)Unit 1 (optional slides)
Unit 1 (optional slides)
 
Cretaceous Coatlines and Modern Voting Patterns Presentation
Cretaceous Coatlines and Modern Voting Patterns PresentationCretaceous Coatlines and Modern Voting Patterns Presentation
Cretaceous Coatlines and Modern Voting Patterns Presentation
 
Climate and Biomes PPT 2
Climate and Biomes PPT 2Climate and Biomes PPT 2
Climate and Biomes PPT 2
 
weather tracking ppt
weather tracking pptweather tracking ppt
weather tracking ppt
 
Presentation: Unit 1 Introduction to the hydrological cycle
Presentation: Unit 1 Introduction to the hydrological cyclePresentation: Unit 1 Introduction to the hydrological cycle
Presentation: Unit 1 Introduction to the hydrological cycle
 
StatVignette05_M3_v02_10_21_2020.pptx
StatVignette05_M3_v02_10_21_2020.pptxStatVignette05_M3_v02_10_21_2020.pptx
StatVignette05_M3_v02_10_21_2020.pptx
 
KSKL chapter 8 PPT
KSKL chapter 8 PPTKSKL chapter 8 PPT
KSKL chapter 8 PPT
 
KSKL chap 5 PPT
KSKL chap 5 PPTKSKL chap 5 PPT
KSKL chap 5 PPT
 
KSKL_Chapter 4_ Chem Properties of Soils.pptx
KSKL_Chapter 4_ Chem Properties of Soils.pptxKSKL_Chapter 4_ Chem Properties of Soils.pptx
KSKL_Chapter 4_ Chem Properties of Soils.pptx
 
Degraded Soil Images.pptx
Degraded Soil Images.pptxDegraded Soil Images.pptx
Degraded Soil Images.pptx
 
Educators PPT file chapter 7
Educators PPT file chapter 7Educators PPT file chapter 7
Educators PPT file chapter 7
 
Educators PPT file chapter 2
Educators PPT file chapter 2Educators PPT file chapter 2
Educators PPT file chapter 2
 
Educators PPT file chapter 6
Educators PPT file chapter 6Educators PPT file chapter 6
Educators PPT file chapter 6
 
Educators PPT chapter 3
Educators PPT chapter 3Educators PPT chapter 3
Educators PPT chapter 3
 
Unit 4 background presentation
Unit 4 background presentationUnit 4 background presentation
Unit 4 background presentation
 
Presentation: Unit 3 background information
Presentation: Unit 3 background informationPresentation: Unit 3 background information
Presentation: Unit 3 background information
 
Presentation: Unit 2 Measuring Groundwater Background Information
Presentation: Unit 2 Measuring Groundwater Background InformationPresentation: Unit 2 Measuring Groundwater Background Information
Presentation: Unit 2 Measuring Groundwater Background Information
 
Introduction to GPS presentation
Introduction to GPS presentationIntroduction to GPS presentation
Introduction to GPS presentation
 

NASA scientists track hurricanes to understand intensification

  • 2. hurricaneshurricaneshurricaneshurricaneshurricaneshurricaneshurricaneshurricaneshurricaneshurricaneshu rricaneshurricaneshurricaneshurricaneshurricaneshurricaneshurricaneshurricaneshurricaneshurricaneshurri By: Natasha Vizcarra caneshurricaneshurricaneshurricaneshurricaneshurricaneshurricaneshurricaneshurricaneshurricaneshurrica neshurricaneshurricaneshurricaneshurricaneshurricaneshurricaneshurricaneshurricaneshurricaneshurricane shurricaneshurricaneshurricaneshurricaneshurricaneshurricaneshurricaneshurricaneshurricaneshurricanesh urricaneshurricaneshurricaneshurricaneshurricaneshurricaneshurricaneshurricaneshurricaneshurricaneshurr icaneshurricaneshurricaneshurricaneshurricaneshurricaneshurricaneshurricaneshurricaneshurricaneshurrica neshurricaneshurricaneshurricaneshurricaneshurricaneshurricaneshurricaneshurricaneshurricaneshurricane shurricaneshurricaneshurricaneshurricaneshurricaneshurricaneshurricaneshurricaneshurricaneshurricanesh urricaneshurricaneshurricaneshurricaneshurricaneshurricaneshurricaneshurricaneshurricaneshurricaneshurr
  • 3. Satellites •Laden Airplane •4 NASA satellites •NASA Terra •NASA Aqua •Cloud Sat •TRMM
  • 4. “GRIP’s mission is to Why did they do this? understand the physical processes happening in a hurricane, but we will also take that information to improve forecasts,” said Michael Goodman, an atmospheric scientist at NASA Marshall Space Flight Center.
  • 5. Their Findings “By having multiple aircraft with the Nine months after the field right array of sensors, we measured mission and in the midst of several different aspects of the processing the large amount of storm simultaneously,” Braun said. “We measured characteristics of the data they collected, the large-scale environment better, but scientists are seeing glimmers we also measured the evolution of of surprising observations that these smaller cloud systems, how challenge what they thought they evolved into bigger cloud they already knew about systems, and hopefully how they hurricanes. Although still raw were interacting with the environment.” In addition to three and very preliminary, the data aircraft loaded with updated and are prompting the GRIP new instruments, the NASA scientists to ask new questions. Terra, Aqua, Cloud Sat, and Tropical “You don’t often go into the Rainfall Measuring Mission (TRMM) field and come off the airplane satellites captured the hurricanes’ and have ‘Eureka!’ clouds and rainfall, as well as environmental conditions from space.
  • 6. Three hundred scientists, engineers, pilots, and crew who have been pursuing hurricanes to gather more observations through the NASA Genesis and Rapid Intensification Processes (GRIP) experiment. The scientists tracked and studied several storms in August and September of 2010, as they formed over the Atlantic Ocean and either petered out or grew into much larger hurricanes. They took measurements in, outside, and around the storms using sensor-laden airplanes and four NASA satellites watching from space.
  • 8.
  • 10. Image J Analysis Severe storms El Niño/La Niña The series of images shown This series of images shows depicts the strongest the dance between ocean hurricane, cyclone, or and atmosphere. Changes in typhoon during each rainfall, right, echo changes year, regardless of ocean in sea surface basin. It includes storms both temperature, left. Many infamous and obscure. The people recognize the judging is based on the extreme ends of the storm with the highest wind spectrum, El Niño and La speed, using lowest Niña, by the severe droughts minimum pressure as a tie- and intense rains each brings breaker when needed. to different parts of the world.
  • 11. What happened ? In September 2010, more than a hundred scientists watched and waited as a tropical depression hovering over the Caribbean Sea swirled and formed into Tropical Storm Karl. Two days later, as the storm quickly intensified into a Category 3 hurricane near Mexico, the scientists pounced. Three aircraft with their payloads of sensors flew right into Karl to profile the storm’s innards violently rotating wind and clouds, and torrential rains that fell on the southern bend of the Gulf of Mexico.
  • 12. Today's lesson: Hurricanes! With hurricanes it turns out, forecasting a storm’s intensity is a trickier problem to solve. A storm’s track is an easier problem to figure out, Storms are steered around by the surrounding winds, which in turn are governed by the pattern of trade winds that push the ocean around in the tropics. Large-scale processes like the trade winds evolve more slowly which makes them, in some ways, more predictable. To the extent that we are able to observe the large scale winds, scientists can forecast track pretty readily.
  • 13. How does El Nino effect hurricanes • El Nino reduces the number of hurricanes in the Atlantic Basin primarily due to increased wind shear, which tends to tear the storms apart before they can really develop. In the Pacific, there is usually more activity, but it is focused further to the east in the Western Pacific, not moving west of Korea and Japan as much.