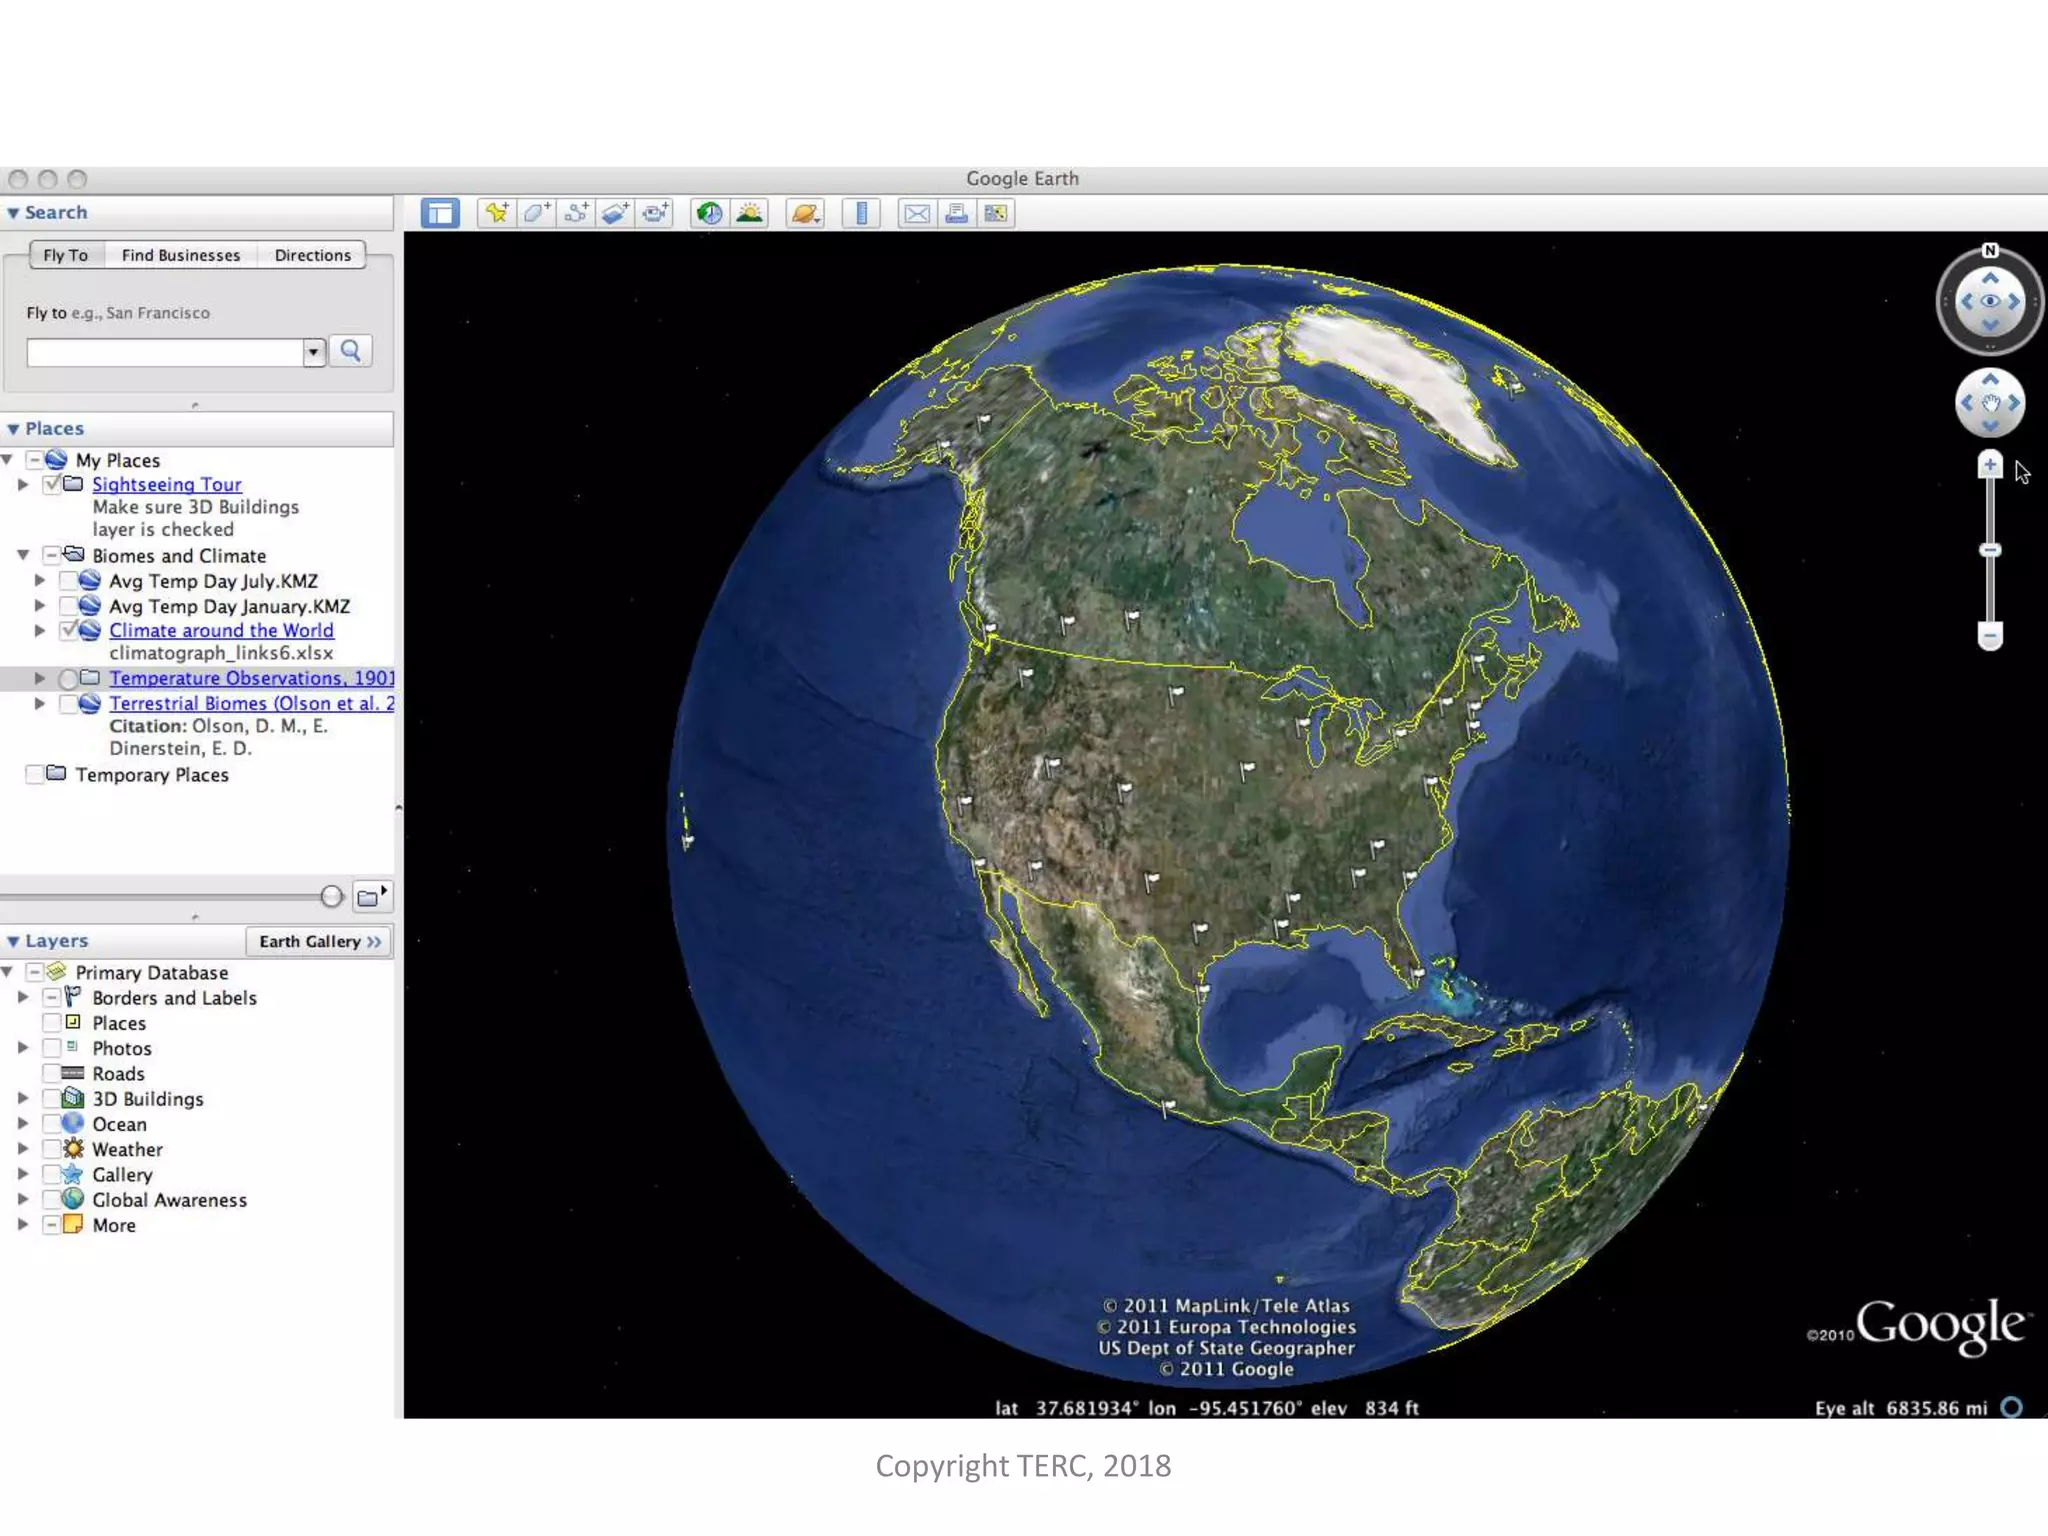
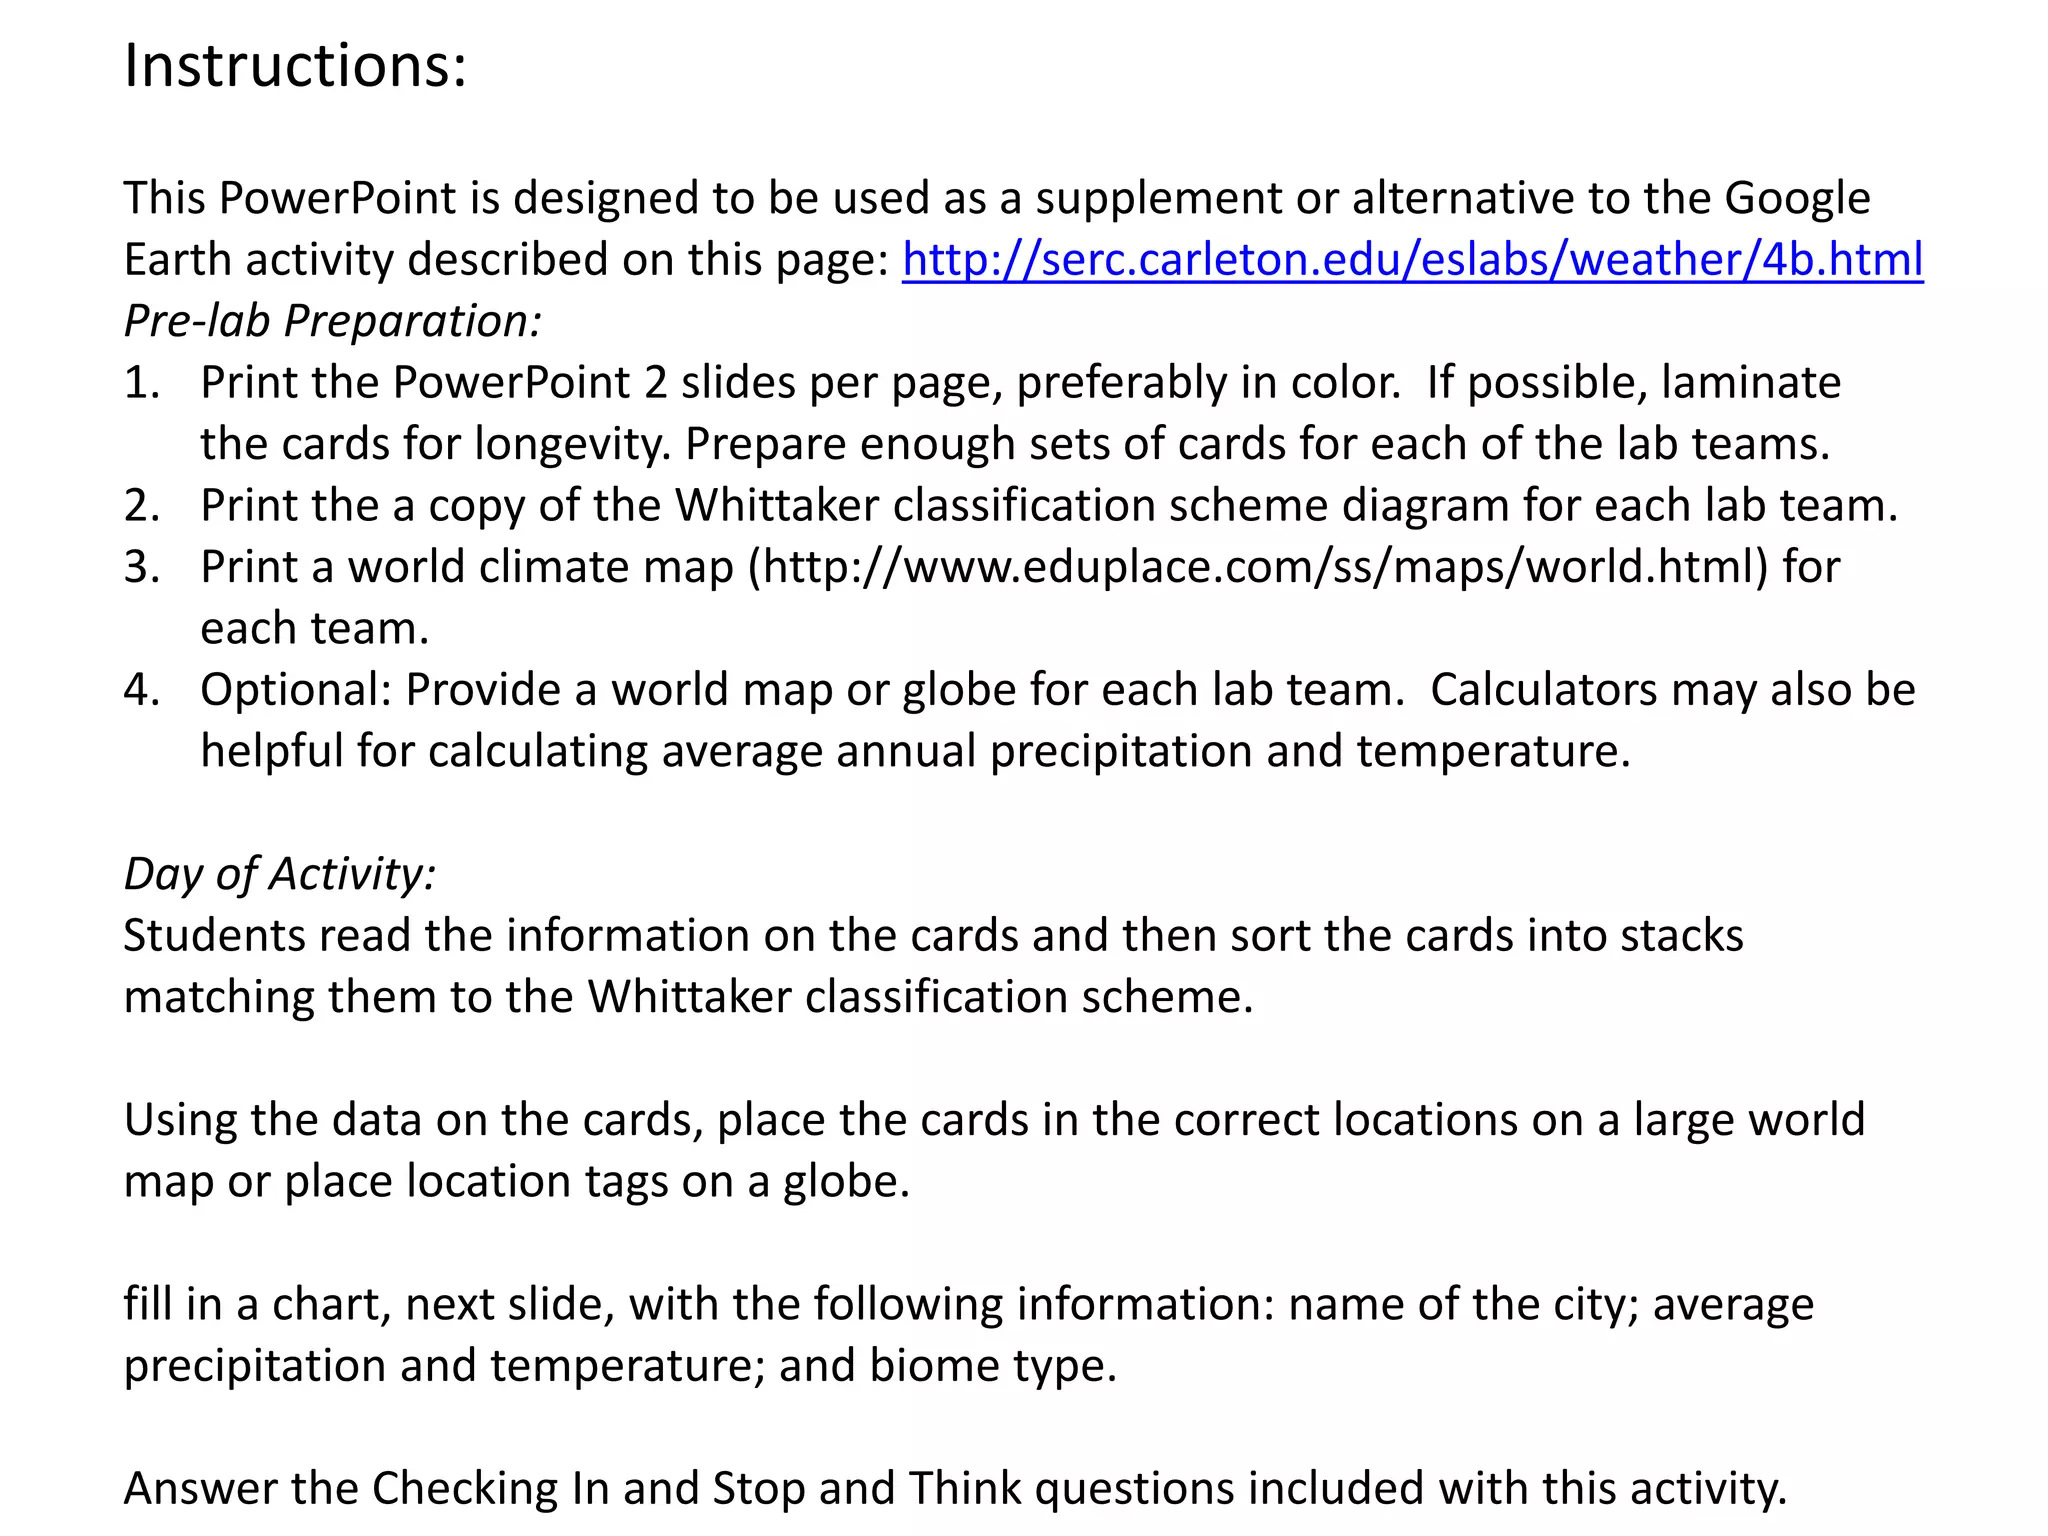
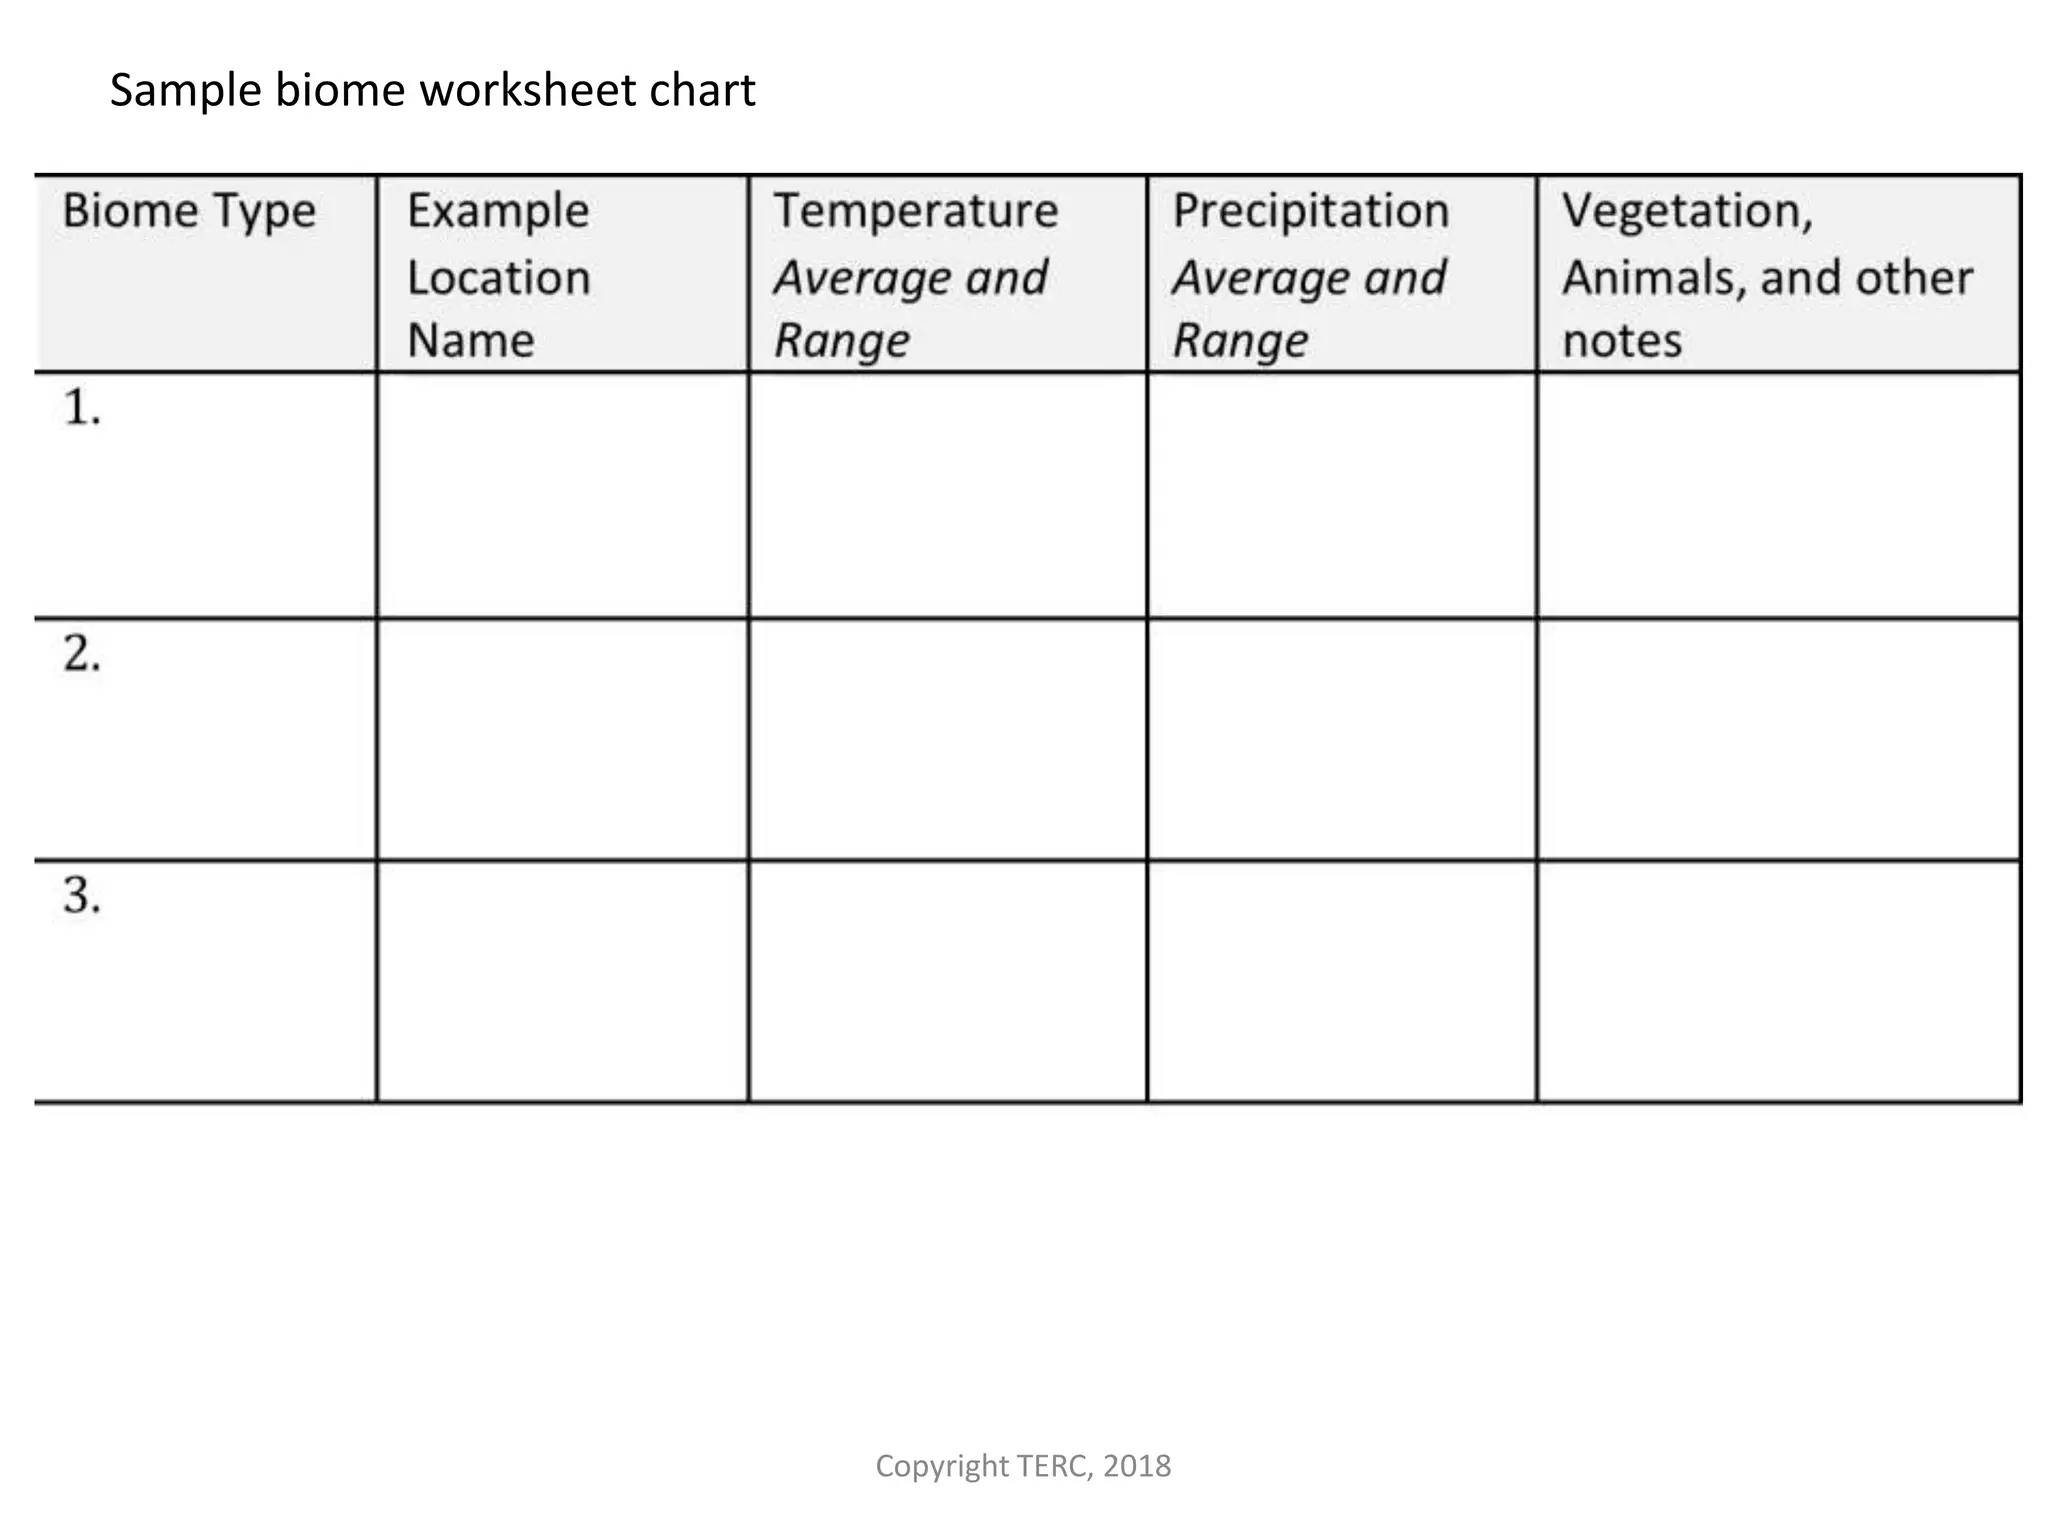
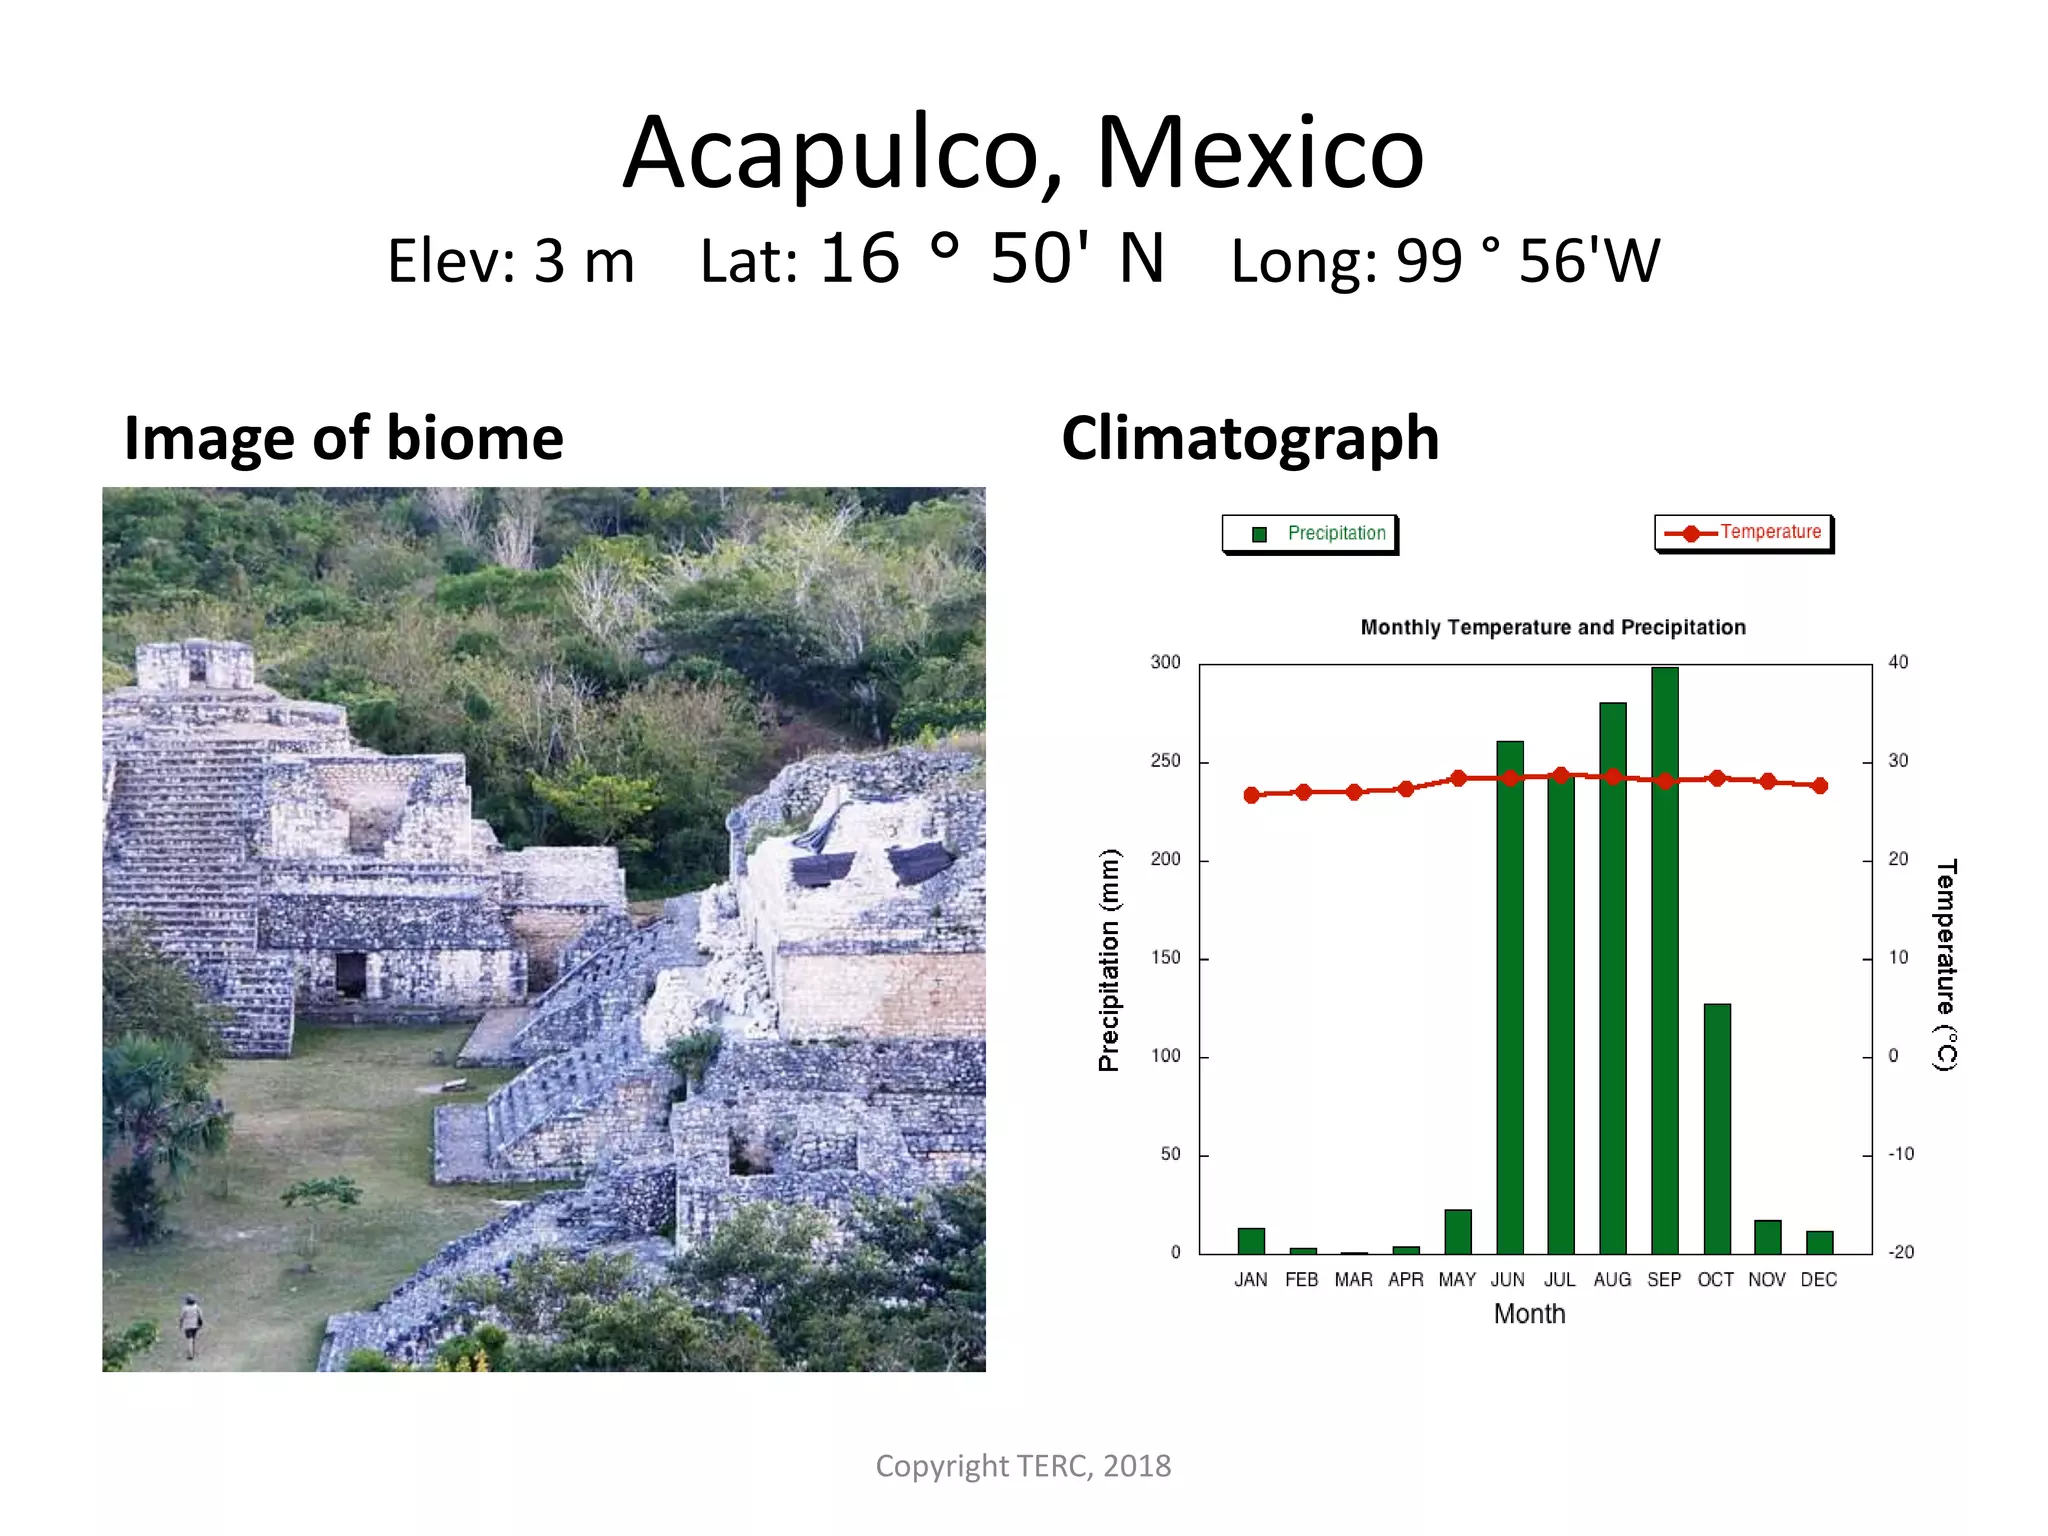
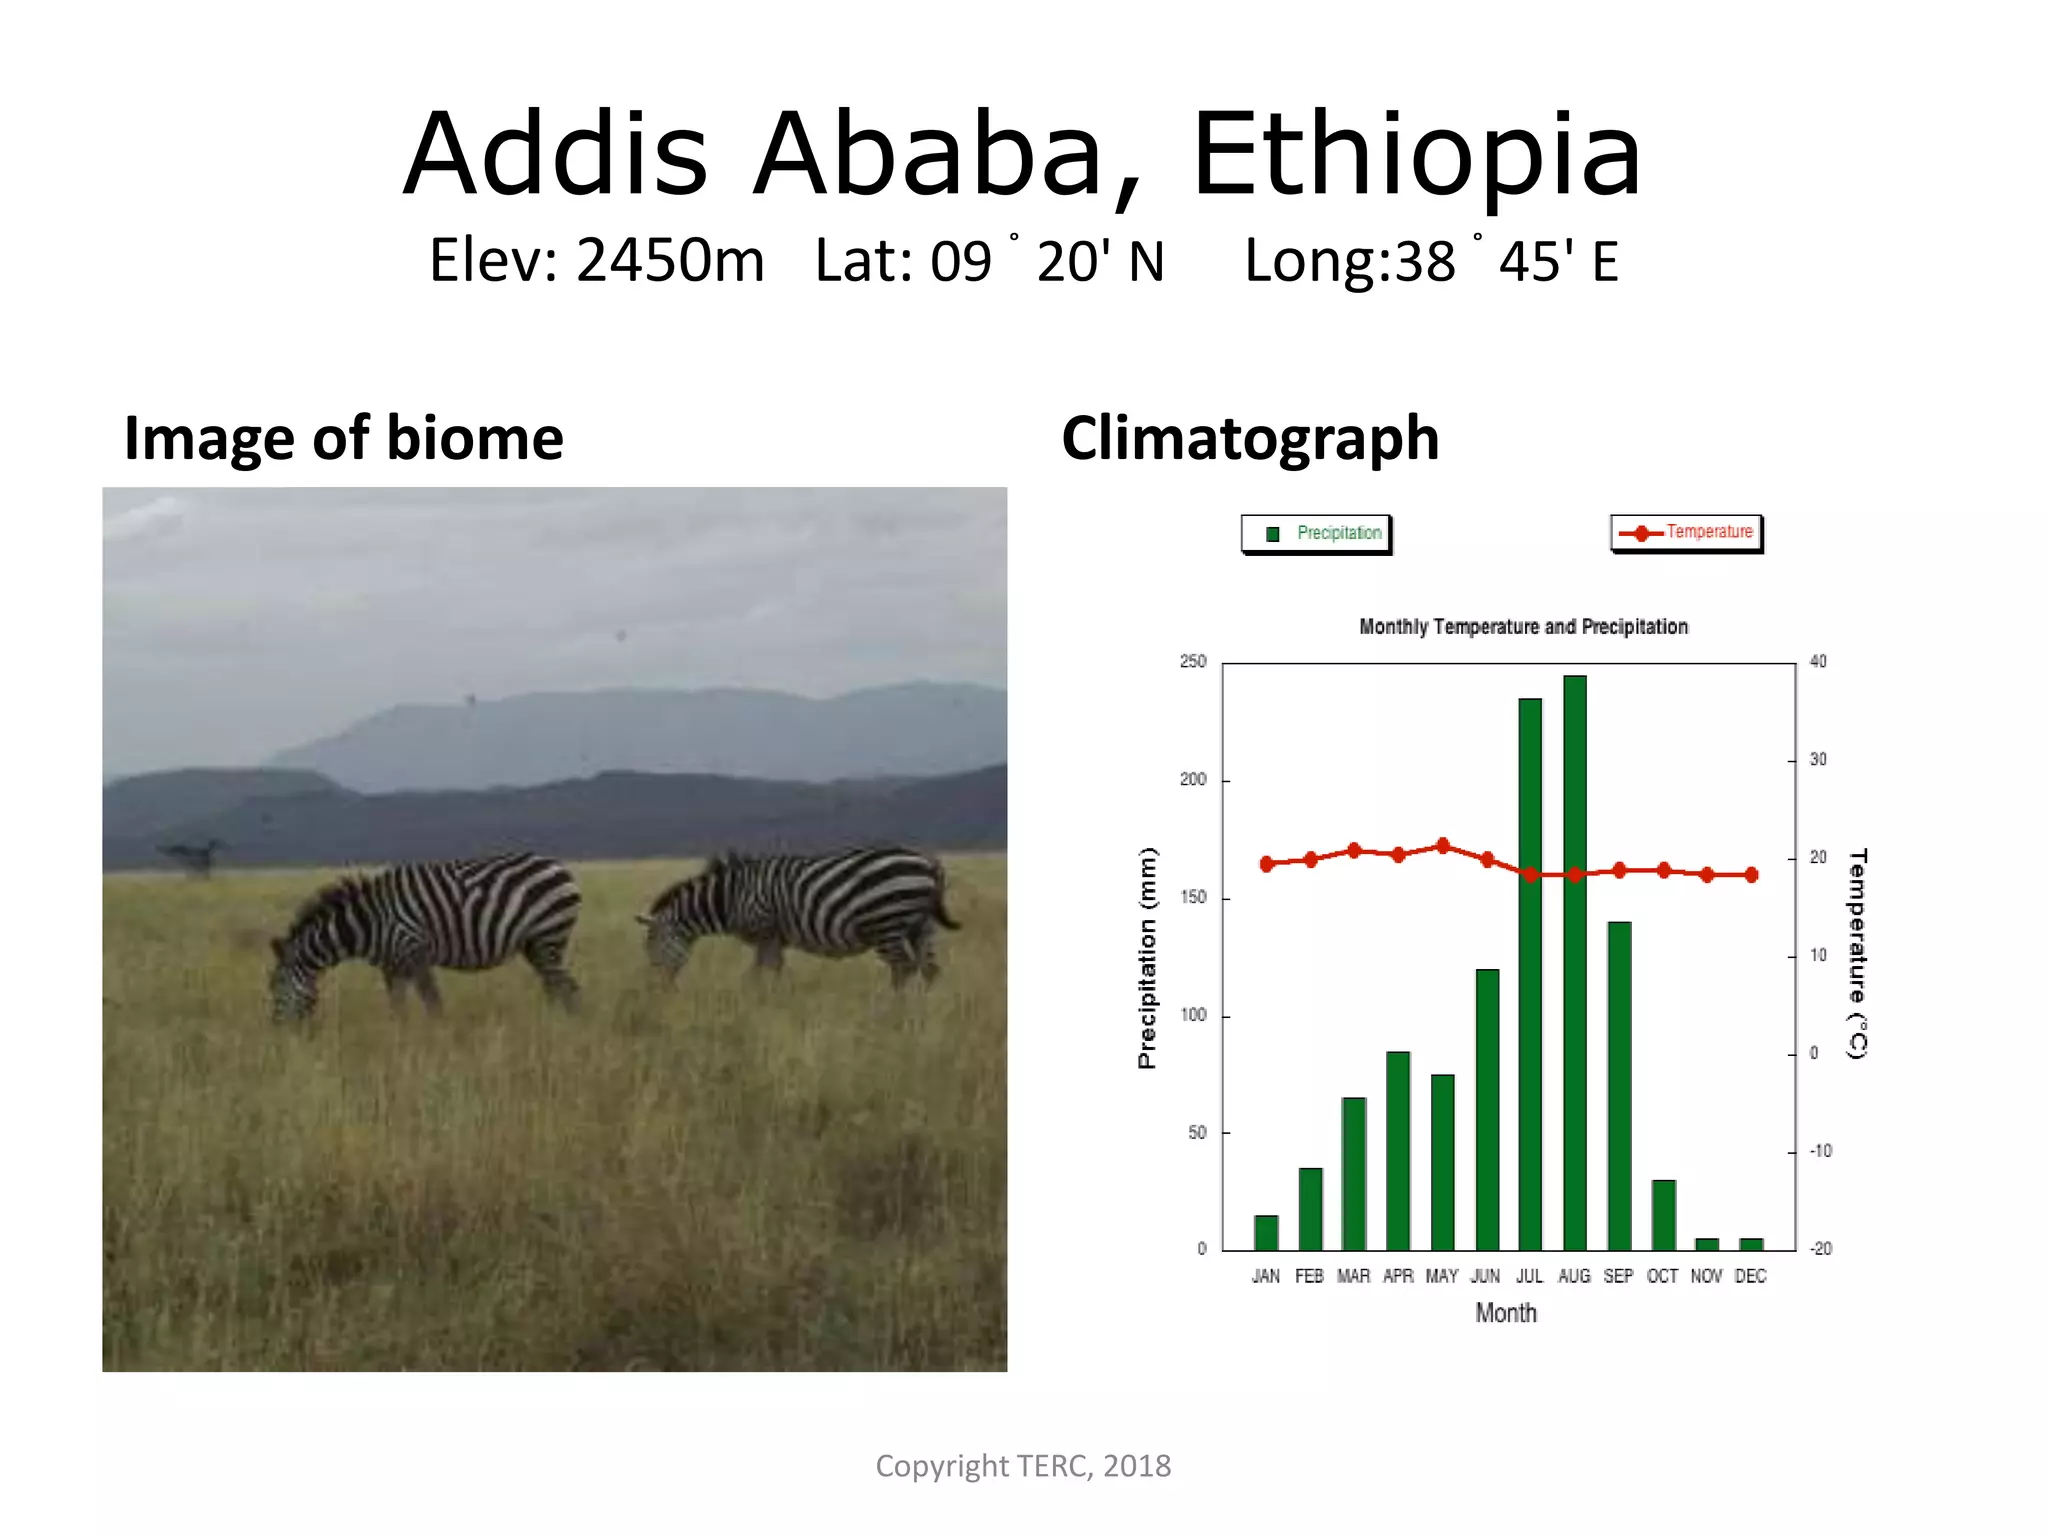
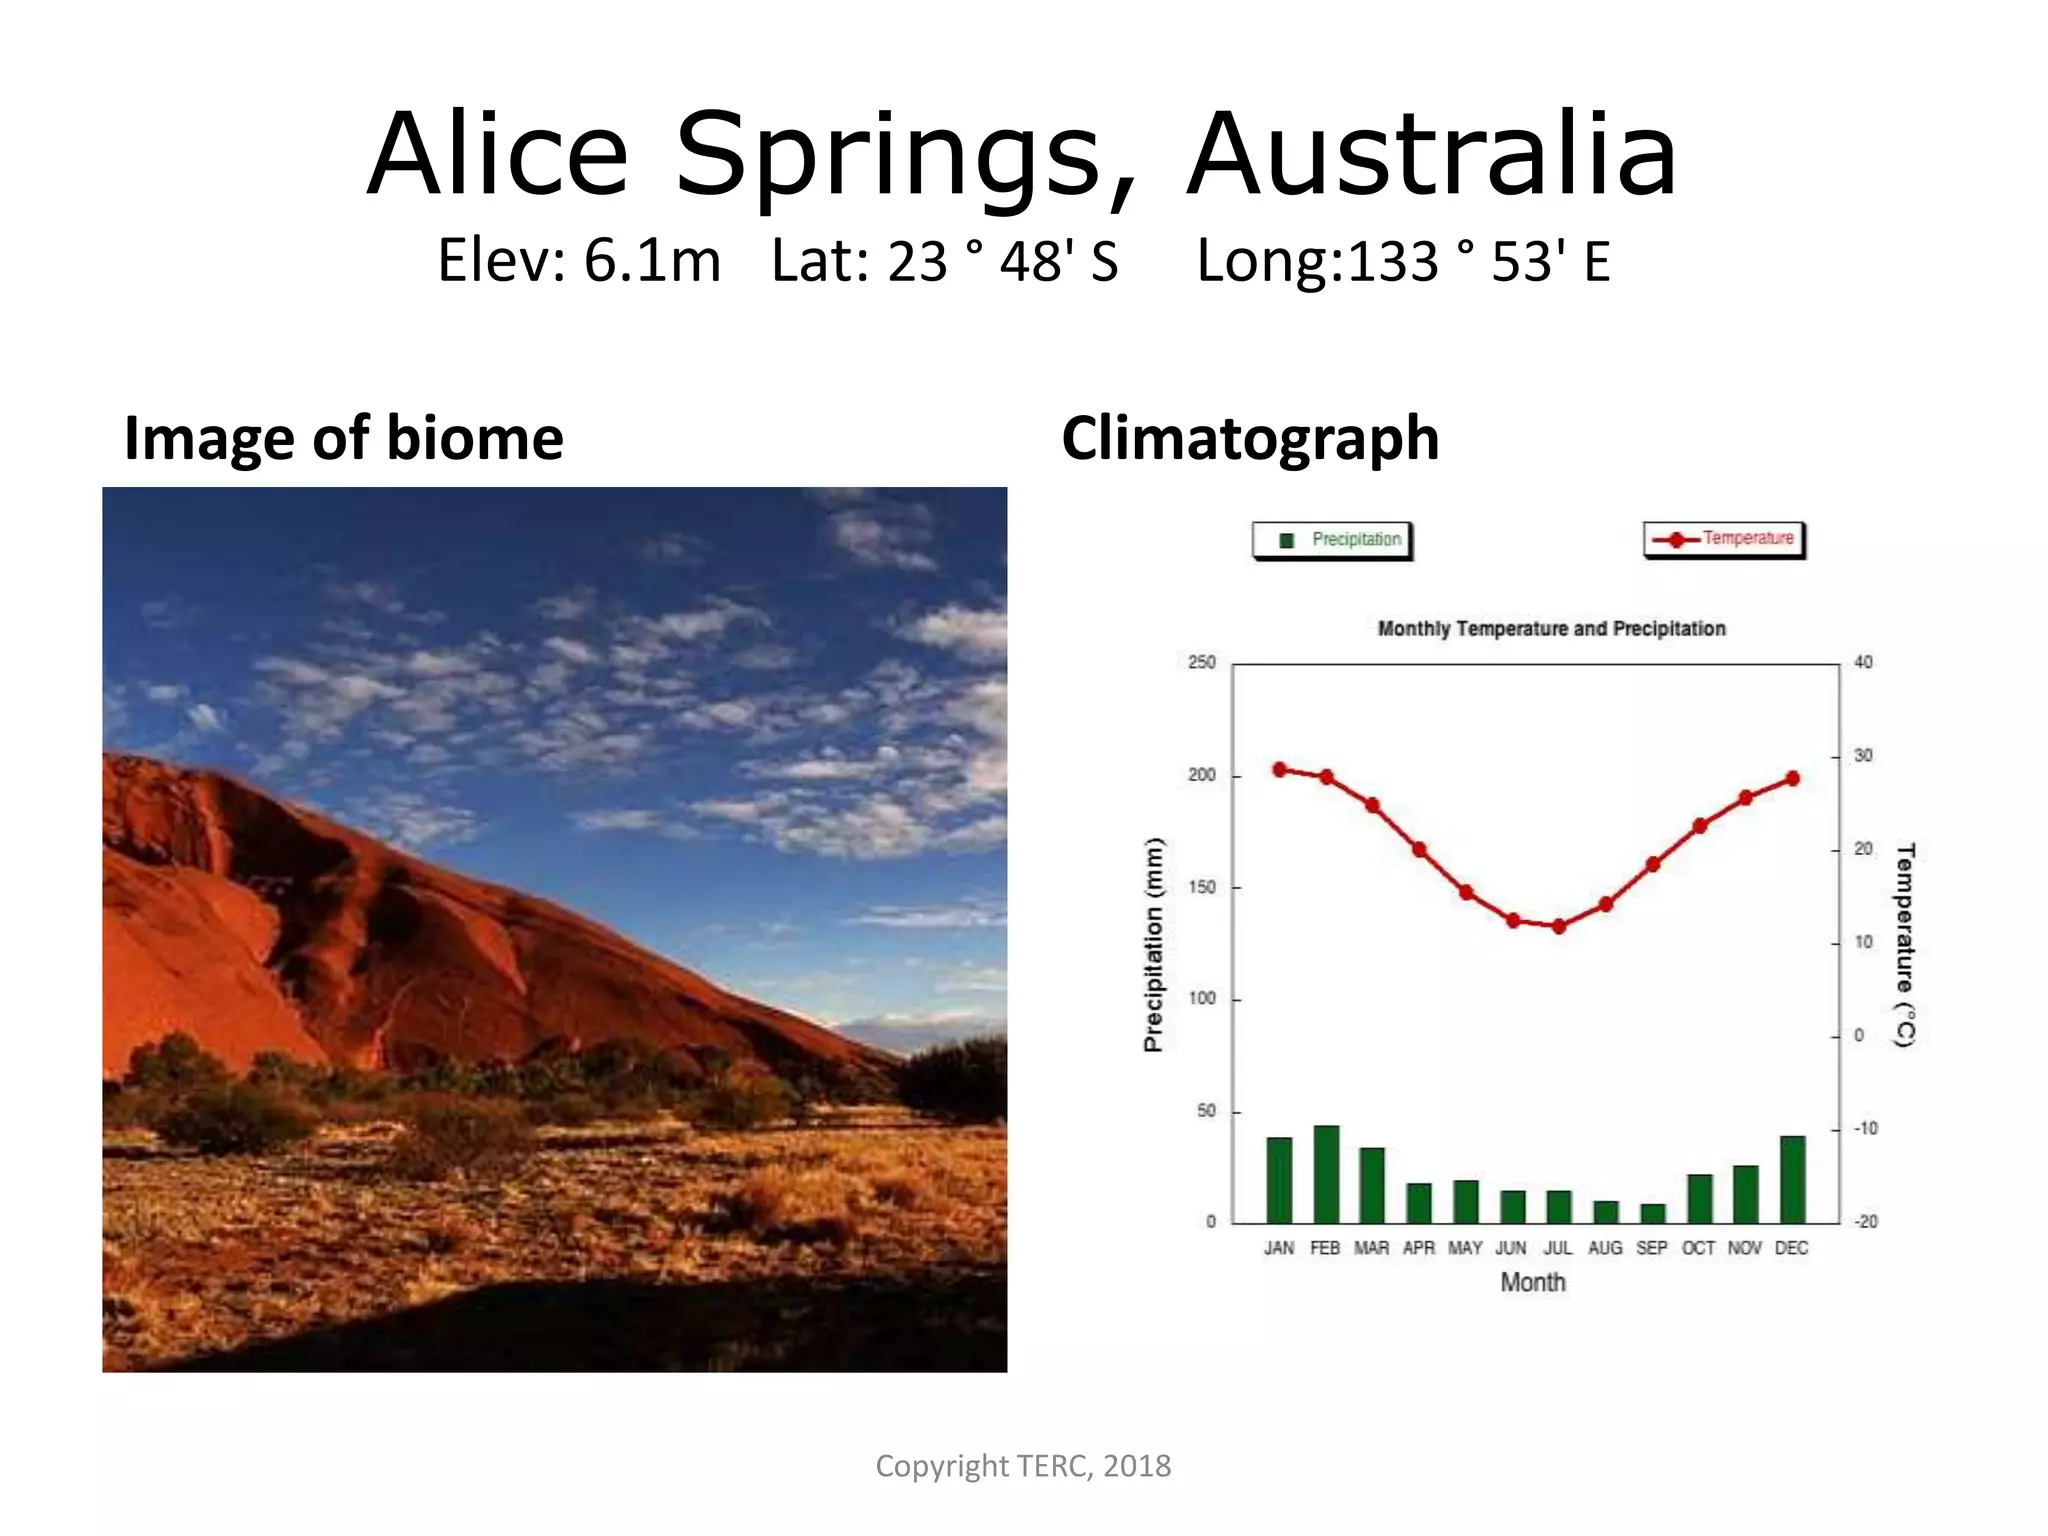
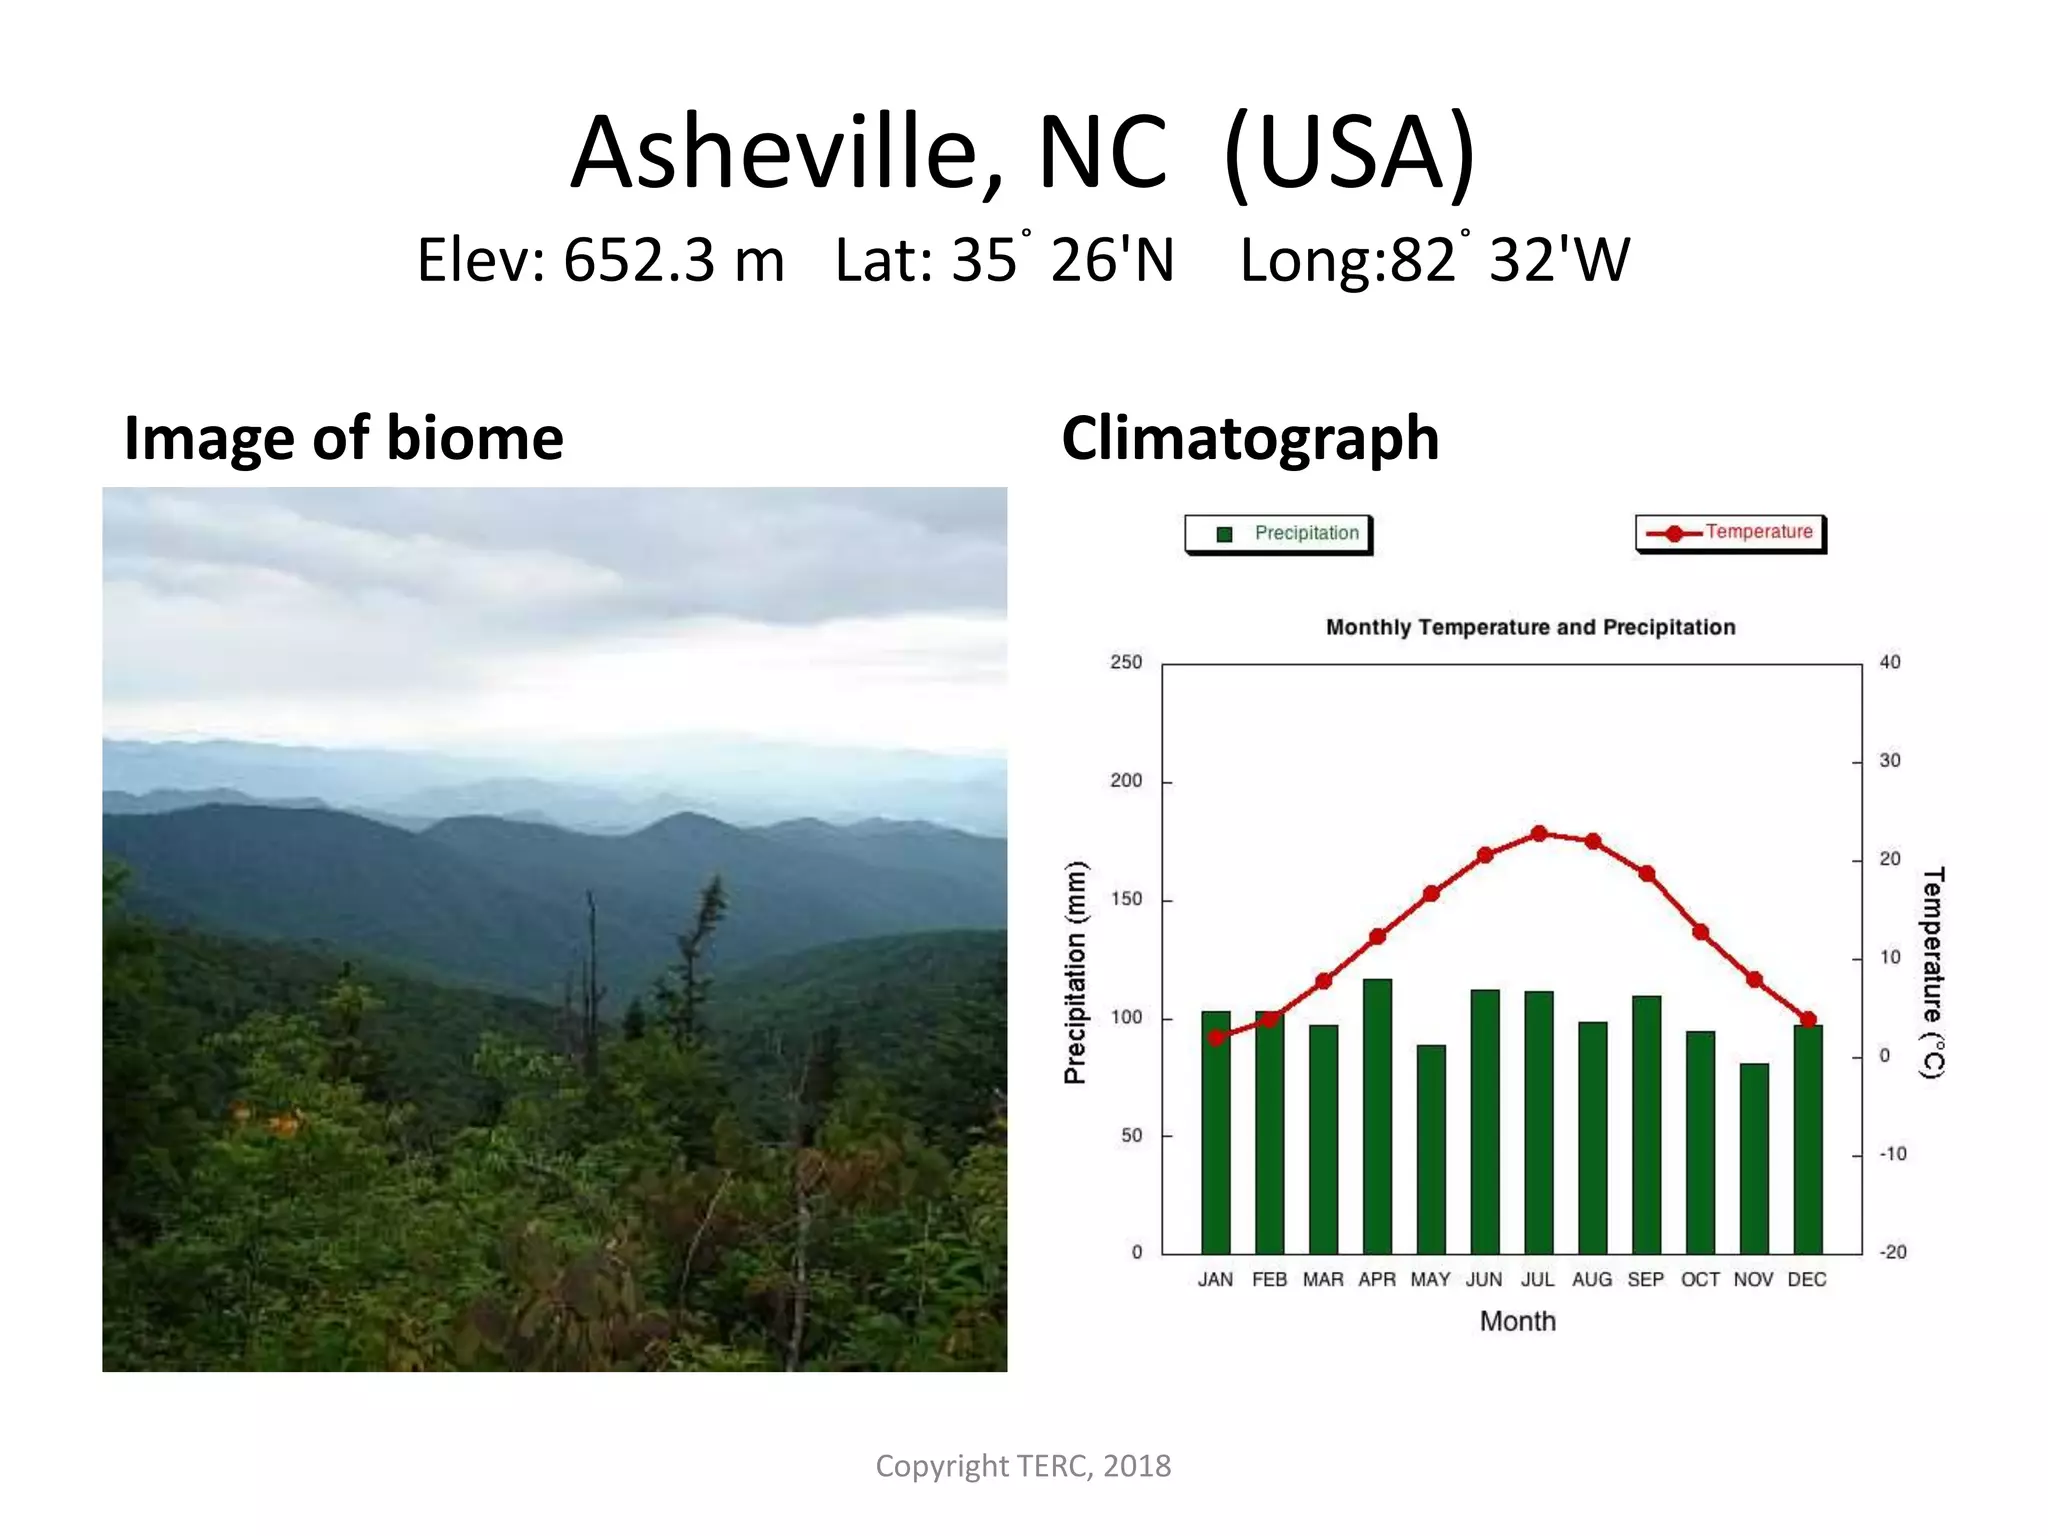
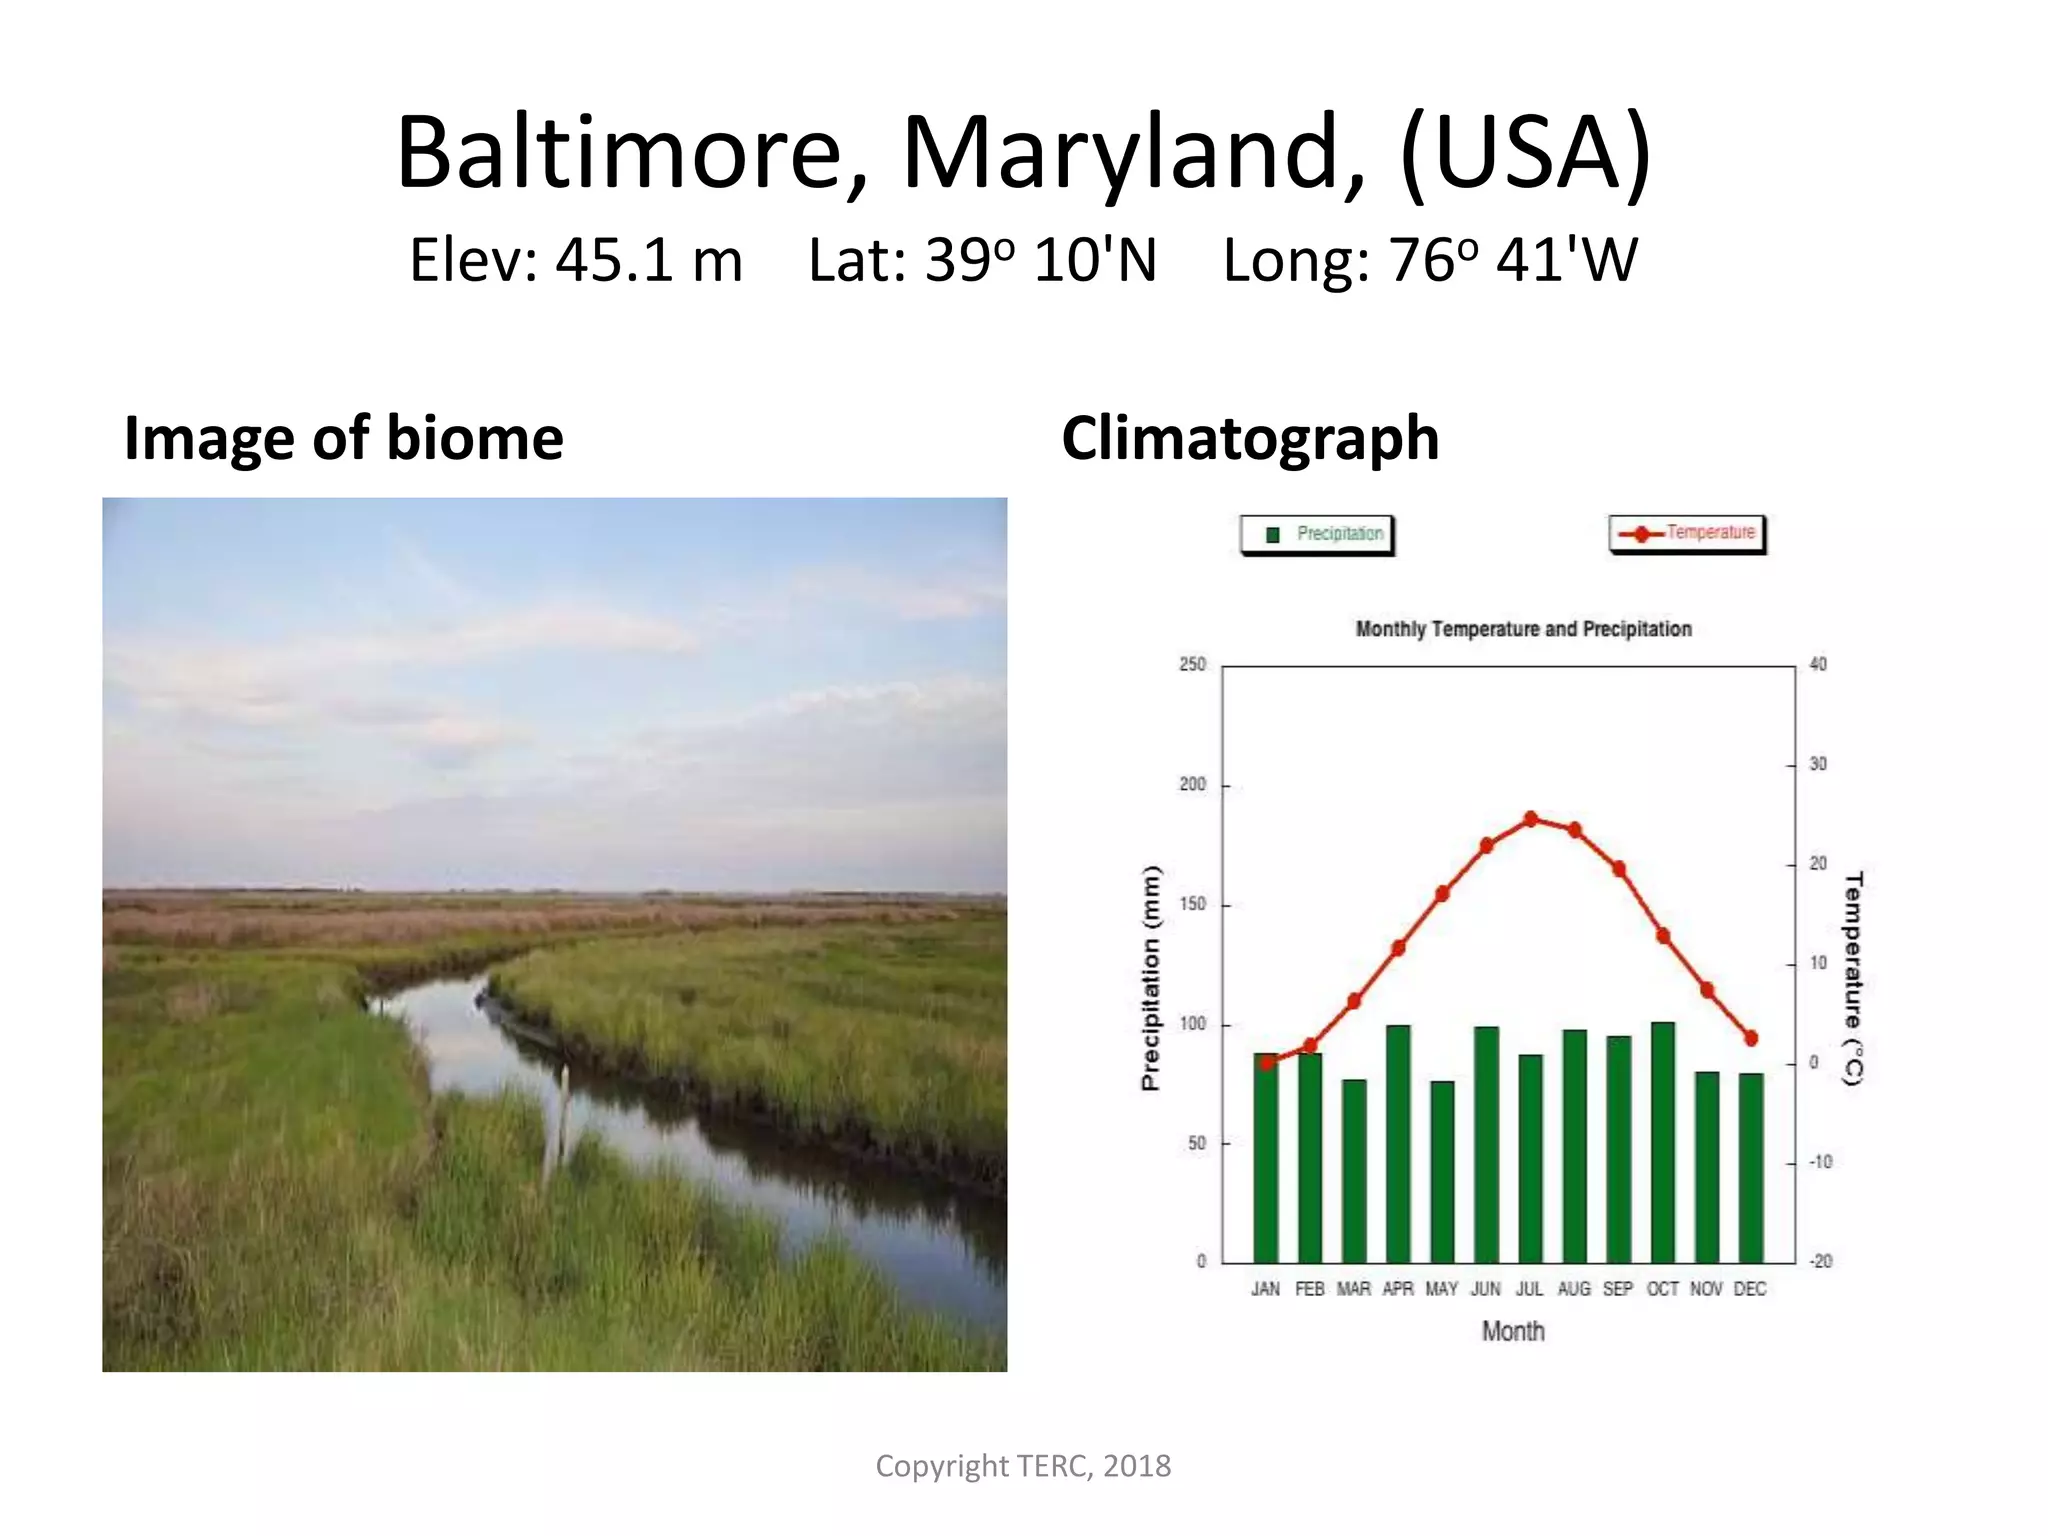
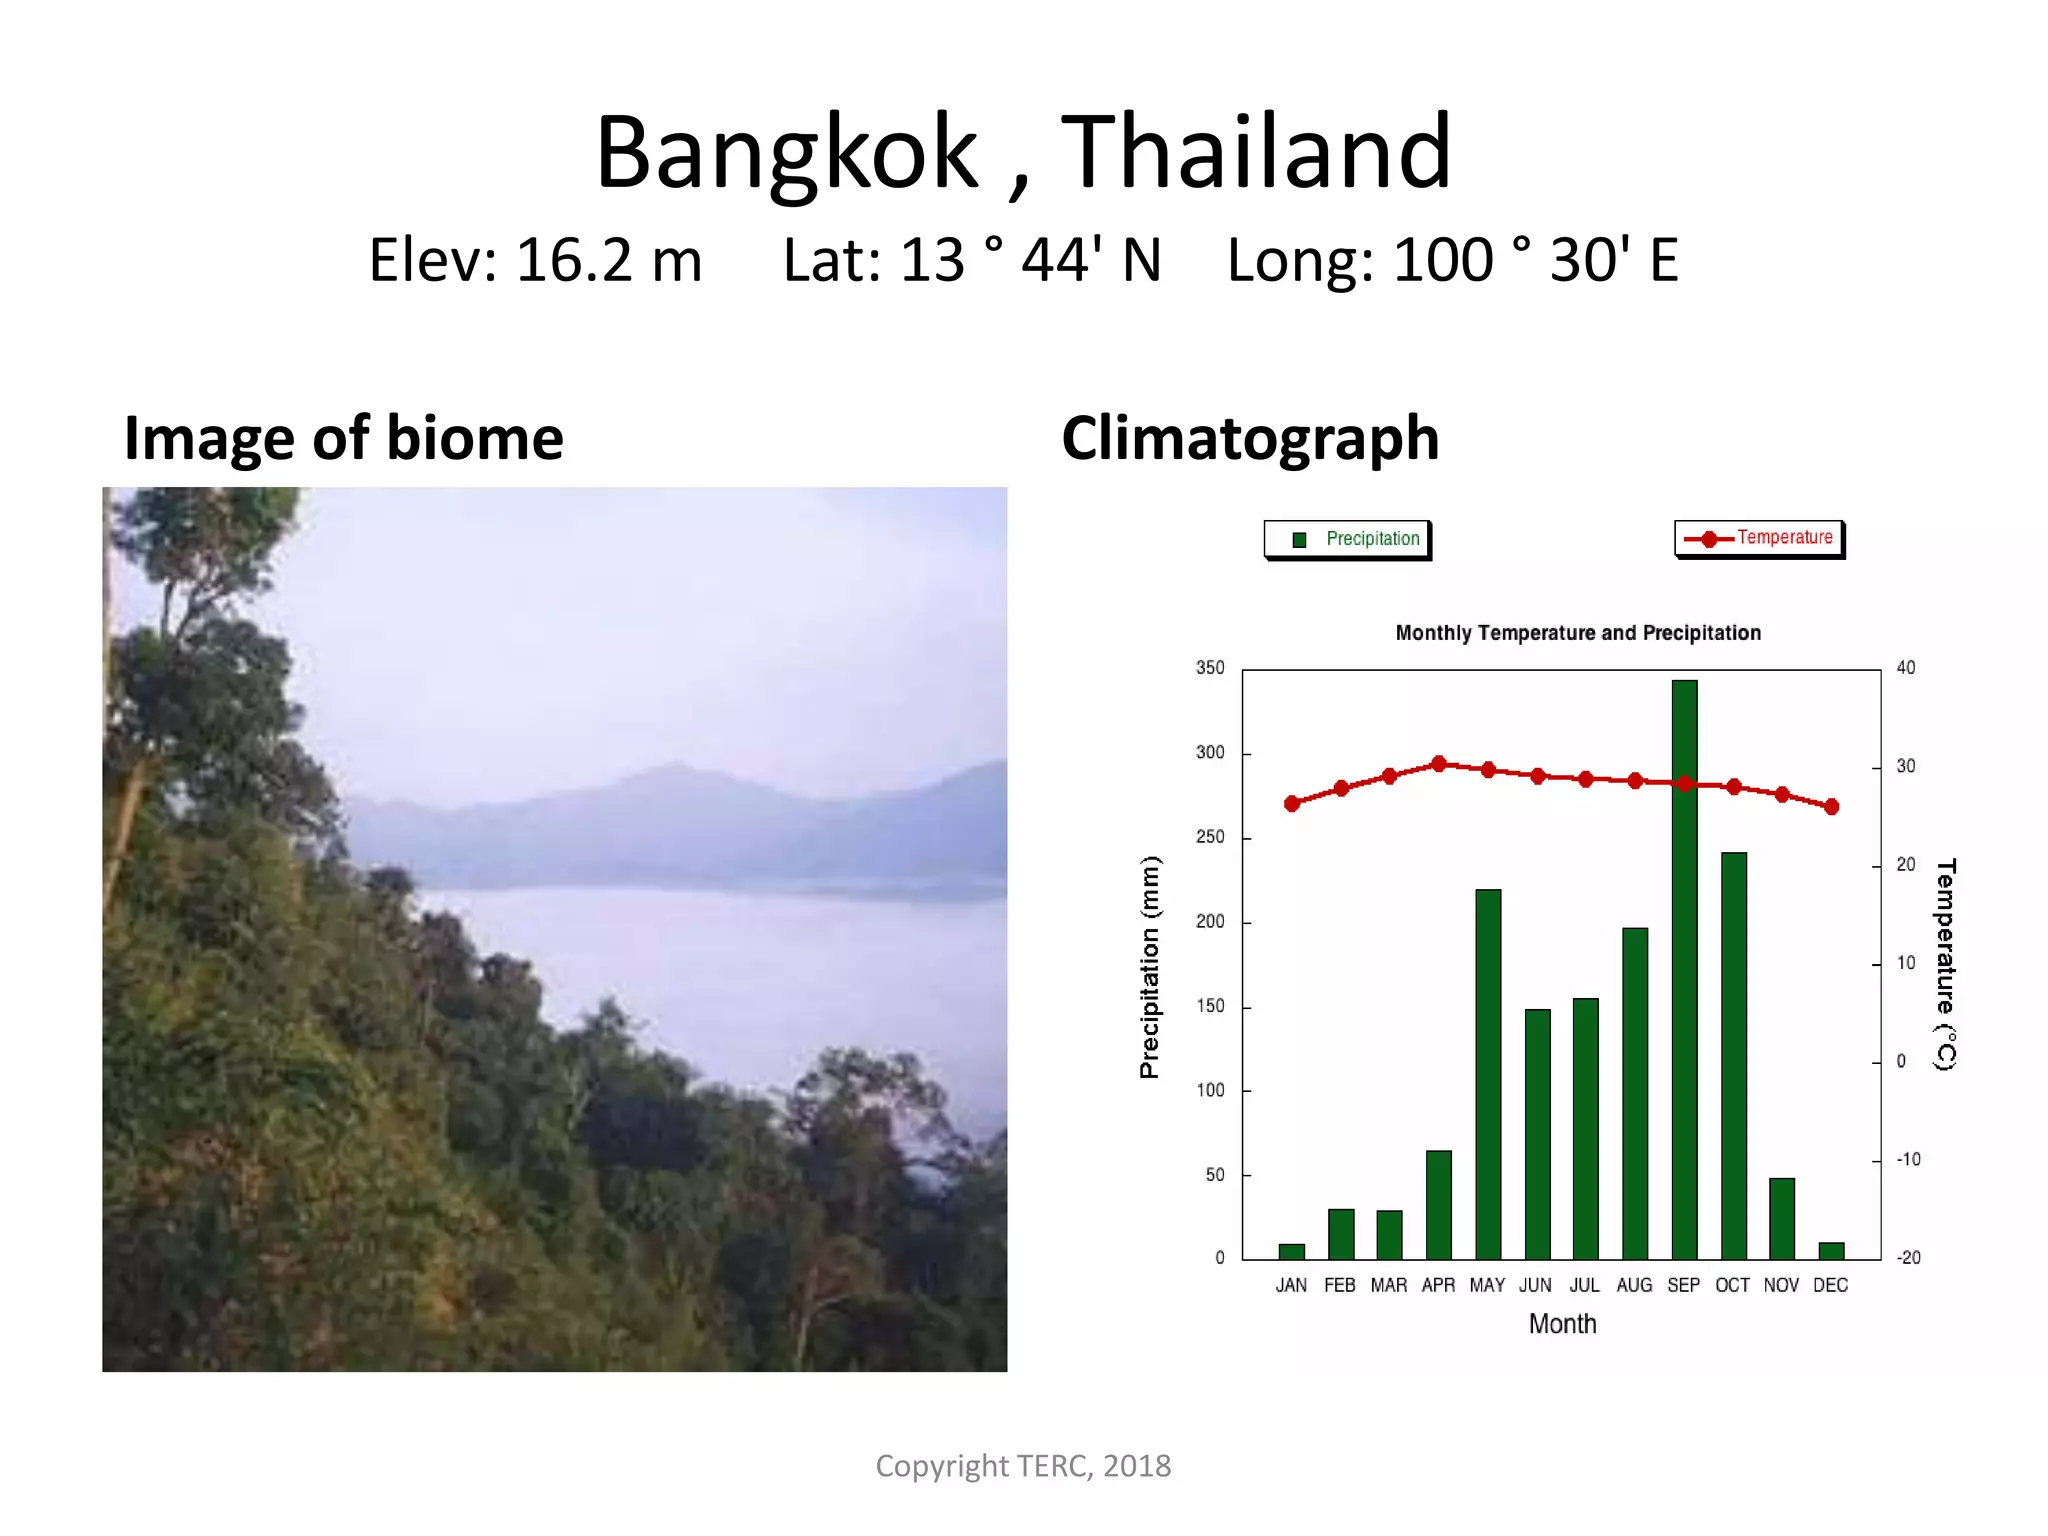
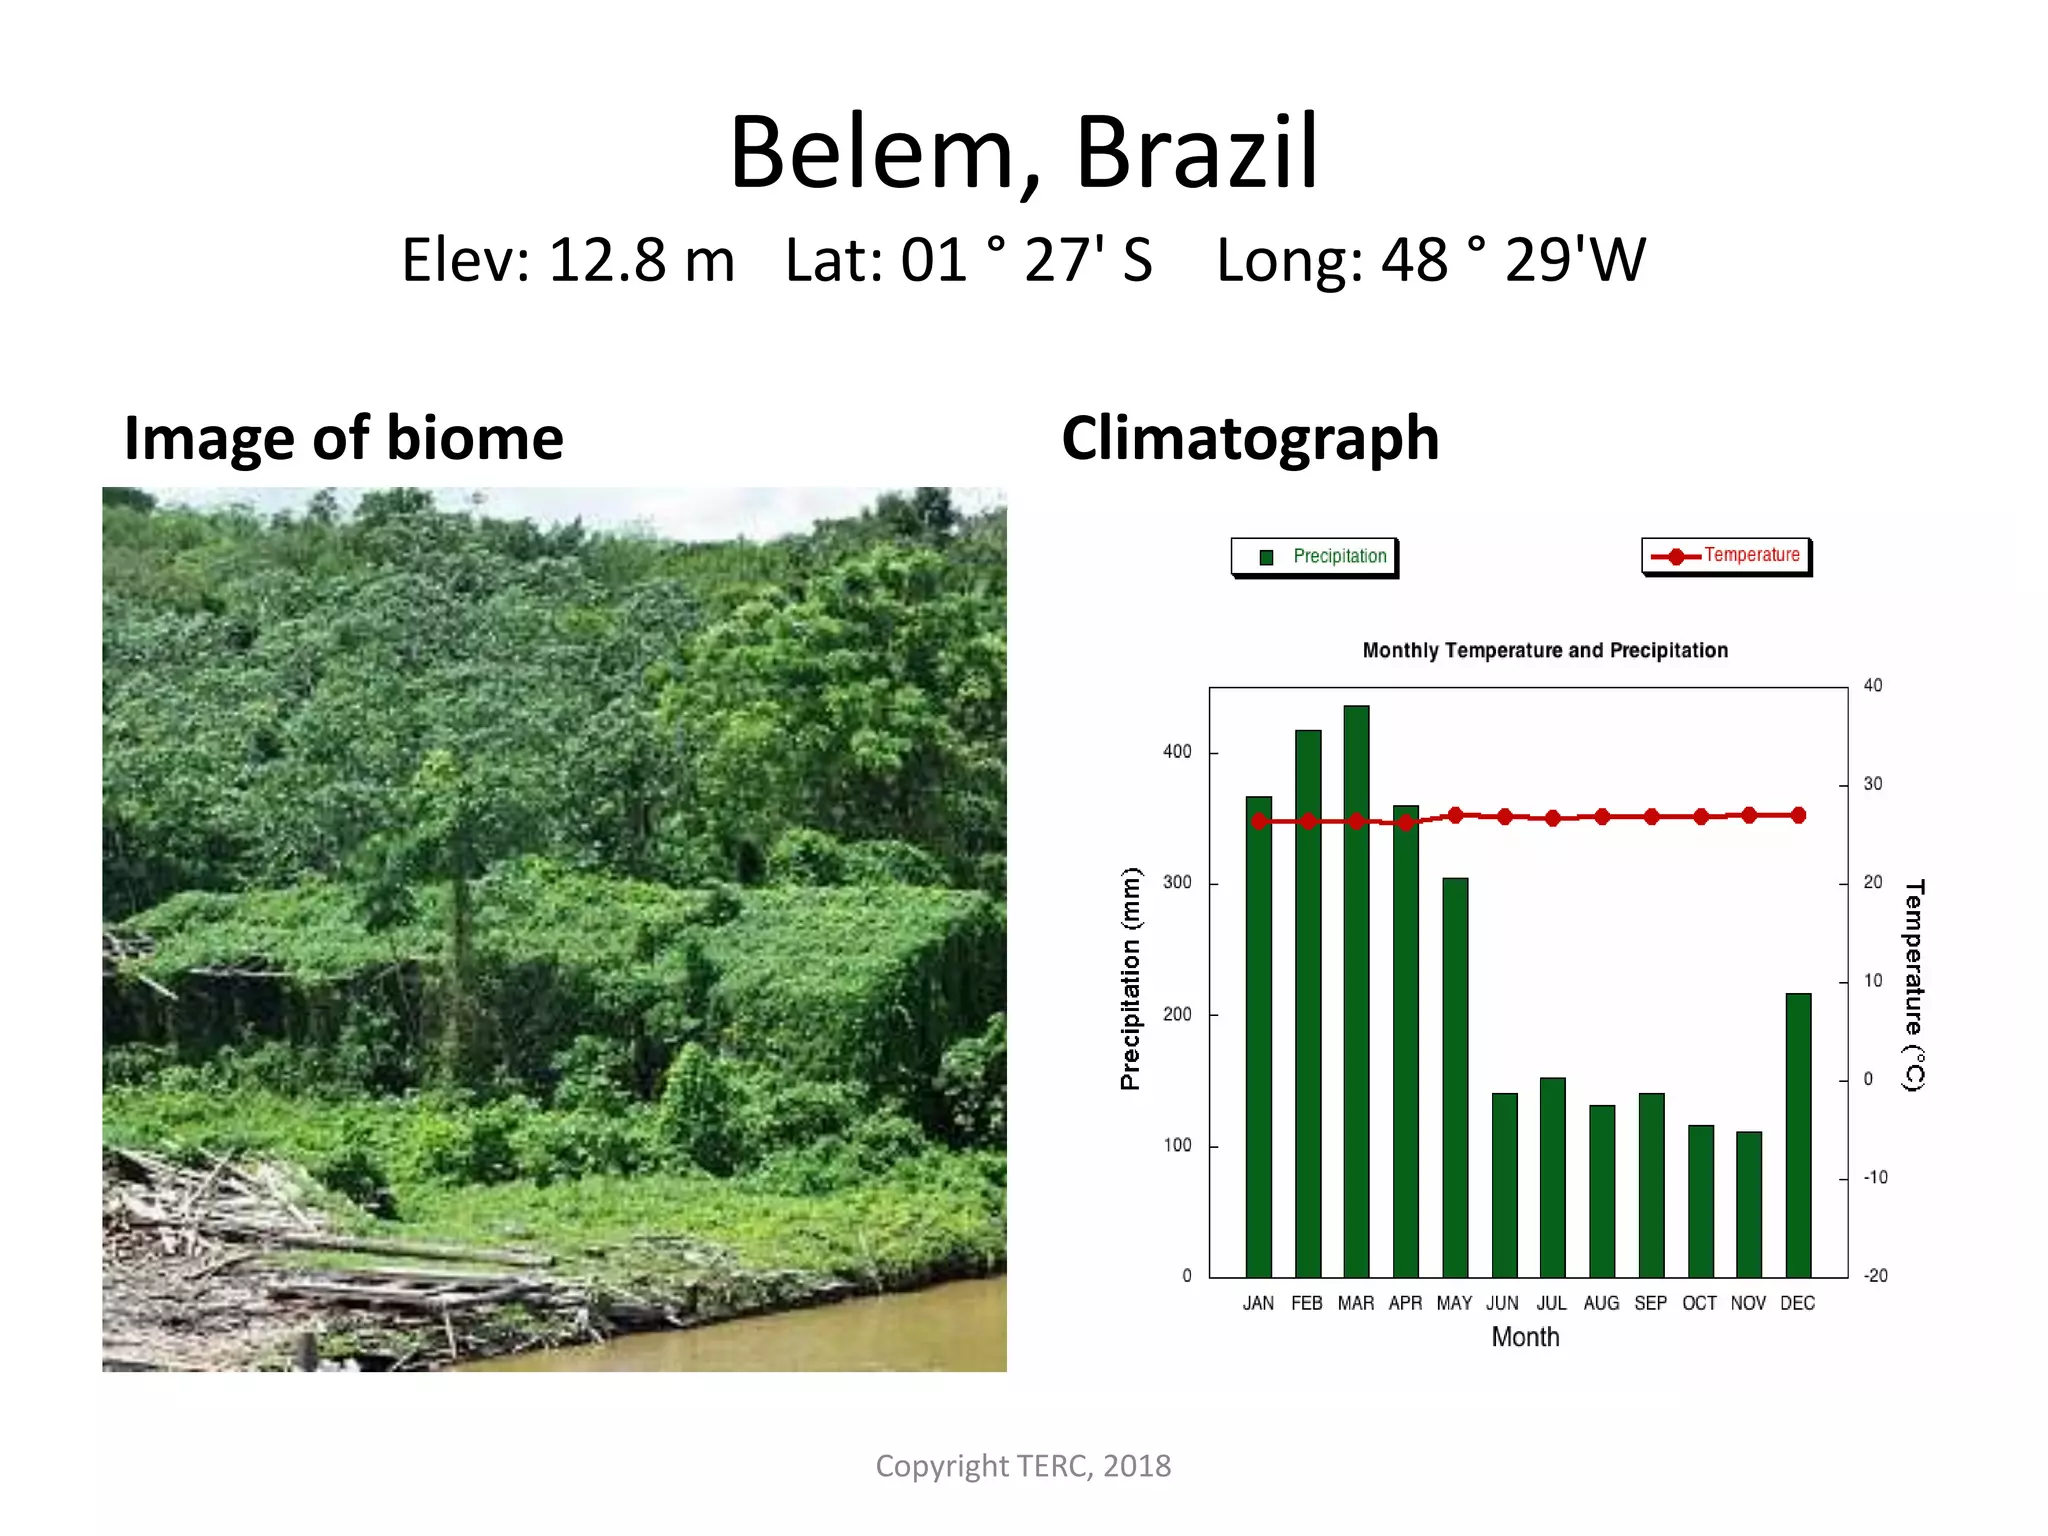
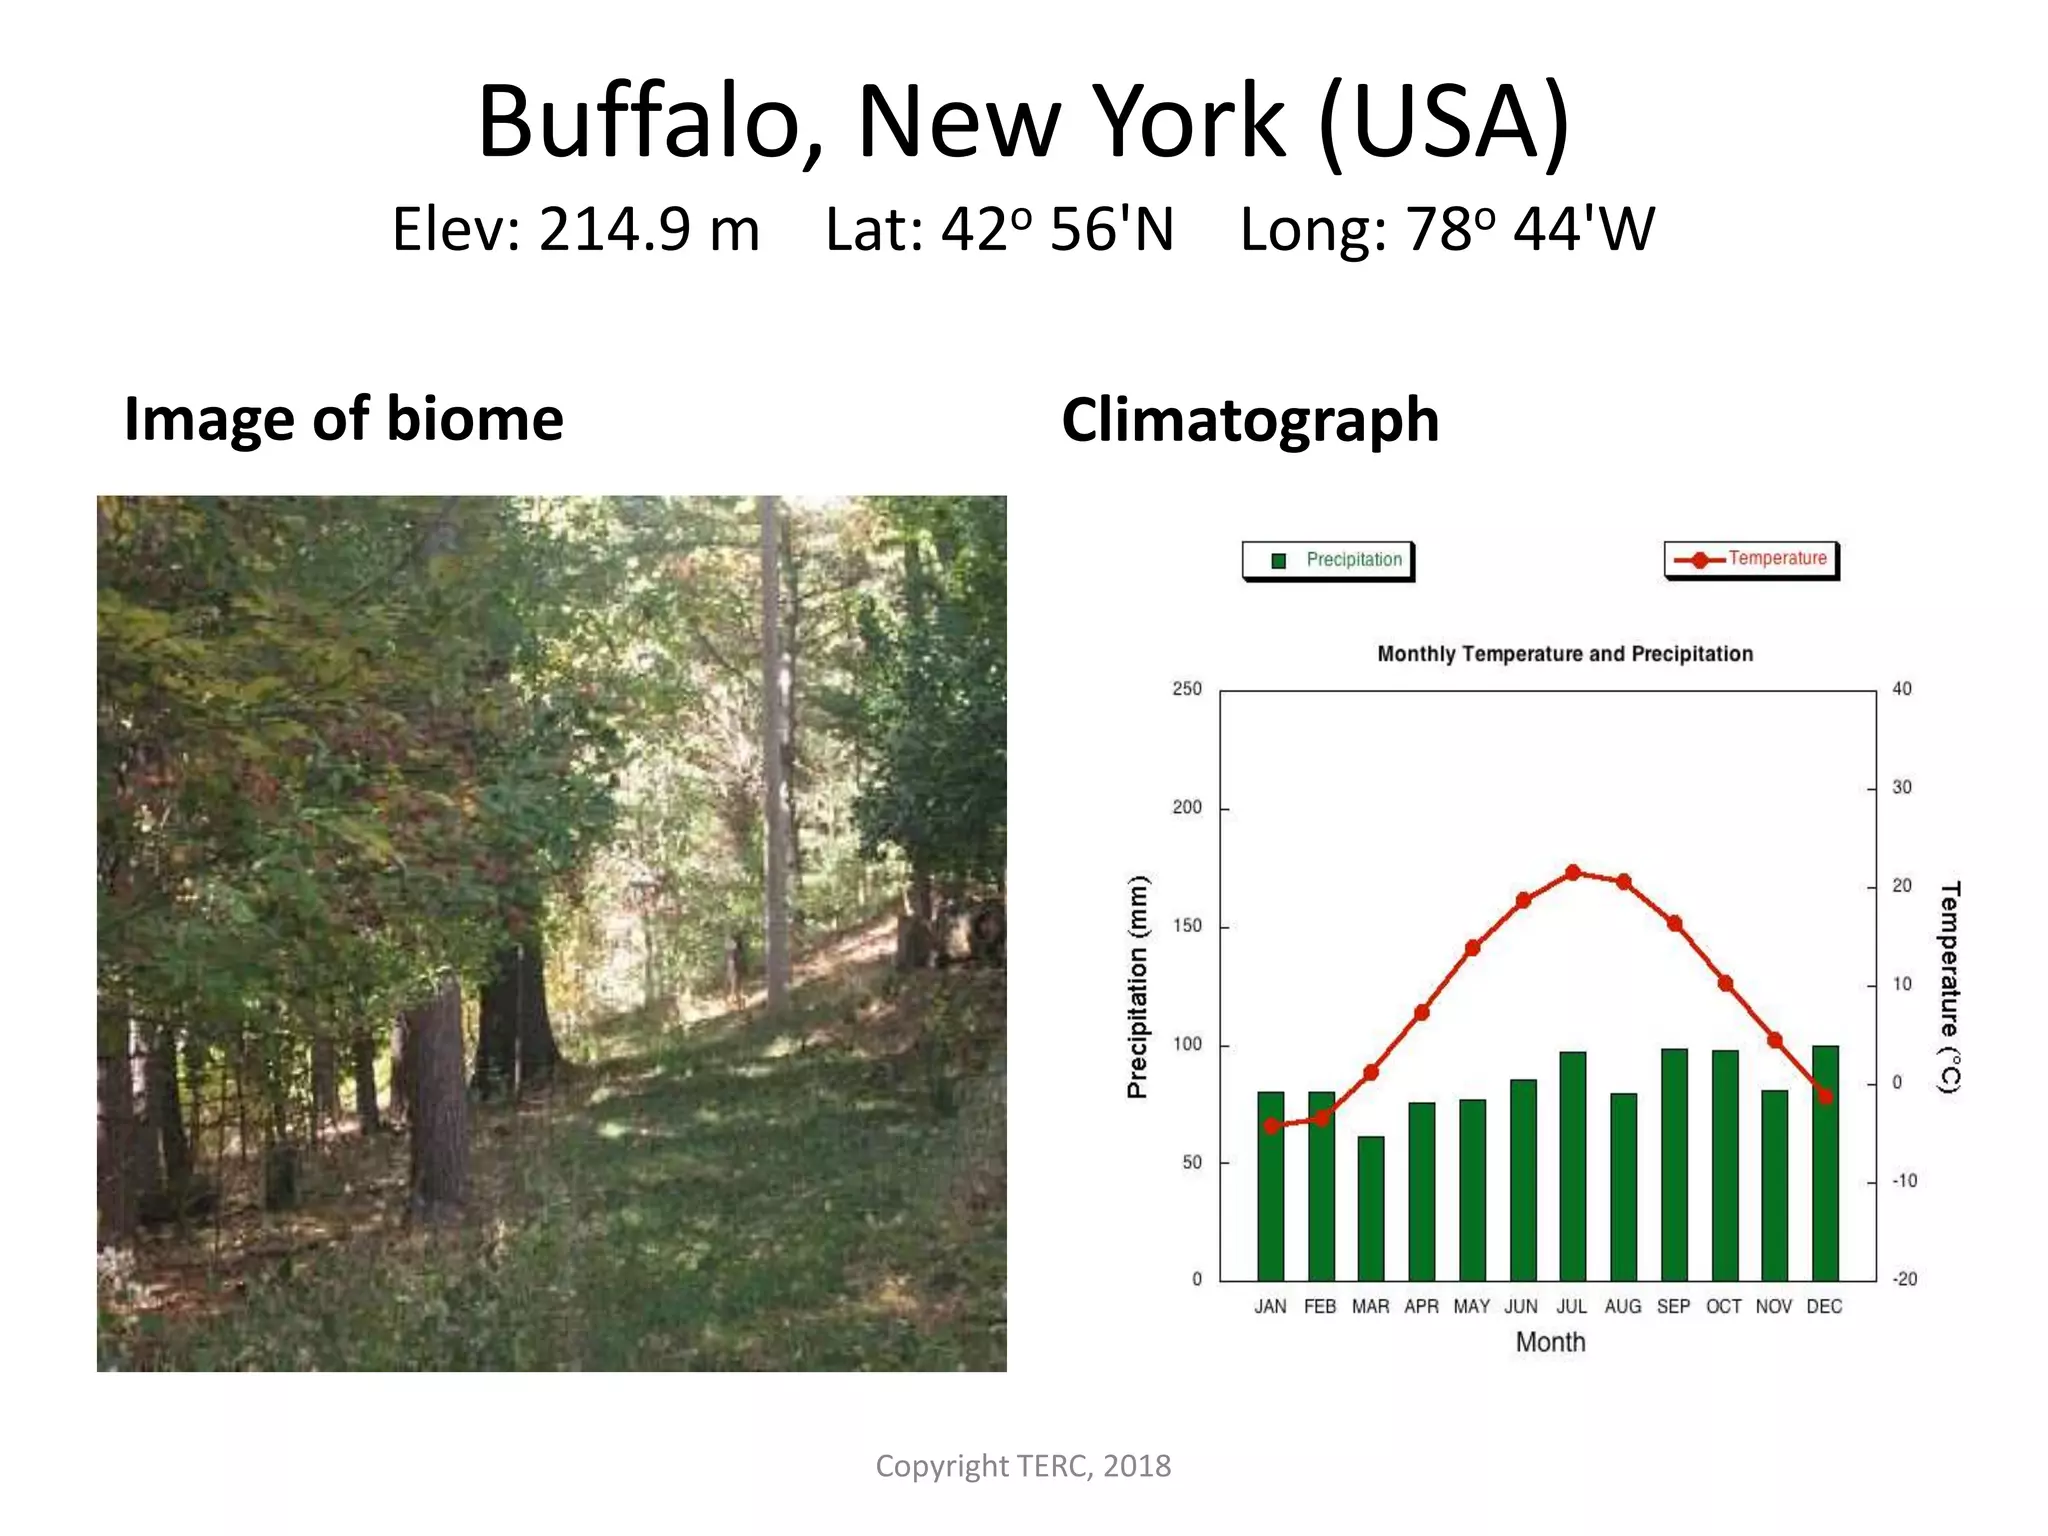
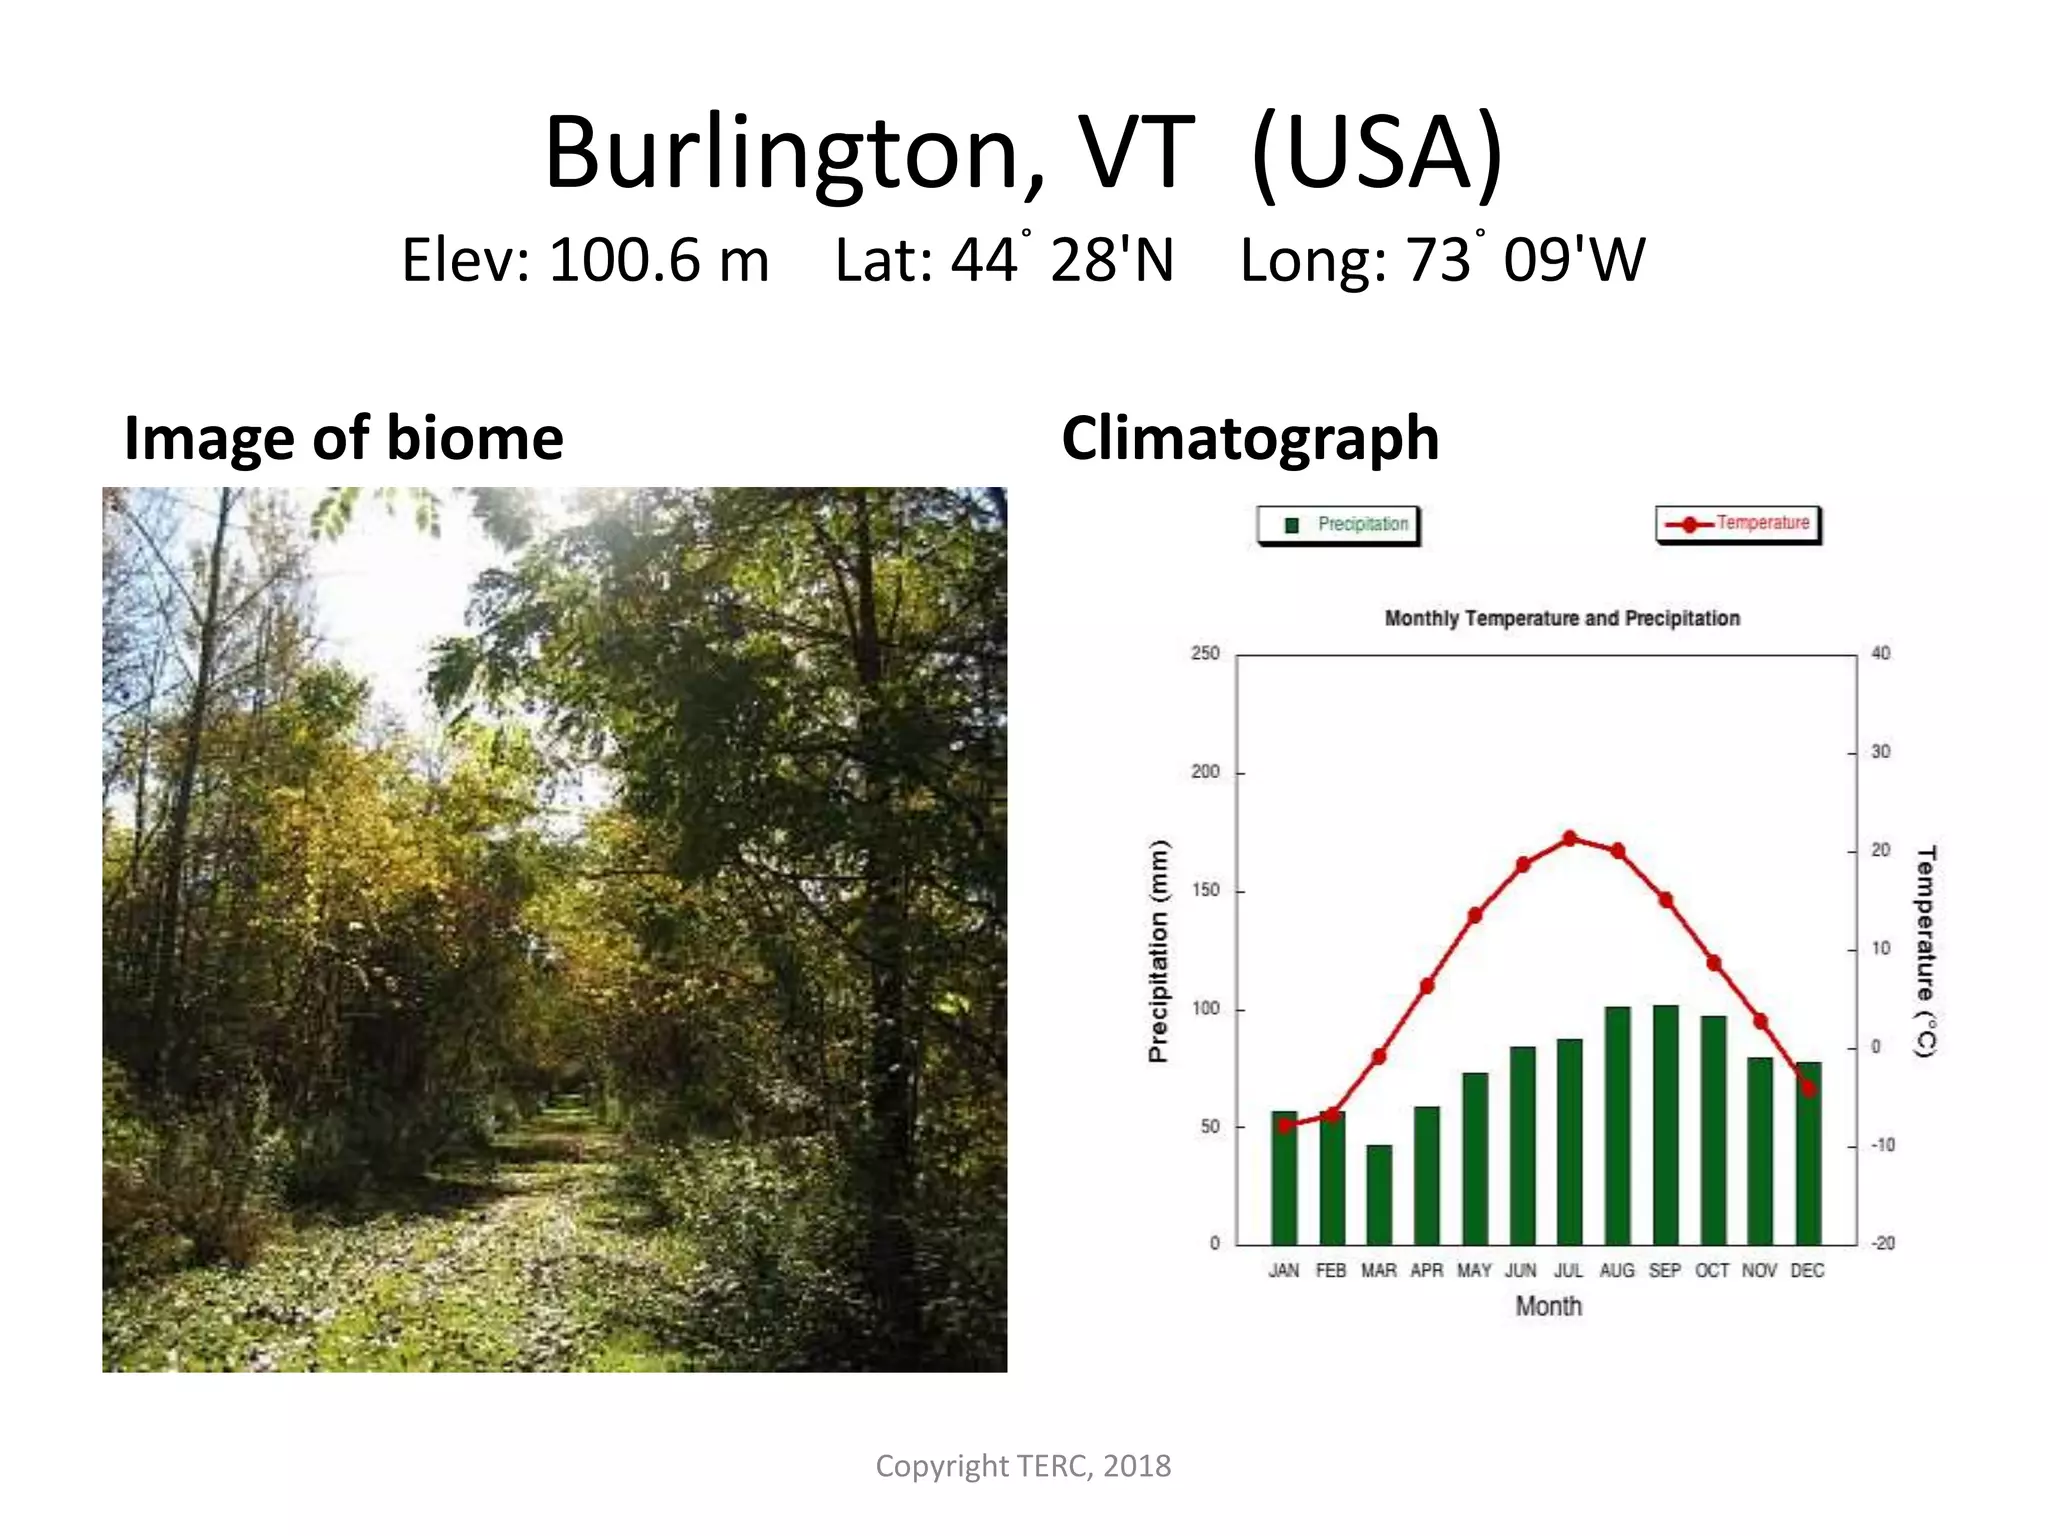
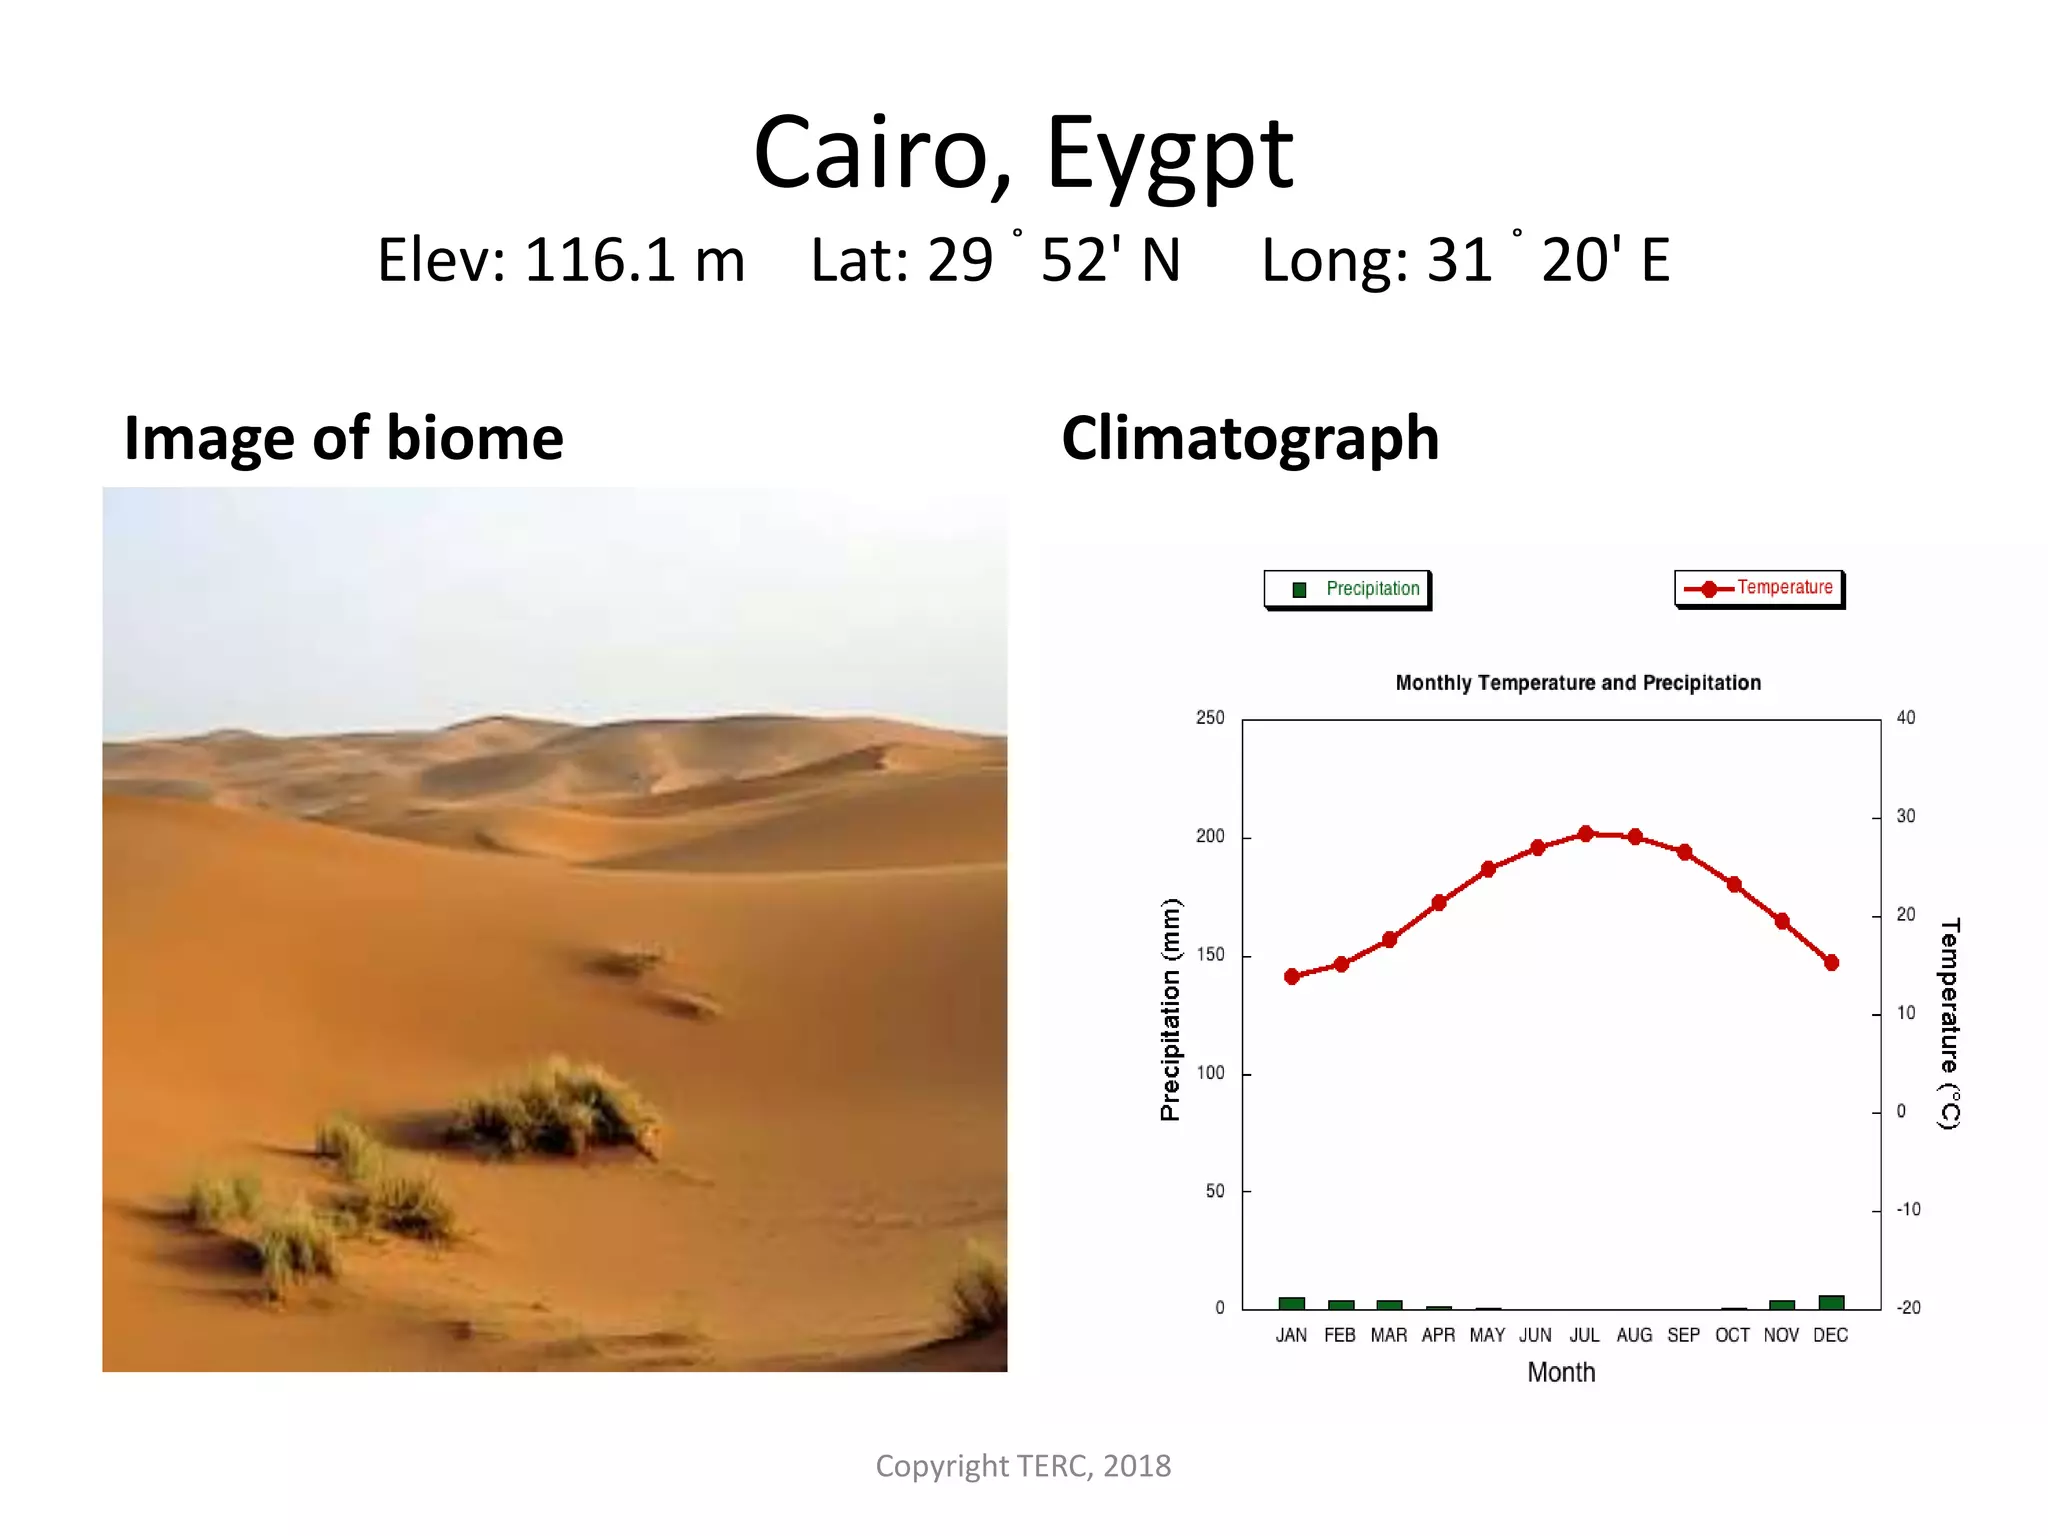
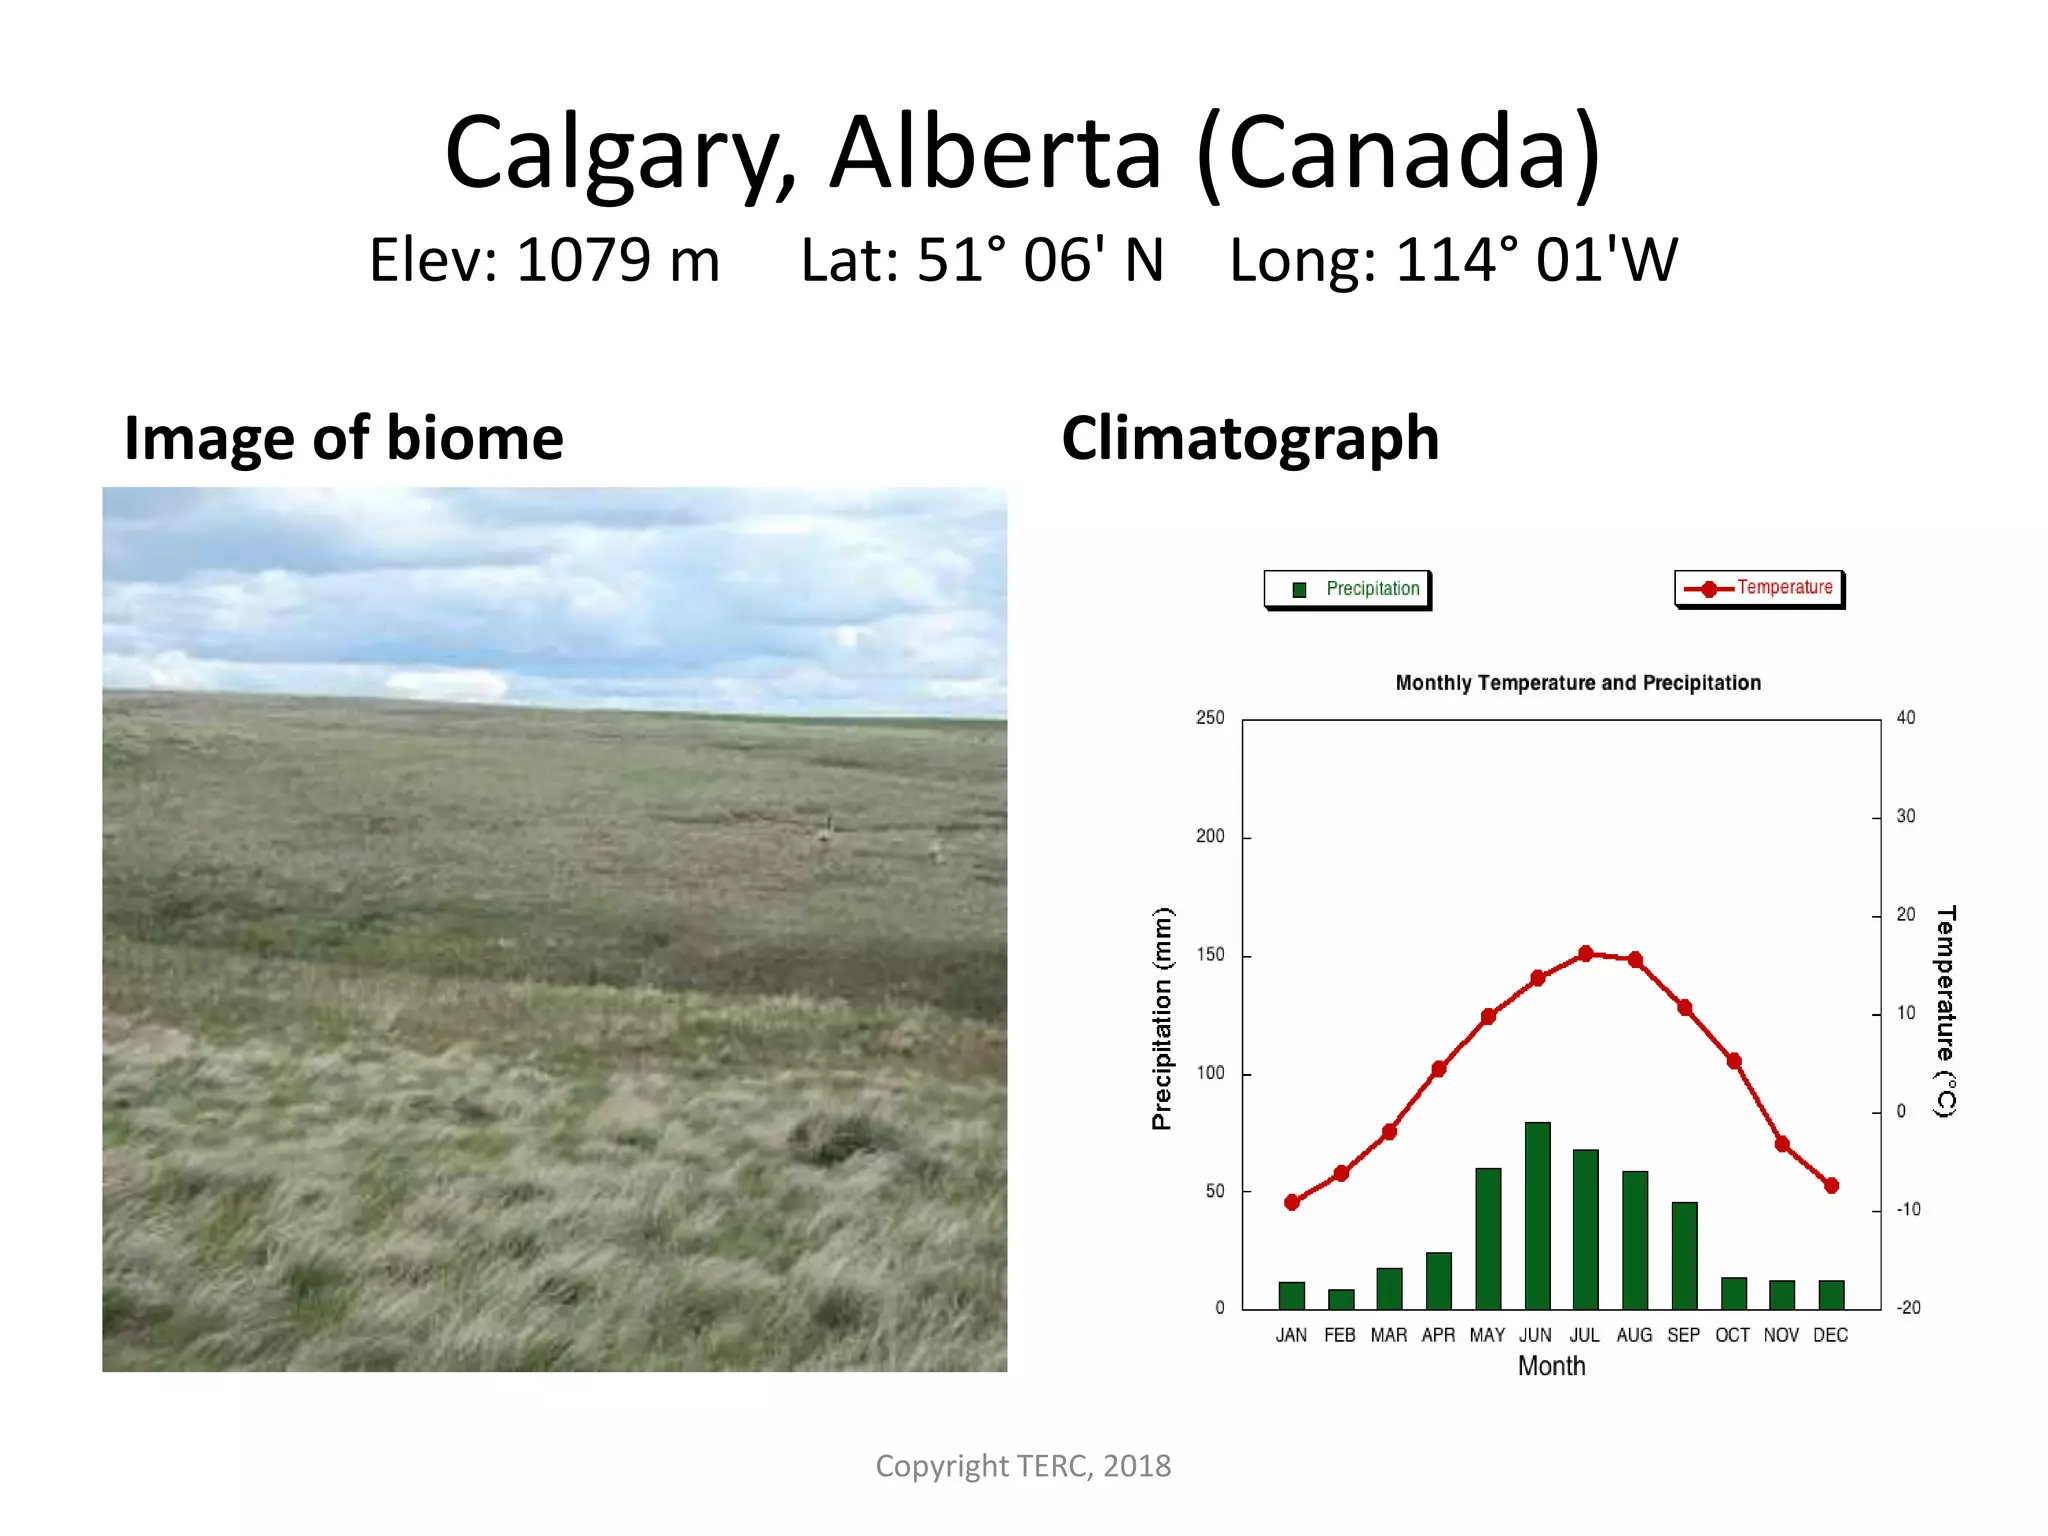
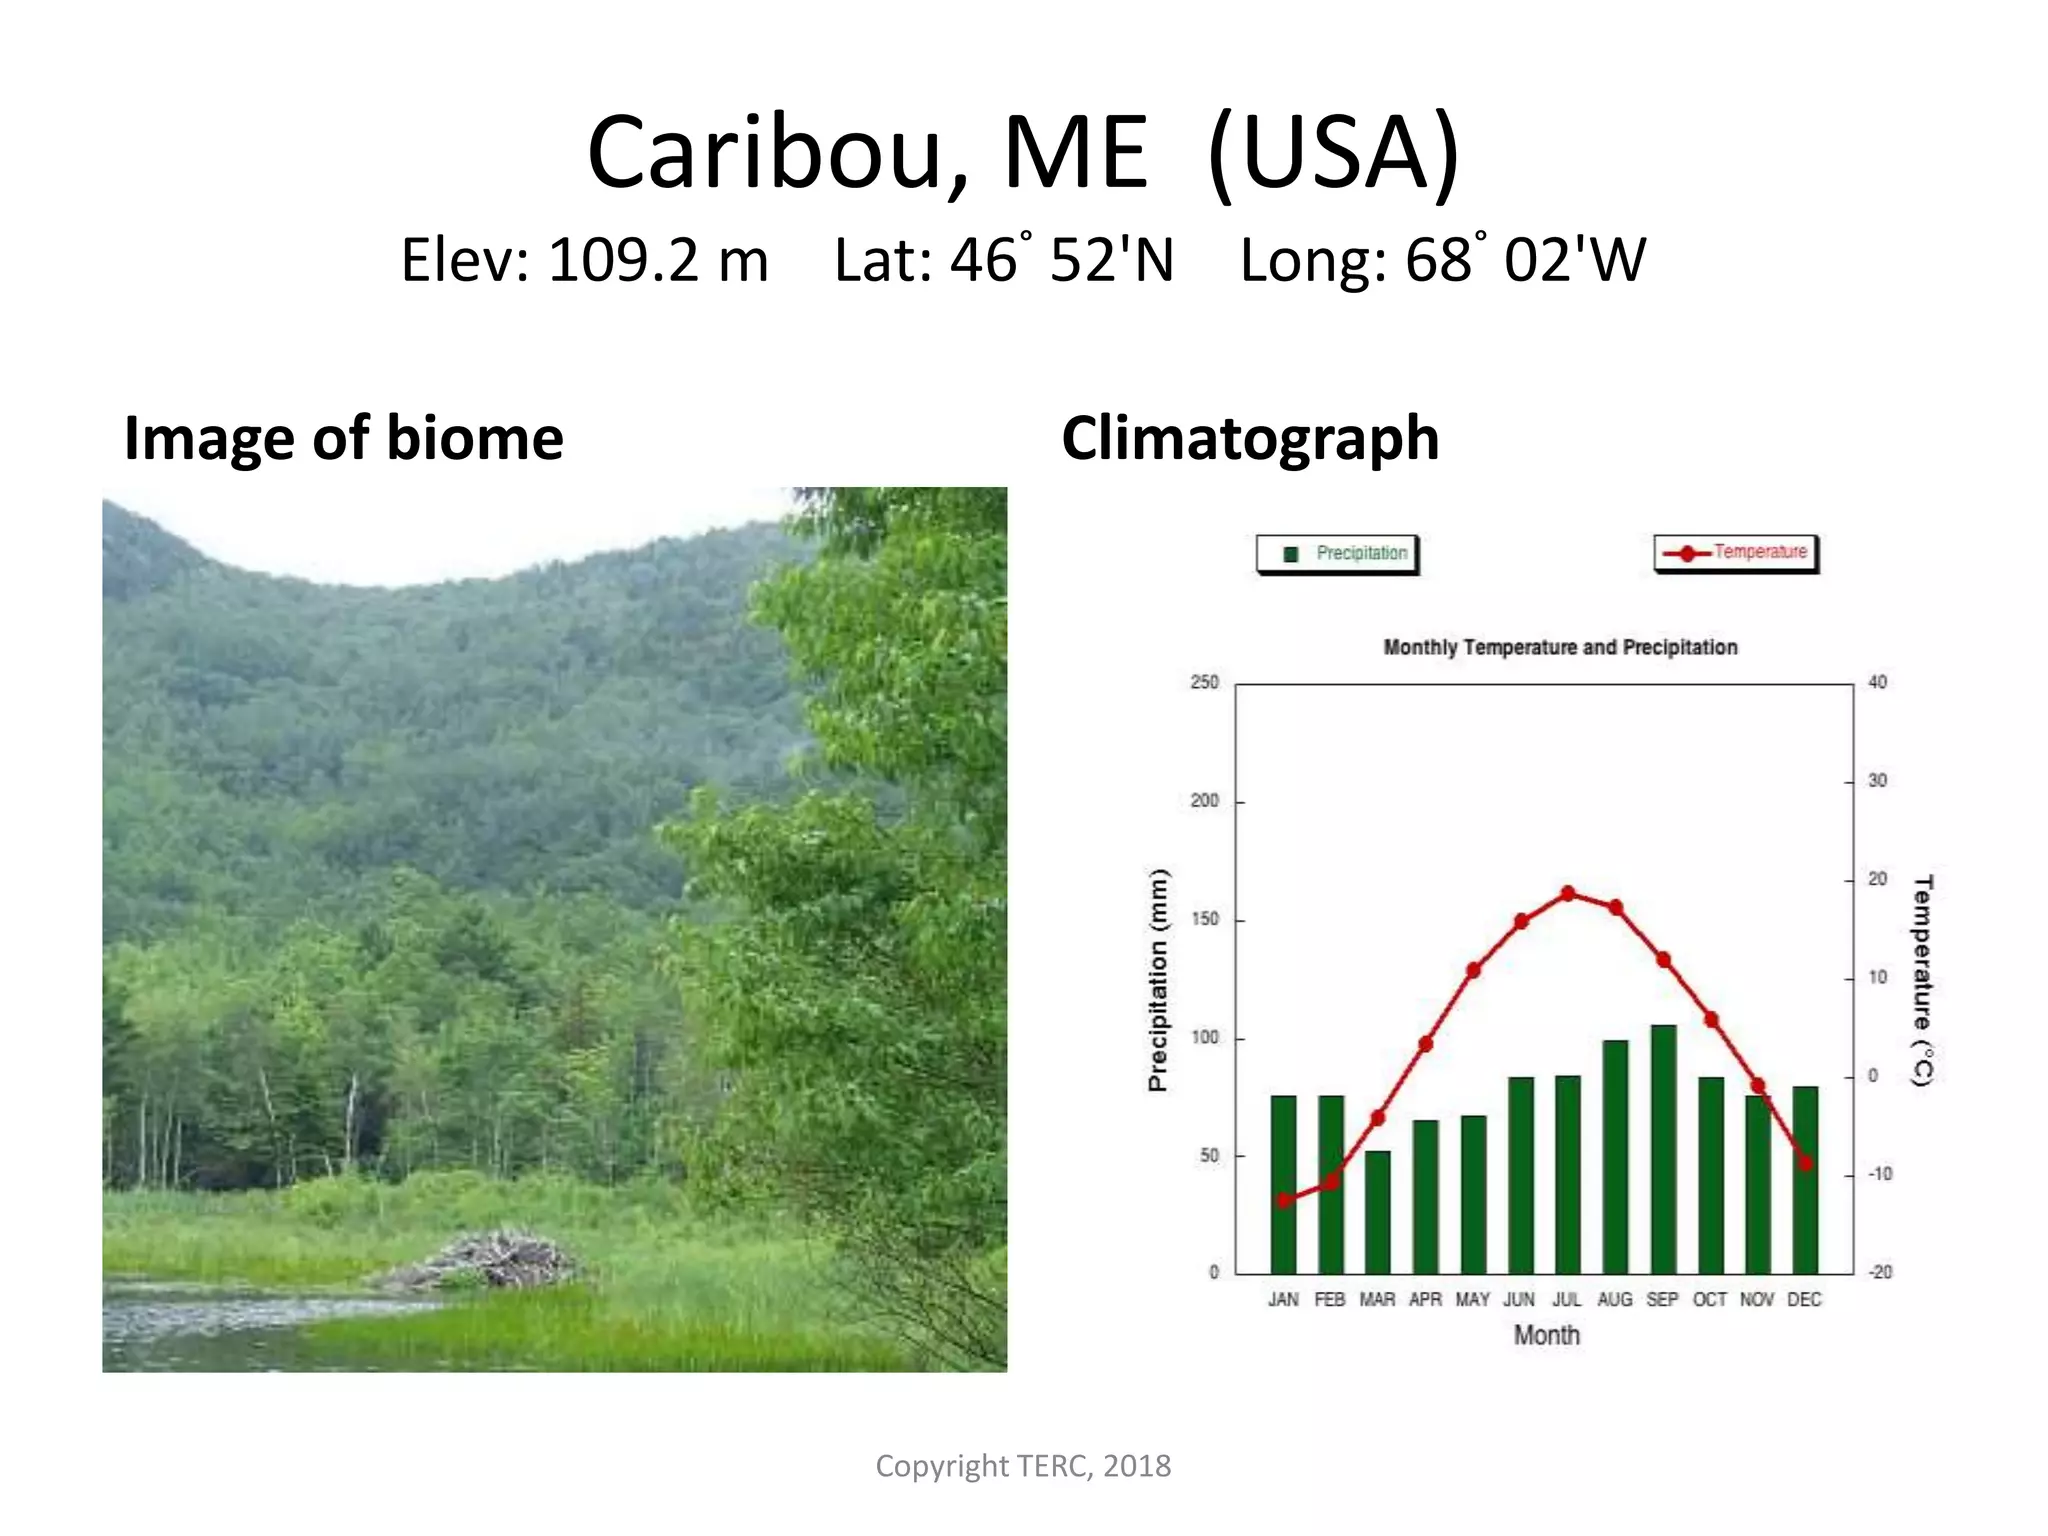
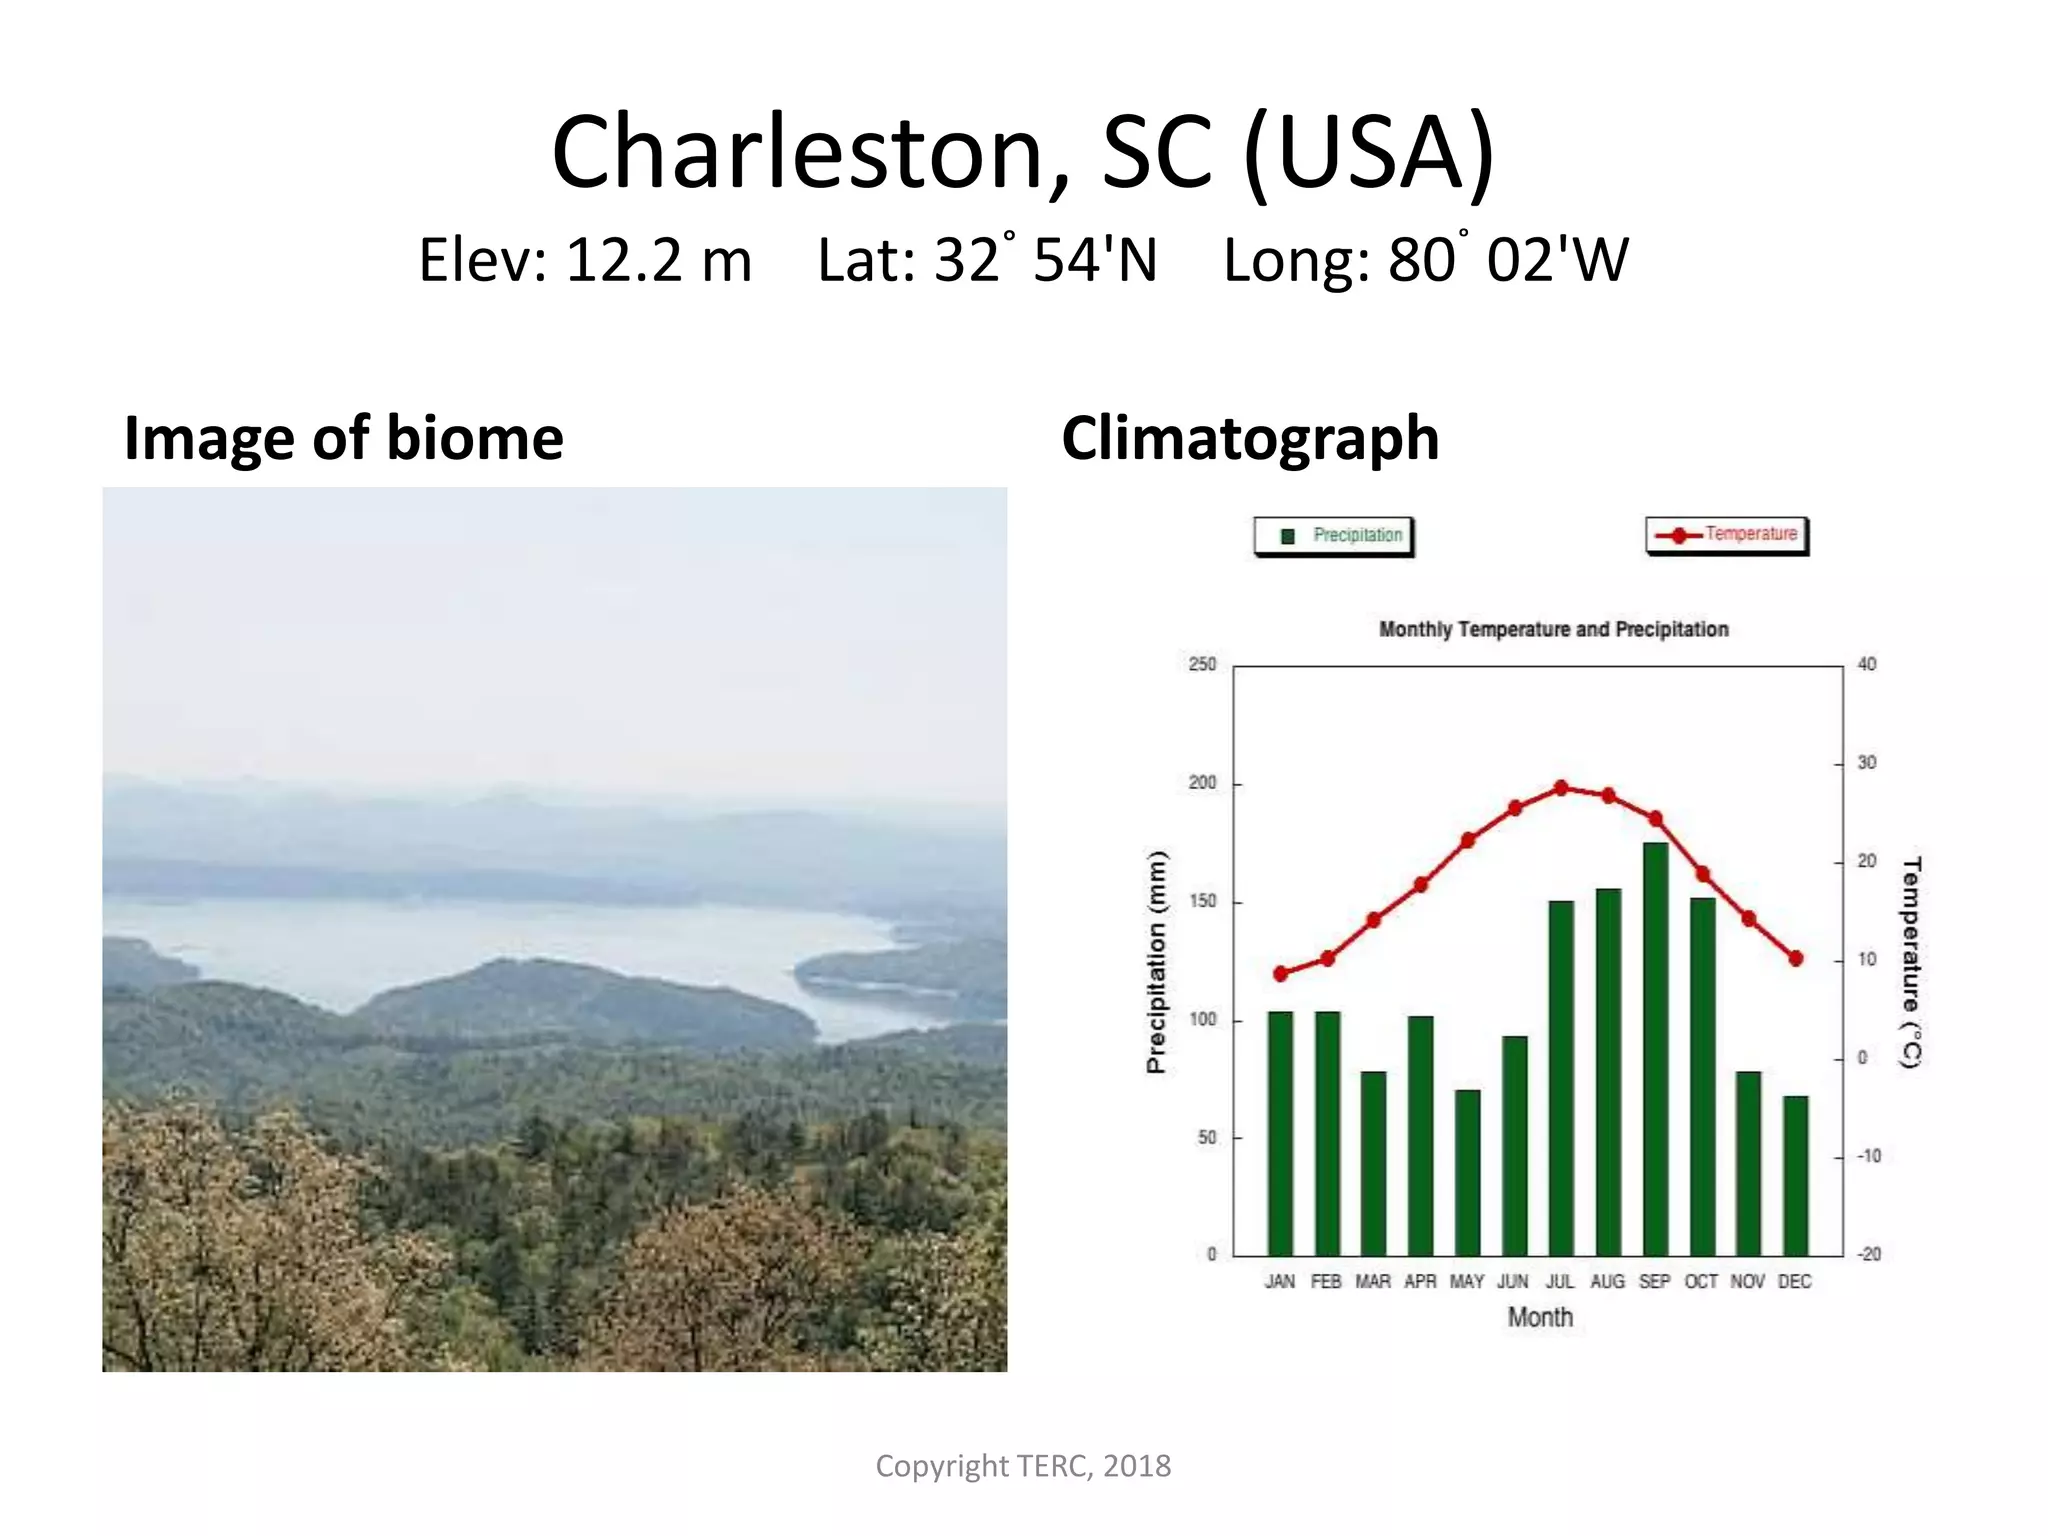
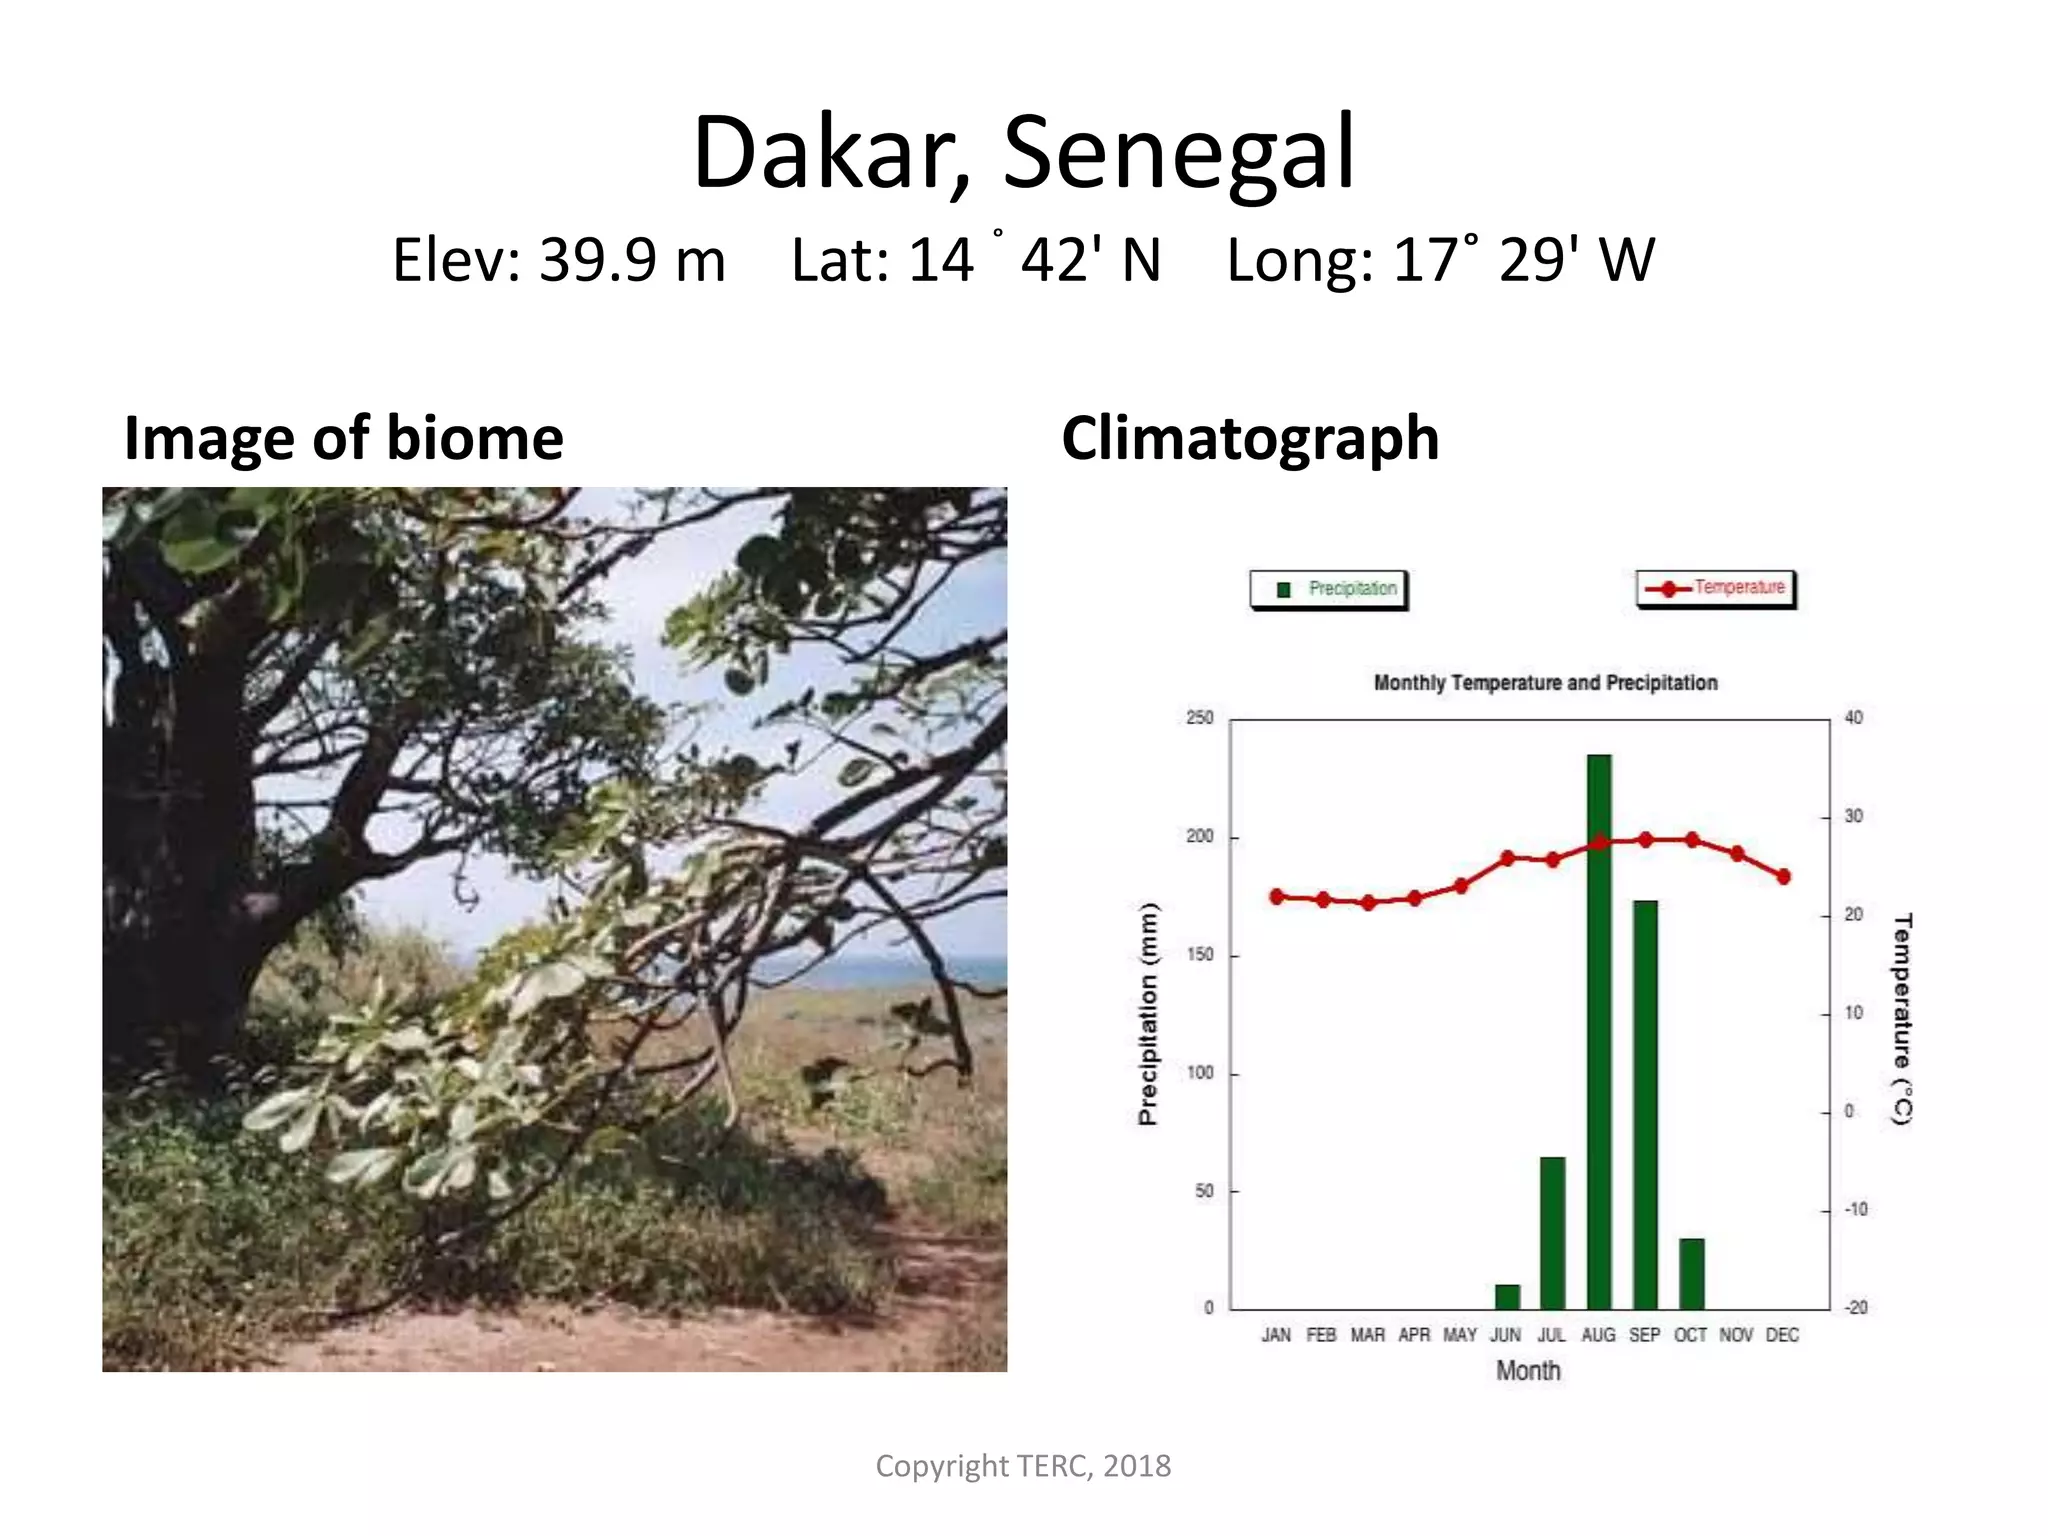
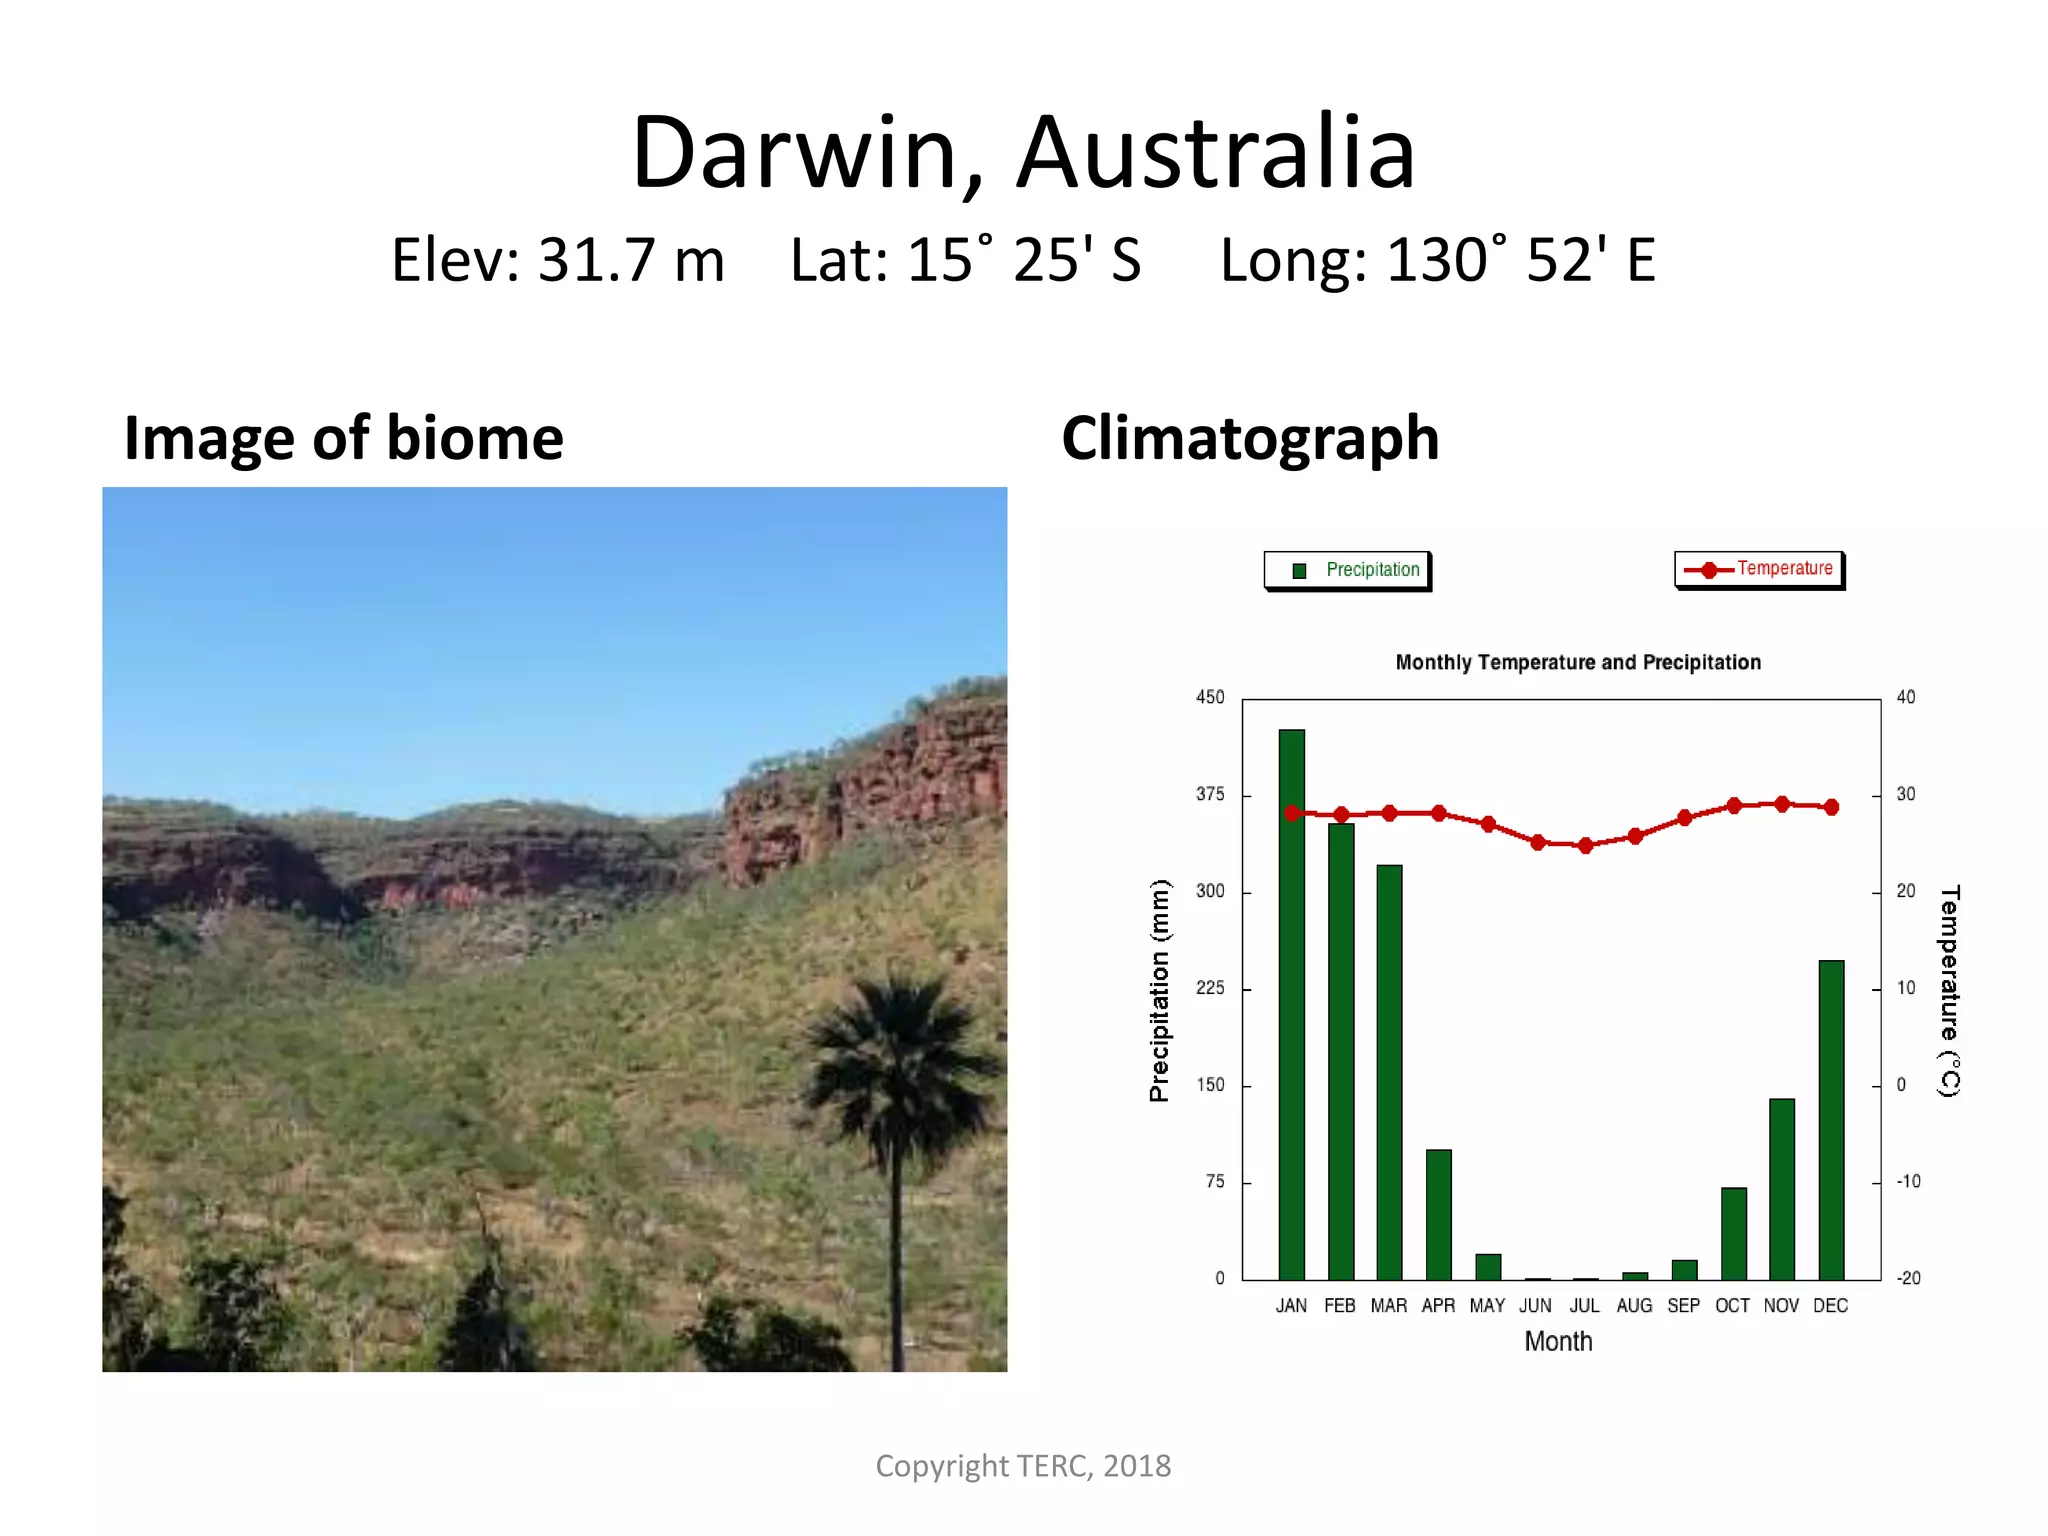
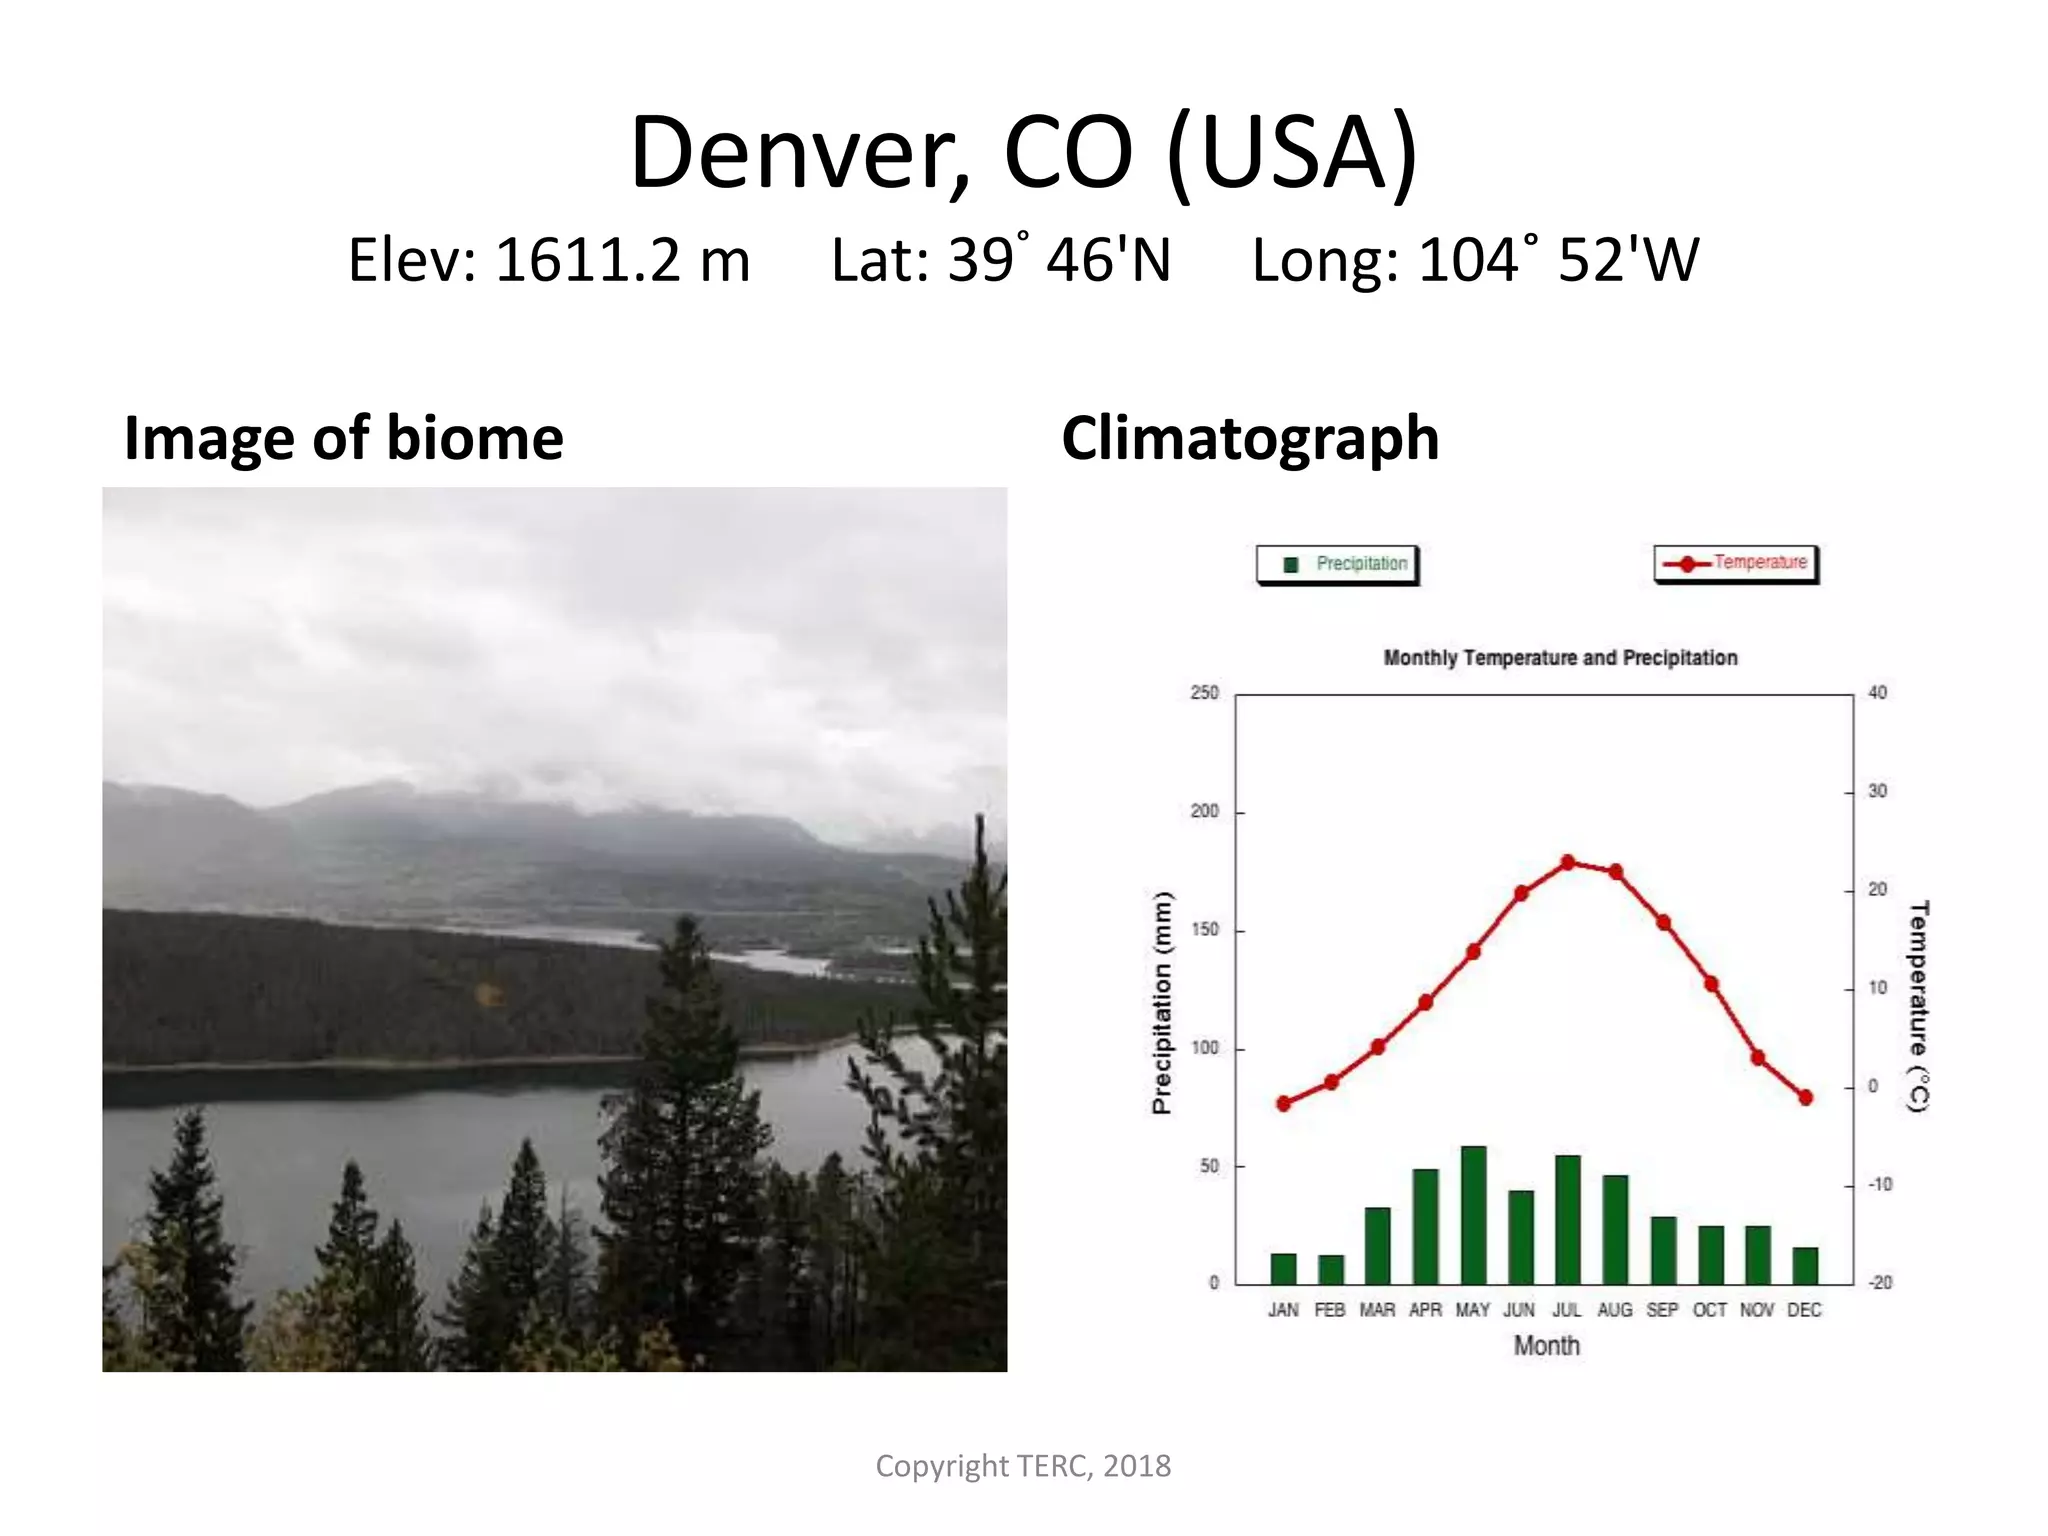
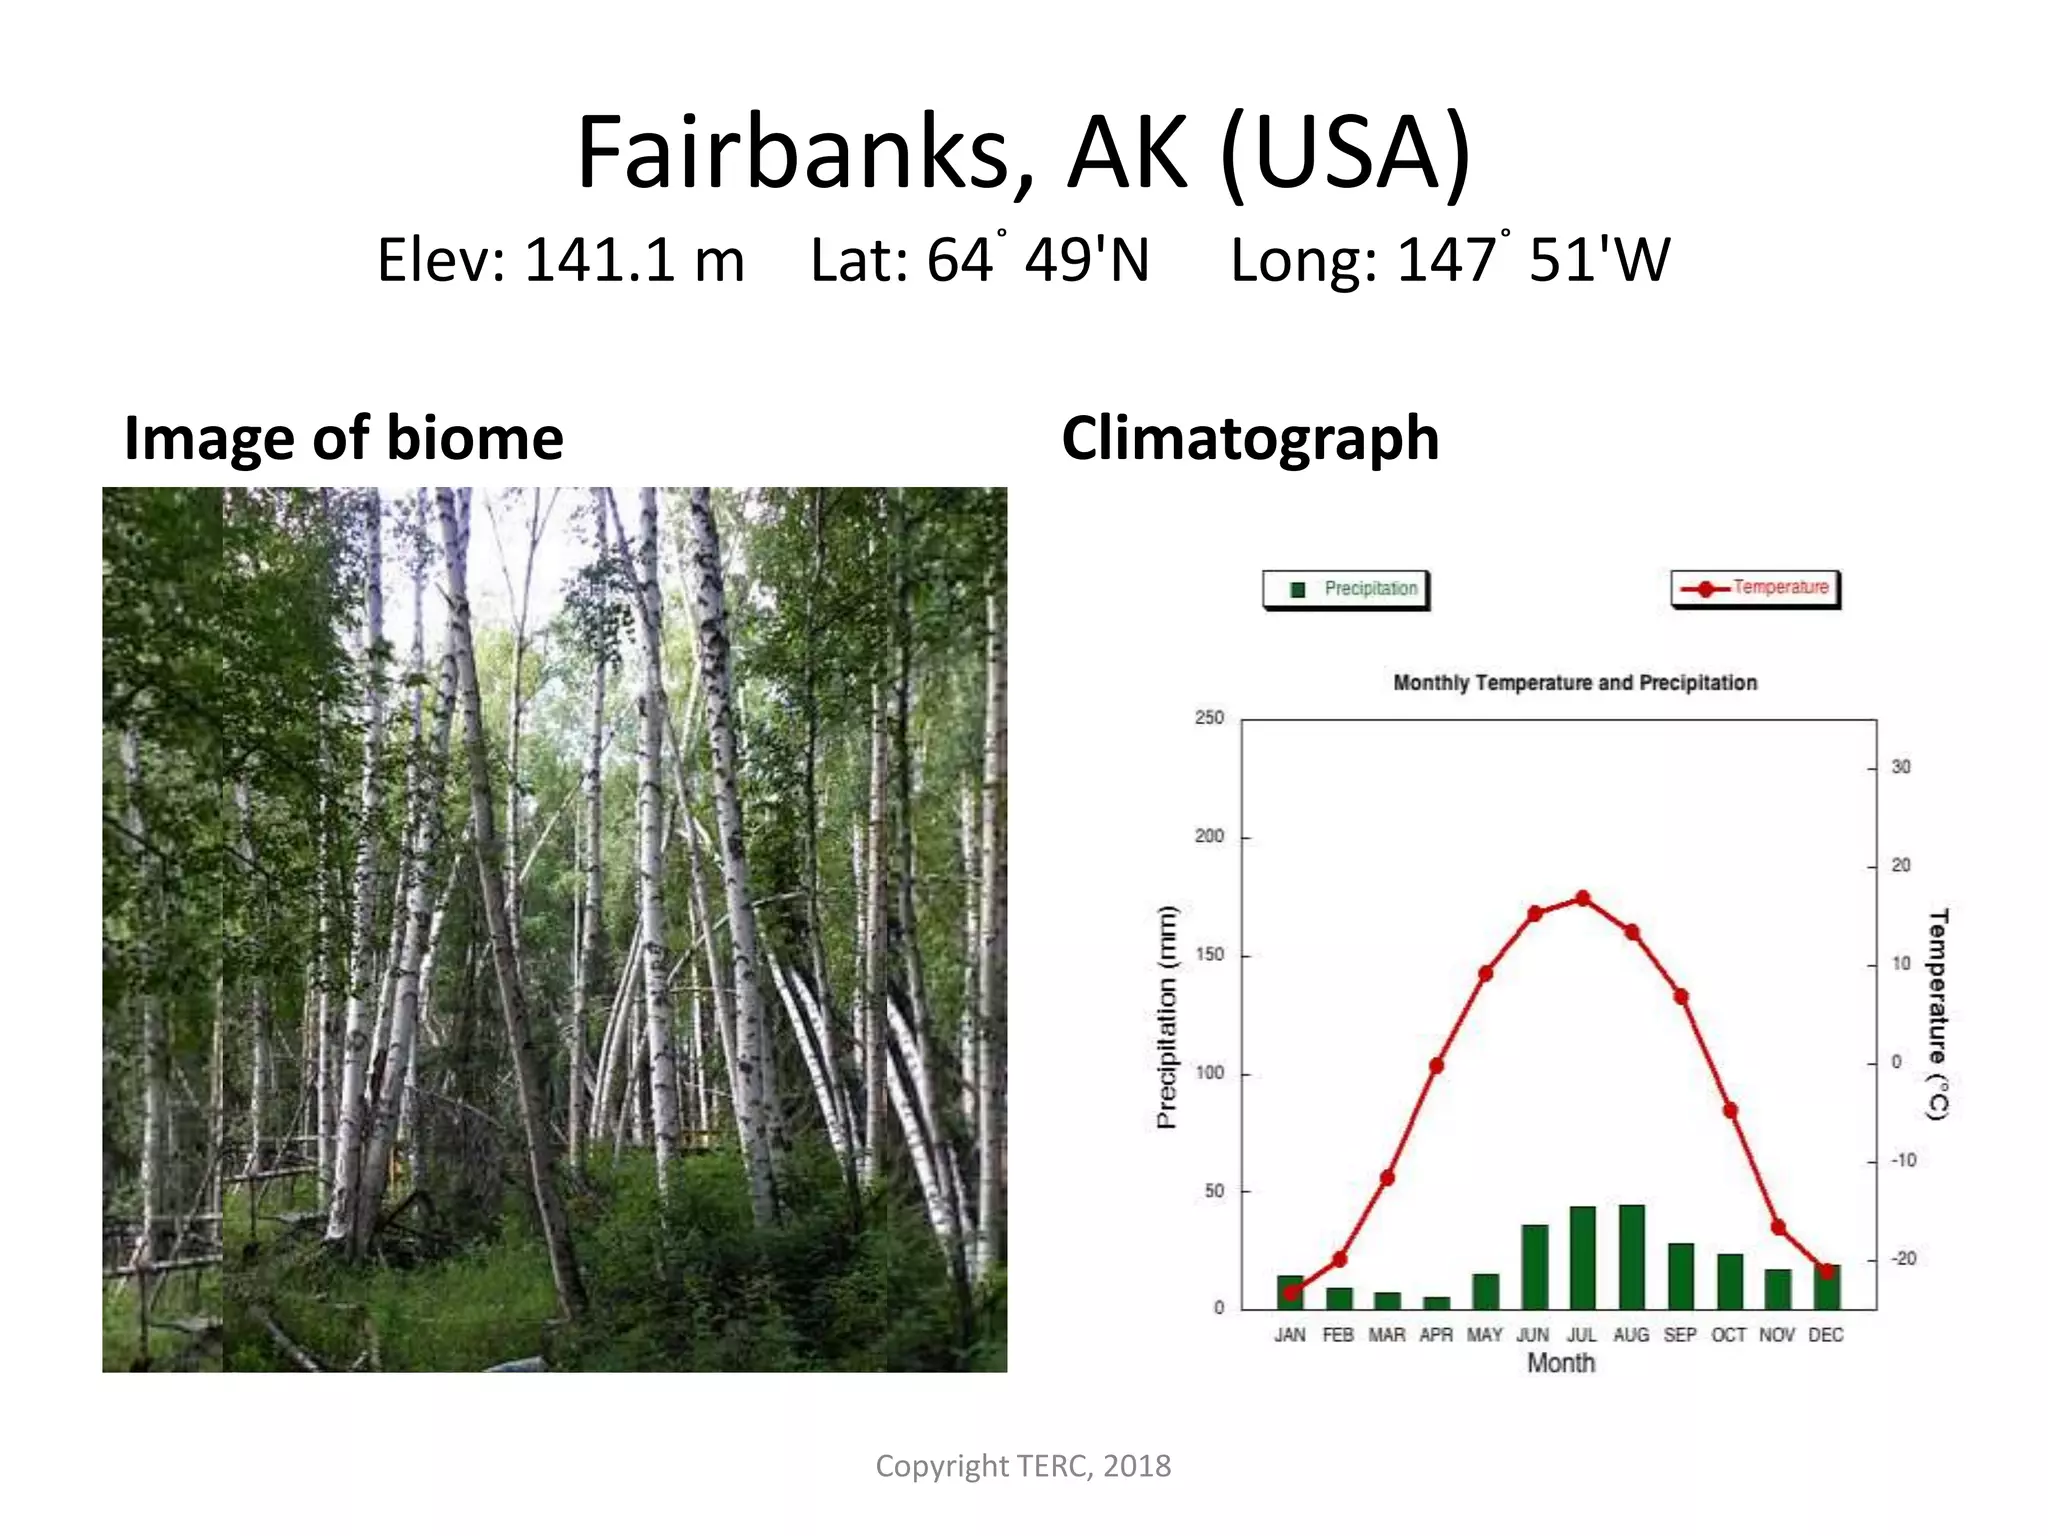
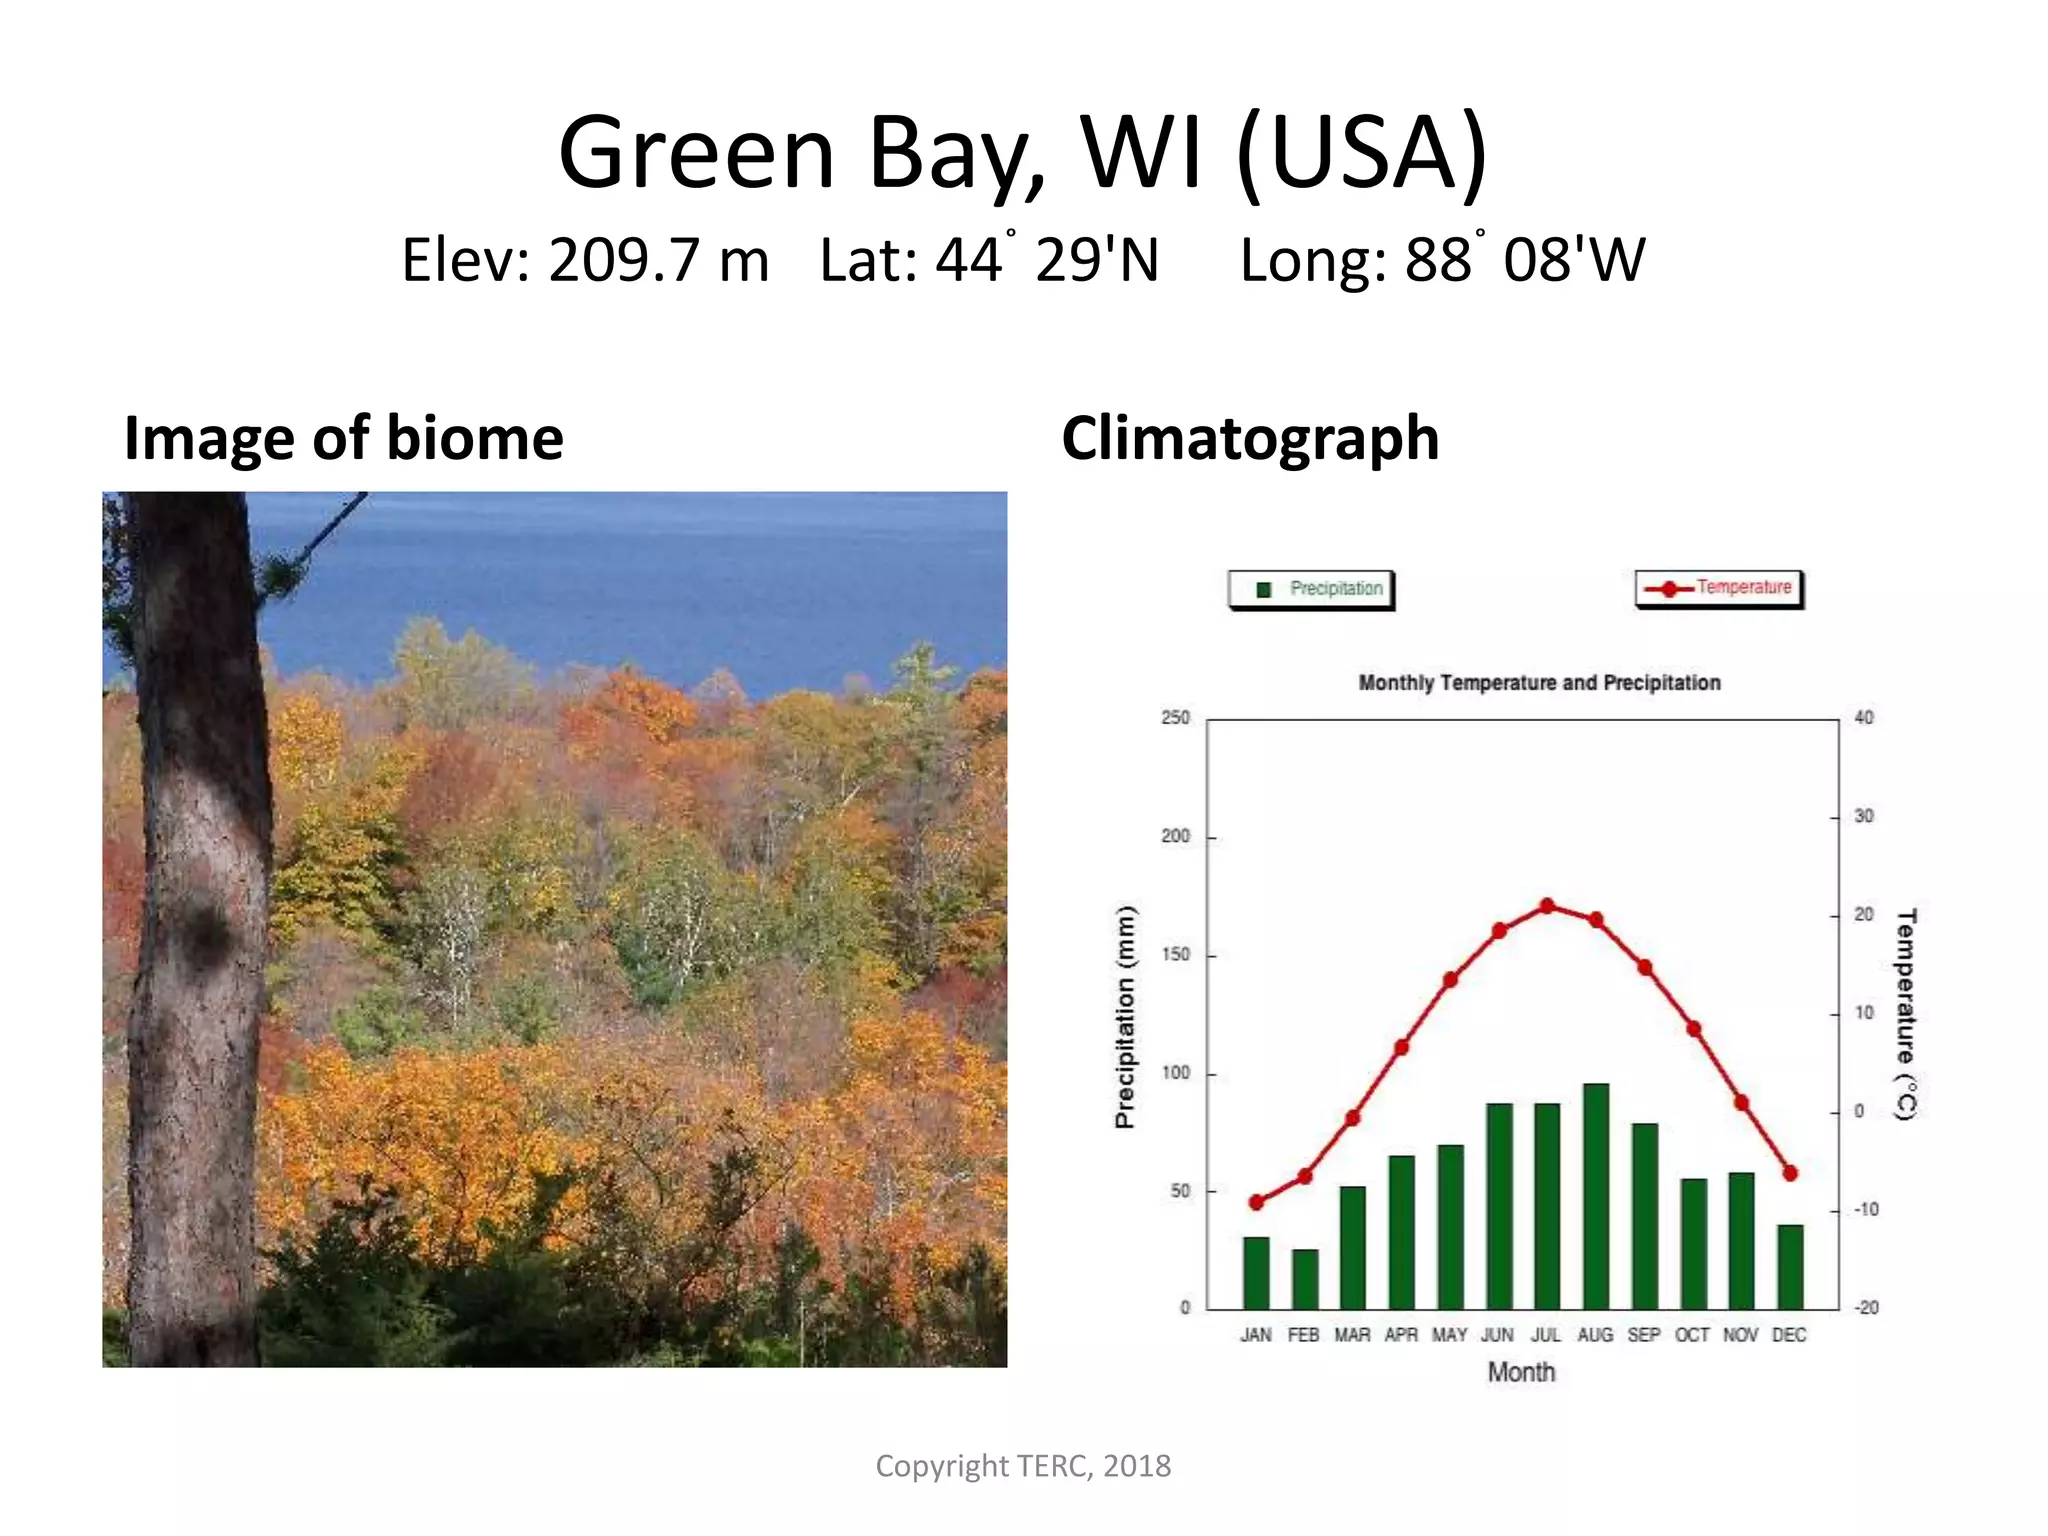
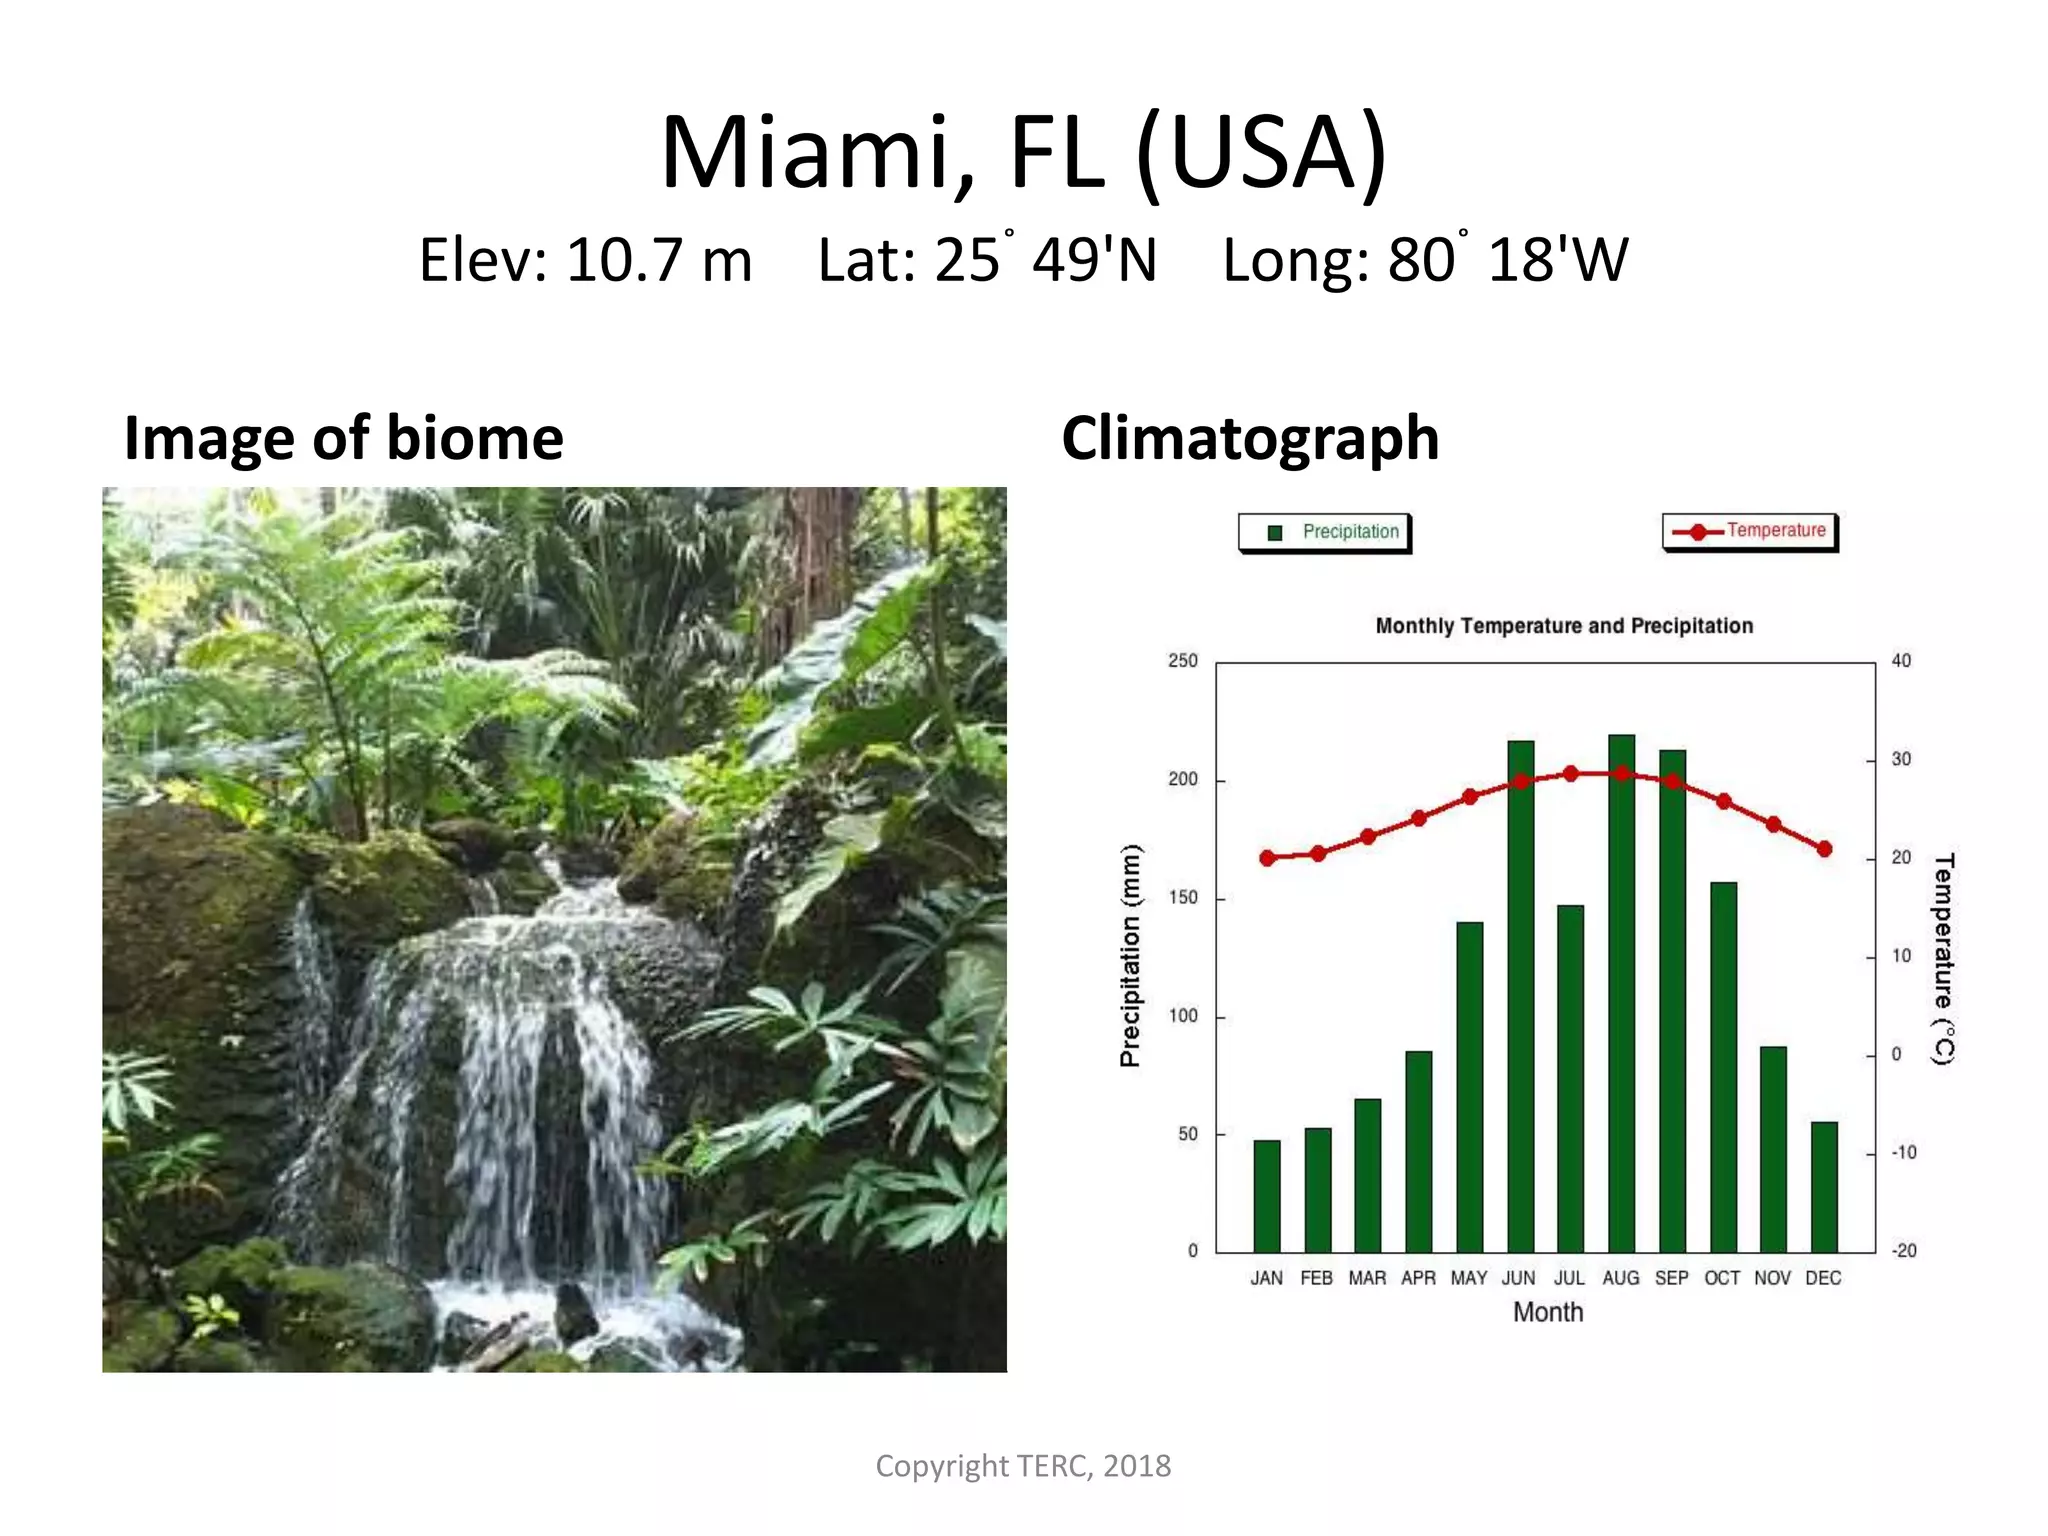
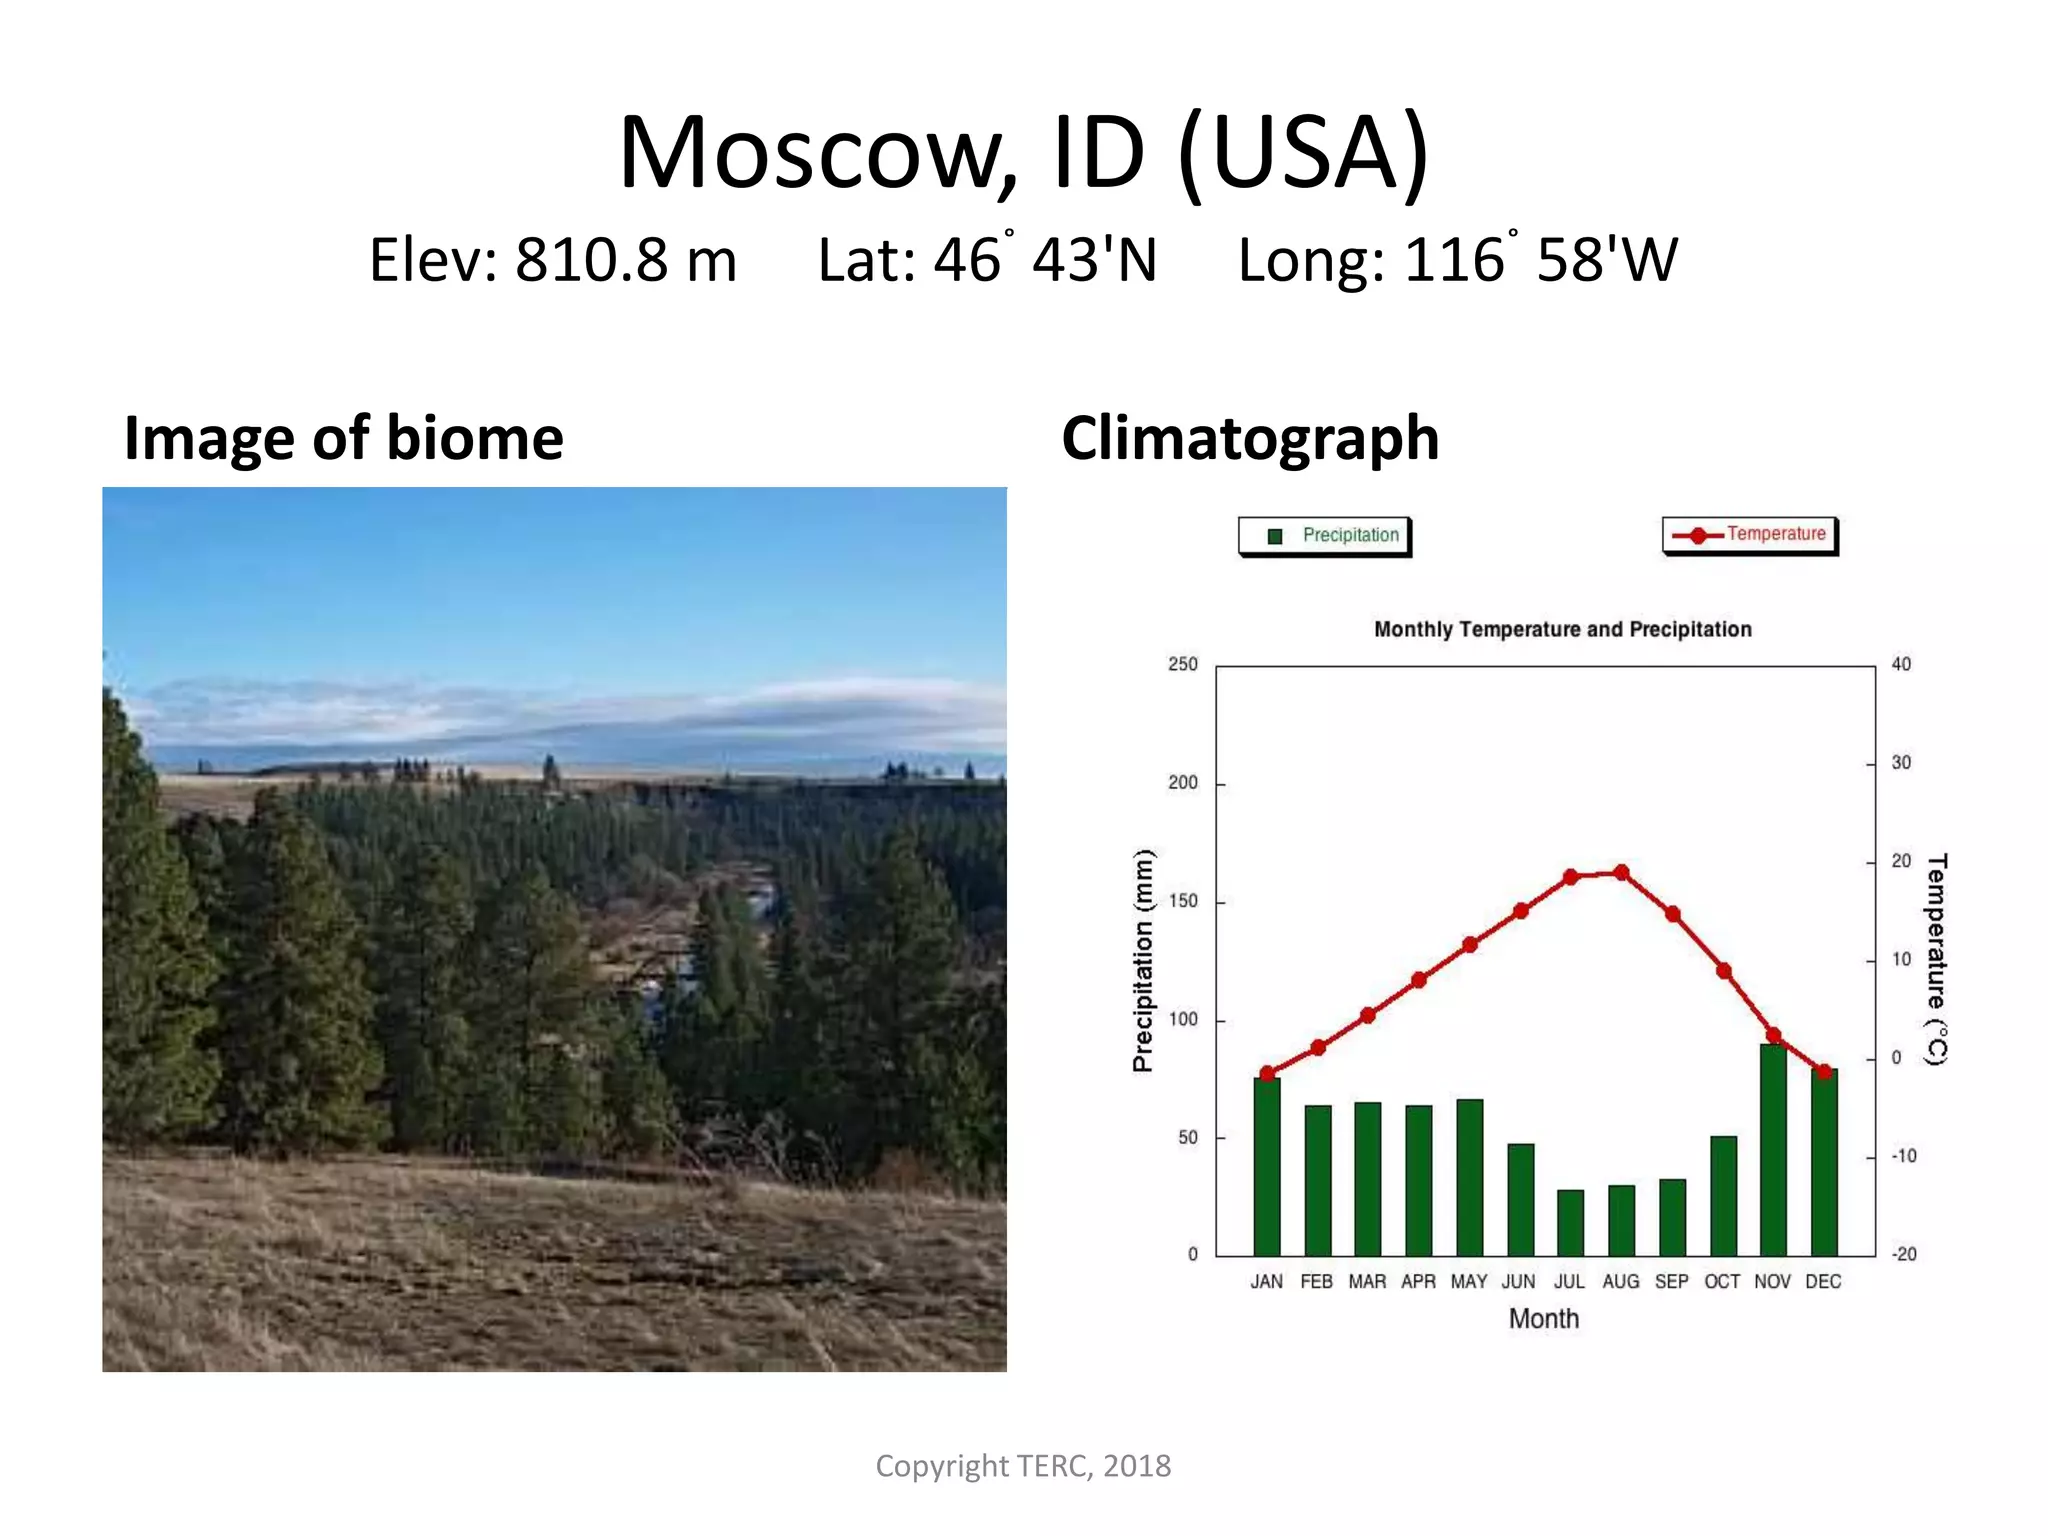
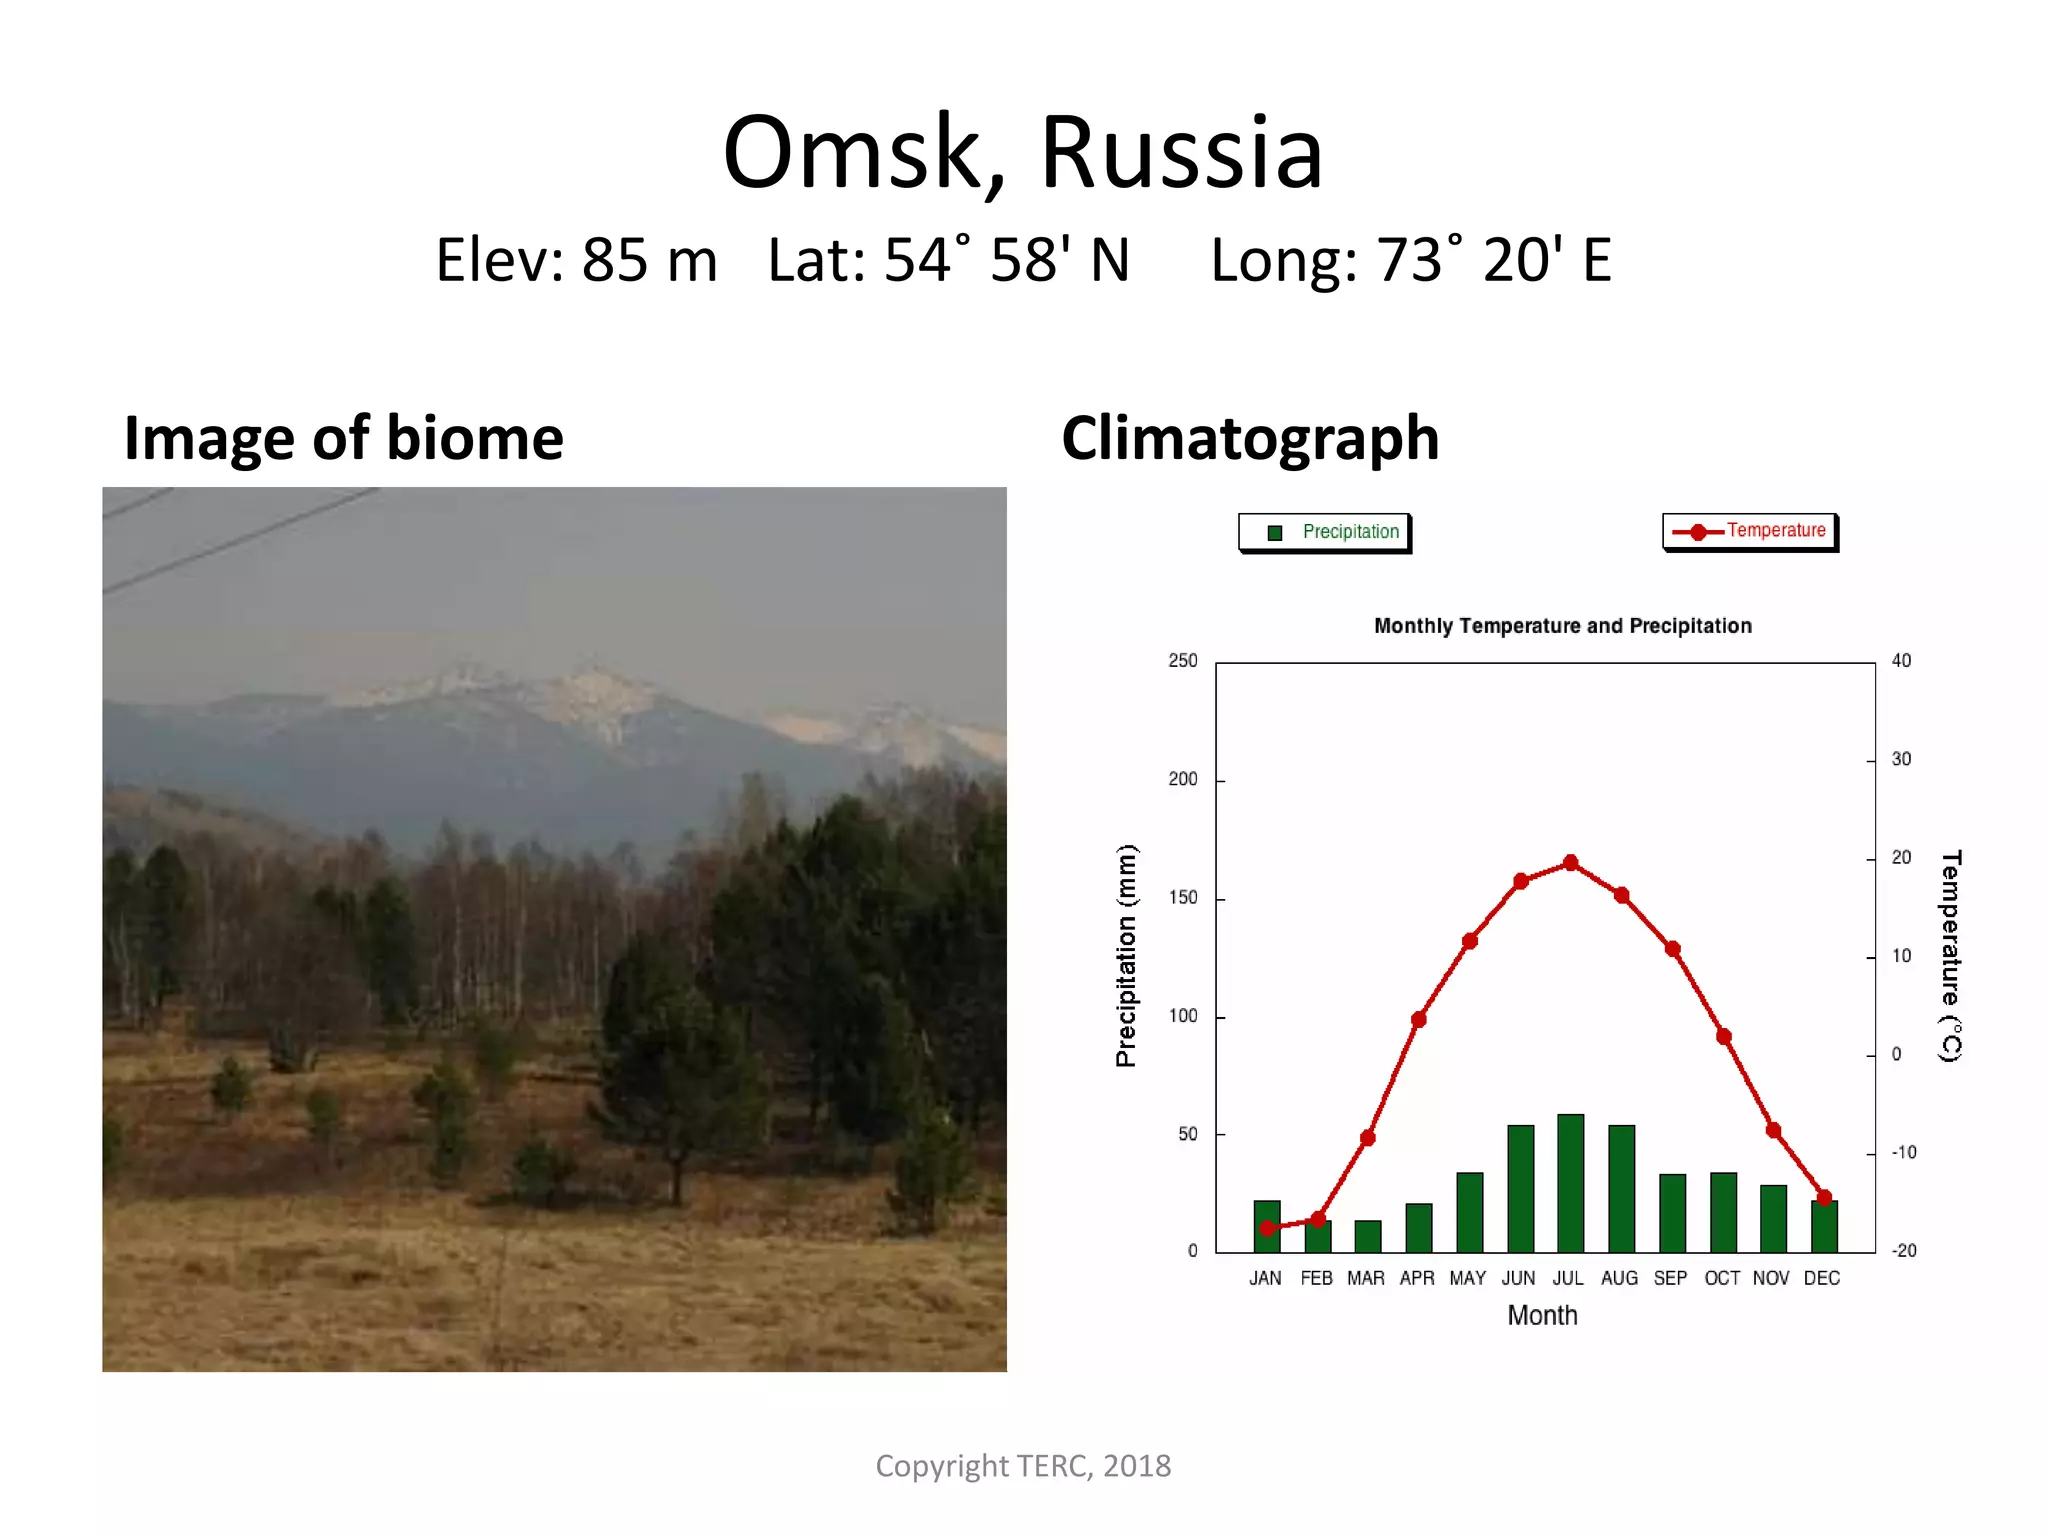
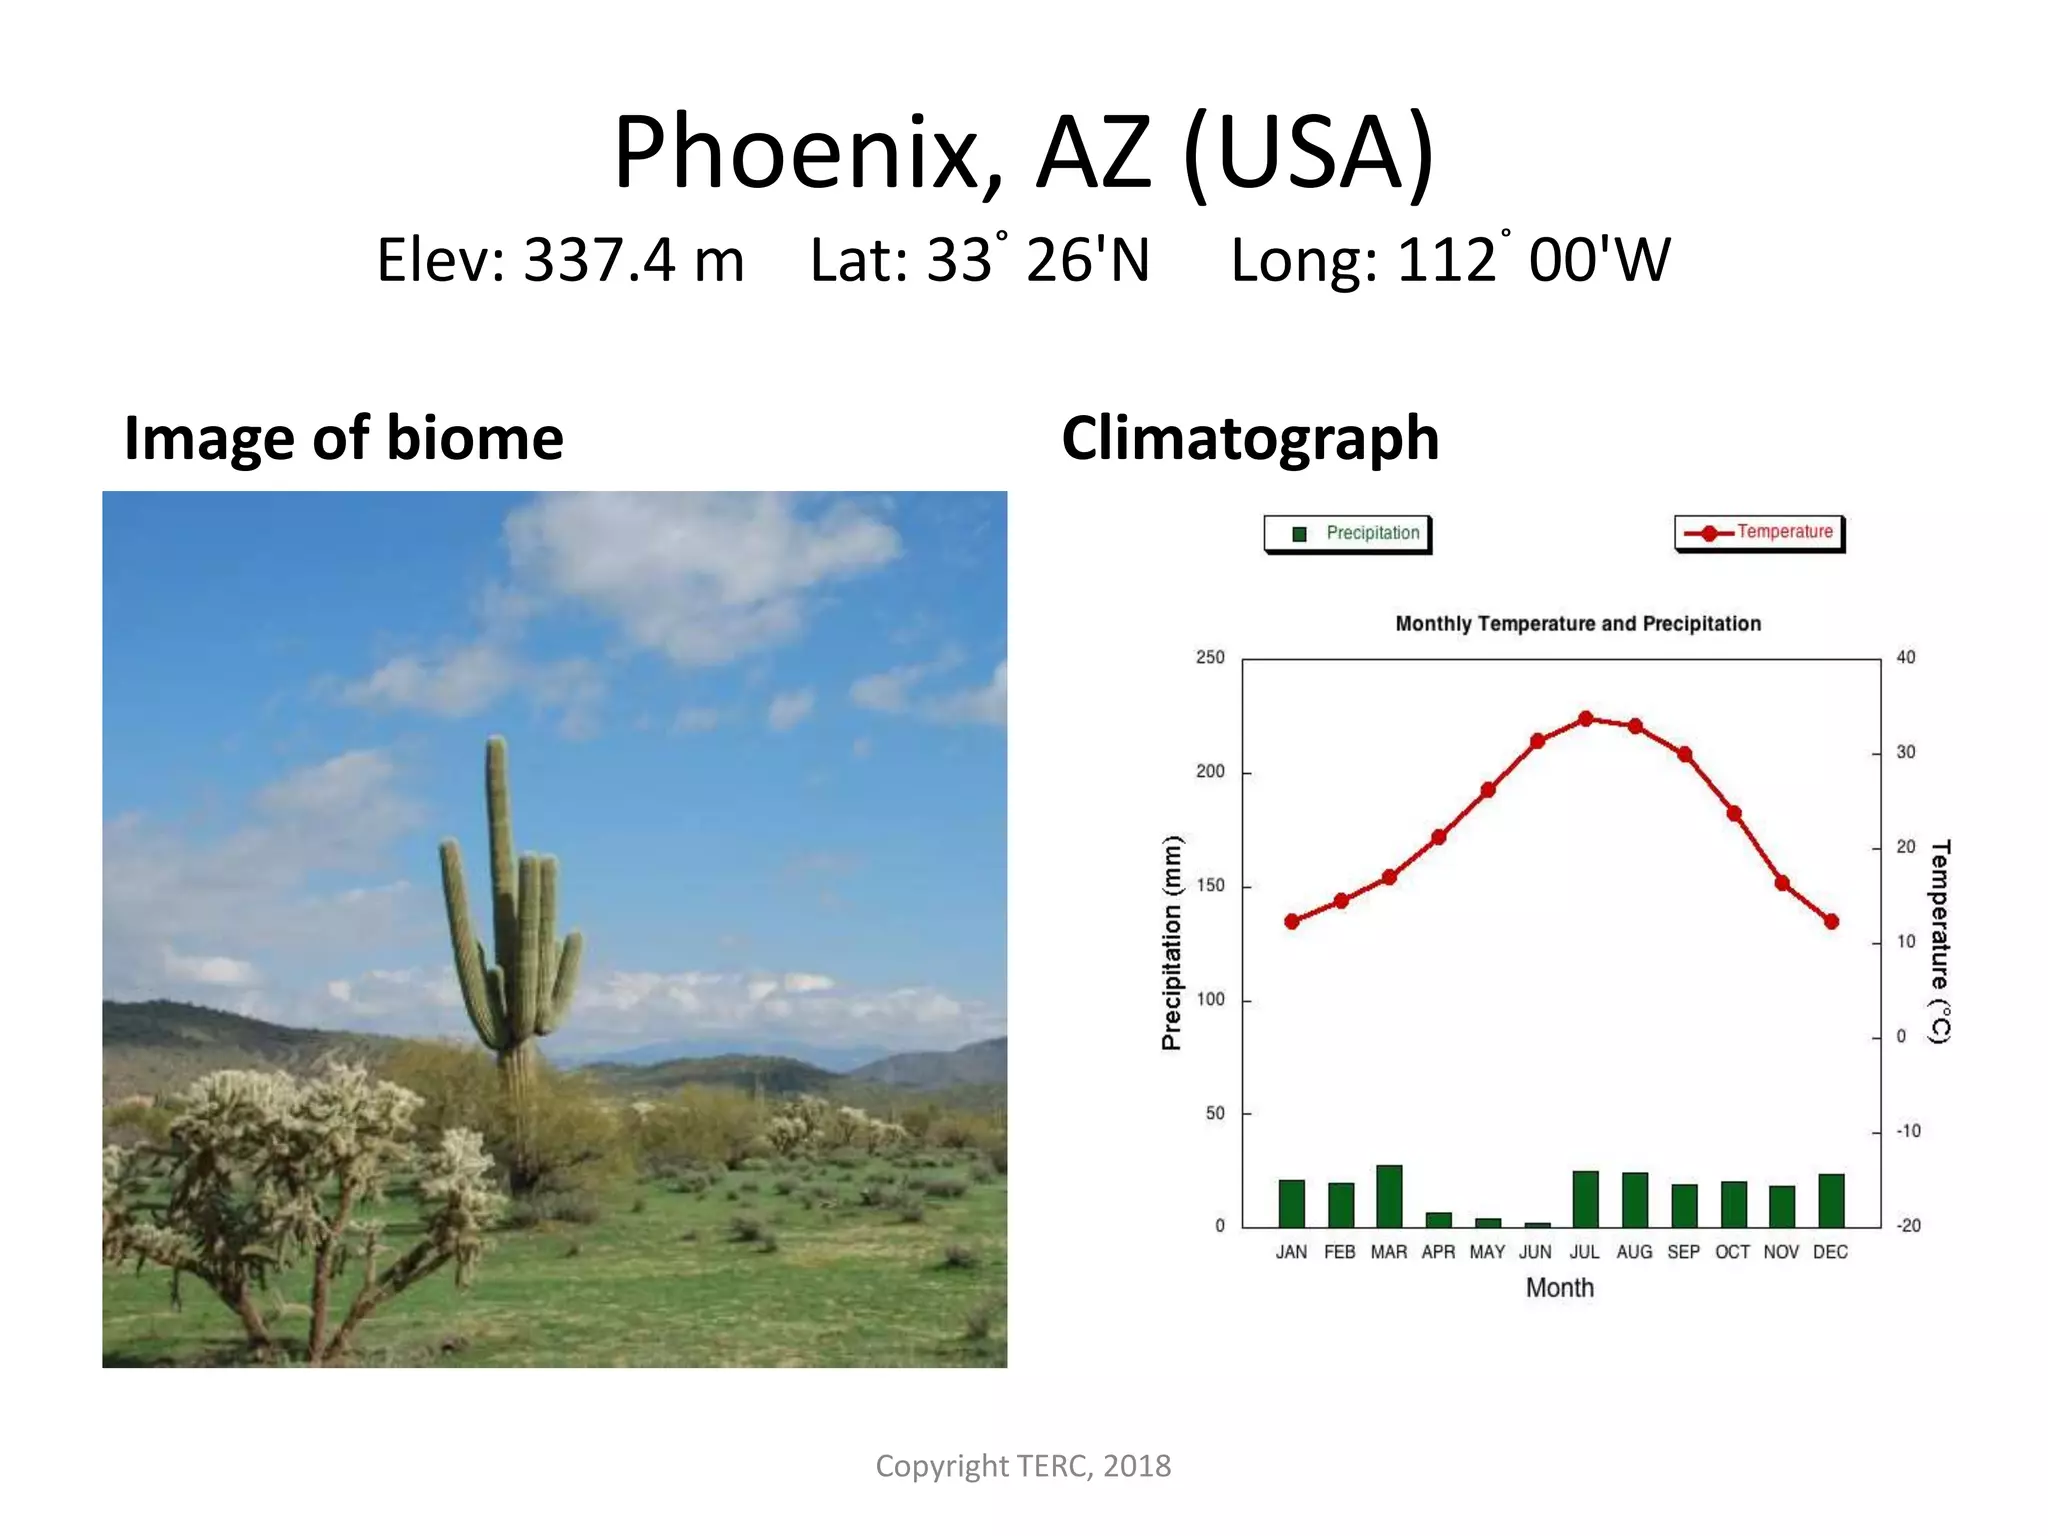
Climate and Biomes
Instructional PowerPoint to accompany
Google Earth activity located at:
https://serc.carleton.edu/eslabs/weather/4b.
html
Copyright TERC, 2018
Instructions:
This PowerPoint is designed to be used as a supplement or alternative to the Google
Earth activity described on this page: http://serc.carleton.edu/eslabs/weather/4b.html
Pre-lab Preparation:
1. Print the PowerPoint 2 slides per page, preferably in color. If possible, laminate
the cards for longevity. Prepare enough sets of cards for each of the lab teams.
2. Print the a copy of the Whittaker classification scheme diagram for each lab team.
3. Print a world climate map (http://www.eduplace.com/ss/maps/world.html) for
each team.
4. Optional: Provide a world map or globe for each lab team. Calculators may also be
helpful for calculating average annual precipitation and temperature.
Day of Activity:
Students read the information on the cards and then sort the cards into stacks
matching them to the Whittaker classification scheme.
Using the data on the cards, place the cards in the correct locations on a large world
map or place location tags on a globe.
fill in a chart, next slide, with the following information: name of the city; average
precipitation and temperature; and biome type.
Answer the Checking In and Stop and Think questions included with this activity.
Sample biome worksheet chart
Copyright TERC, 2018
Average Surface Temperatures, July
What patterns of temperature can be seen in this image?
Average Surface Temperatures, January
What patterns of temperature can be seen in this image?
Average Precipitation, January
Average Precipitation, July
Compare this map with
the temperature and
precipitation maps.
What relationships do
you observe between
the patterns?
Acapulco, Mexico
Elev: 3 m Lat: 16 ° 50' N Long: 99 ° 56'W
Image of biome Climatograph
Copyright TERC, 2018
Addis Ababa, Ethiopia
Elev: 2450m Lat: 09 ˚ 20' N Long:38 ˚ 45' E
Image of biome Climatograph
Copyright TERC, 2018
Alice Springs, Australia
Elev: 6.1m Lat: 23 ° 48' S Long:133 ° 53' E
Image of biome Climatograph
Copyright TERC, 2018
Anchorage, AK (USA)
Elev: 34.7 m Lat:61° 11'N Long:150° 00'W
Image of biome Climatograph
Copyright TERC, 2018
Asheville, NC (USA)
Elev: 652.3 m Lat: 35˚ 26'N Long:82˚ 32'W
Image of biome Climatograph
Copyright TERC, 2018
Athens Greece
Elev: 107 m Lat: 37 ° 58' N Long:23 ° 43' E
Image of biome Climatograph
Copyright TERC, 2018
Atlanta, GA (USA)
Elev: 307.8 m Lat: 33˚ 38'N Long:84˚ 26'W
Image of biome Climatograph
Copyright TERC, 2018
Austin, TX (USA)
Elev: 189.3 m Lat: 30° 18'N Long: 97˚ 42'W
Image of biome Climatograph
Copyright TERC, 2018
Baltimore, Maryland, (USA)
Elev: 45.1 m Lat: 39o 10'N Long: 76o 41'W
Image of biome Climatograph
Copyright TERC, 2018
Bangkok , Thailand
Elev: 16.2 m Lat: 13 ° 44' N Long: 100 ° 30' E
Image of biome Climatograph
Copyright TERC, 2018
Baton Rouge, LA (USA)
Elev: 19.5 m Lat: 30˚ 32'N Long: 91˚ 09'W
Image of biome Climatograph
Copyright TERC, 2018
Belem, Brazil
Elev: 12.8 m Lat: 01 ° 27' S Long: 48 ° 29'W
Image of biome Climatograph
Copyright TERC, 2018
Bismark, ND (USA)
Elev: 503.2 m Lat: 46˚ 47'N Long: 100˚ 45'W
Image of biome Climatograph
Copyright TERC, 2018
Boston, MA (USA)
Elev: 6.1 m Lat: 42˚ 22'N Long: 71˚ 01'W
Image of biome Climatograph
Copyright TERC, 2018
Brownsville, TX (USA)
Elev: 5.8 m Lat: 25˚ 54'N Long: 97˚ 26'W
Image of biome Climatograph
Copyright TERC, 2018
Buffalo, New York (USA)
Elev: 214.9 m Lat: 42o 56'N Long: 78o 44'W
Image of biome Climatograph
Copyright TERC, 2018
Burlington, VT (USA)
Elev: 100.6 m Lat: 44˚ 28'N Long: 73˚ 09'W
Image of biome Climatograph
Copyright TERC, 2018
Cairo, Eygpt
Elev: 116.1 m Lat: 29 ˚ 52' N Long: 31 ˚ 20' E
Image of biome Climatograph
Copyright TERC, 2018
Calgary, Alberta (Canada)
Elev: 1079 m Lat: 51° 06' N Long: 114° 01'W
Image of biome Climatograph
Copyright TERC, 2018
Caribou, ME (USA)
Elev: 109.2 m Lat: 46° 52'N Long: 68° 02'W
Image of biome Climatograph
Copyright TERC, 2018
Charleston, SC (USA)
Elev: 12.2 m Lat: 32° 54'N Long: 80˚ 02'W
Image of biome Climatograph
Copyright TERC, 2018
Christchurch, New Zealand
Elev: 36 m Lat: 43 ° 29' S Long: 172 ° 36' E
Image of biome Climatograph
Copyright TERC, 2018
Dakar, Senegal
Elev: 39.9 m Lat: 14 ˚ 42' N Long: 17˚ 29' W
Image of biome Climatograph
Copyright TERC, 2018
Darwin, Australia
Elev: 31.7 m Lat: 15˚ 25' S Long: 130˚ 52' E
Image of biome Climatograph
Copyright TERC, 2018
Denver, CO (USA)
Elev: 1611.2 m Lat: 39° 46'N Long: 104˚ 52'W
Image of biome Climatograph
Copyright TERC, 2018
Des Moines, IA (USA)
Elev: 291.7 m Lat: 41˚ 32'N Long: 93˚ 40'W
Image of biome Climatograph
Copyright TERC, 2018
Fairbanks, AK (USA)
Elev: 141.1 m Lat: 64˚ 49'N Long: 147˚ 51'W
Image of biome Climatograph
Copyright TERC, 2018
Fresno, CA (USA)
Elev: 101.5 m Lat: 36° 47'N Long: 119° 43'W
Image of biome Climatograph
Copyright TERC, 2018
Green Bay, WI (USA)
Elev: 209.7 m Lat: 44˚ 29'N Long: 88˚ 08'W
Image of biome Climatograph
Copyright TERC, 2018
Hilo, HI (USA)
Elev: 9.1 m Lat: 19˚ 43'N Long: 155˚ 04'W
Image of biome Climatograph
Copyright TERC, 2018
Jackson, MS (USA)
Elev: 94.5 m Lat: 32° 19'N Long: 90° 05'W
Image of biome Climatograph
Copyright TERC, 2018
Lubbock, TX (USA)
Elev: 991.8 m Lat: 33˚ 39'N Long: 101˚ 49'W
Image of biome Climatograph
Copyright TERC, 2018
Miami, FL (USA)
Elev: 10.7 m Lat: 25˚ 49'N Long: 80˚ 18'W
Image of biome Climatograph
Copyright TERC, 2018
Moscow, ID (USA)
Elev: 810.8 m Lat: 46˚ 43'N Long: 116˚ 58'W
Image of biome Climatograph
Copyright TERC, 2018
Omsk, Russia
Elev: 85 m Lat: 54˚ 58' N Long: 73˚ 20' E
Image of biome Climatograph
Copyright TERC, 2018
Phoenix, AZ (USA)
Elev: 337.4 m Lat: 33° 26'N Long: 112˚ 00'W
Image of biome Climatograph
Copyright TERC, 2018
Portland, OR (USA)
Elev: 13.7 m Lat: 43° 39'N Long: 70° 18'W
Image of biome Climatograph
Copyright TERC, 2018
Reykjavik, Iceland
Elev: 28 m Lat: 64 ˚ 09' N Long: 21 ˚ 56' W
Image of biome Climatograph
Copyright TERC, 2018
Salt Lake City, UT (USA)
Elev: 1287.8 m Lat: 40˚ 47'N Long: 111˚ 58'W
Image of biome Climatograph
Copyright TERC, 2018
San Diego, CA (USA)
Elev: 4.0 m Lat: 32˚ 44'N Long:117˚ 10'W
Image of biome Climatograph
Copyright TERC, 2018
Santiago, Chile
Elev: 520 m Lat: 33˚ 27' S Long: 70˚ 42'W
Image of biome Climatograph
Copyright TERC, 2018
Saskatoon, Canada
Elev: 515.1 m Lat: 52˚ 08' N Long: 106˚ 38'W
Image of biome Climatograph
Copyright TERC, 2018
Vancouver, BC (Canada)
Elev: 38.7 m Lat: 49 ˚ 17' N Long: 123 ˚ 05'W
Image of biome Climatograph
Copyright TERC, 2018
Name of City, Country
elevation lat long
Image of biome
Insert a picture of your home
area here.
Climatograph
Insert your Climatograph here:
source of climatographs
Weather.com type in your city
name. On your cities
weather page, click the link
for historical data. Set up
and copy your local
climatograph here.
Copyright TERC, 2018

Climate and Biomes PPT 2

  • 1.
    Climate and Biomes InstructionalPowerPoint to accompany Google Earth activity located at: https://serc.carleton.edu/eslabs/weather/4b. html Copyright TERC, 2018
  • 2.
  • 3.
    Instructions: This PowerPoint isdesigned to be used as a supplement or alternative to the Google Earth activity described on this page: http://serc.carleton.edu/eslabs/weather/4b.html Pre-lab Preparation: 1. Print the PowerPoint 2 slides per page, preferably in color. If possible, laminate the cards for longevity. Prepare enough sets of cards for each of the lab teams. 2. Print the a copy of the Whittaker classification scheme diagram for each lab team. 3. Print a world climate map (http://www.eduplace.com/ss/maps/world.html) for each team. 4. Optional: Provide a world map or globe for each lab team. Calculators may also be helpful for calculating average annual precipitation and temperature. Day of Activity: Students read the information on the cards and then sort the cards into stacks matching them to the Whittaker classification scheme. Using the data on the cards, place the cards in the correct locations on a large world map or place location tags on a globe. fill in a chart, next slide, with the following information: name of the city; average precipitation and temperature; and biome type. Answer the Checking In and Stop and Think questions included with this activity.
  • 4.
    Sample biome worksheetchart Copyright TERC, 2018
  • 5.
  • 6.
    Average Surface Temperatures,July What patterns of temperature can be seen in this image?
  • 7.
    Average Surface Temperatures,January What patterns of temperature can be seen in this image?
  • 8.
  • 9.
  • 10.
    Compare this mapwith the temperature and precipitation maps. What relationships do you observe between the patterns?
  • 11.
    Acapulco, Mexico Elev: 3m Lat: 16 ° 50' N Long: 99 ° 56'W Image of biome Climatograph Copyright TERC, 2018
  • 12.
    Addis Ababa, Ethiopia Elev:2450m Lat: 09 ˚ 20' N Long:38 ˚ 45' E Image of biome Climatograph Copyright TERC, 2018
  • 13.
    Alice Springs, Australia Elev:6.1m Lat: 23 ° 48' S Long:133 ° 53' E Image of biome Climatograph Copyright TERC, 2018
  • 14.
    Anchorage, AK (USA) Elev:34.7 m Lat:61° 11'N Long:150° 00'W Image of biome Climatograph Copyright TERC, 2018
  • 15.
    Asheville, NC (USA) Elev:652.3 m Lat: 35˚ 26'N Long:82˚ 32'W Image of biome Climatograph Copyright TERC, 2018
  • 16.
    Athens Greece Elev: 107m Lat: 37 ° 58' N Long:23 ° 43' E Image of biome Climatograph Copyright TERC, 2018
  • 17.
    Atlanta, GA (USA) Elev:307.8 m Lat: 33˚ 38'N Long:84˚ 26'W Image of biome Climatograph Copyright TERC, 2018
  • 18.
    Austin, TX (USA) Elev:189.3 m Lat: 30° 18'N Long: 97˚ 42'W Image of biome Climatograph Copyright TERC, 2018
  • 19.
    Baltimore, Maryland, (USA) Elev:45.1 m Lat: 39o 10'N Long: 76o 41'W Image of biome Climatograph Copyright TERC, 2018
  • 20.
    Bangkok , Thailand Elev:16.2 m Lat: 13 ° 44' N Long: 100 ° 30' E Image of biome Climatograph Copyright TERC, 2018
  • 21.
    Baton Rouge, LA(USA) Elev: 19.5 m Lat: 30˚ 32'N Long: 91˚ 09'W Image of biome Climatograph Copyright TERC, 2018
  • 22.
    Belem, Brazil Elev: 12.8m Lat: 01 ° 27' S Long: 48 ° 29'W Image of biome Climatograph Copyright TERC, 2018
  • 23.
    Bismark, ND (USA) Elev:503.2 m Lat: 46˚ 47'N Long: 100˚ 45'W Image of biome Climatograph Copyright TERC, 2018
  • 24.
    Boston, MA (USA) Elev:6.1 m Lat: 42˚ 22'N Long: 71˚ 01'W Image of biome Climatograph Copyright TERC, 2018
  • 25.
    Brownsville, TX (USA) Elev:5.8 m Lat: 25˚ 54'N Long: 97˚ 26'W Image of biome Climatograph Copyright TERC, 2018
  • 26.
    Buffalo, New York(USA) Elev: 214.9 m Lat: 42o 56'N Long: 78o 44'W Image of biome Climatograph Copyright TERC, 2018
  • 27.
    Burlington, VT (USA) Elev:100.6 m Lat: 44˚ 28'N Long: 73˚ 09'W Image of biome Climatograph Copyright TERC, 2018
  • 28.
    Cairo, Eygpt Elev: 116.1m Lat: 29 ˚ 52' N Long: 31 ˚ 20' E Image of biome Climatograph Copyright TERC, 2018
  • 29.
    Calgary, Alberta (Canada) Elev:1079 m Lat: 51° 06' N Long: 114° 01'W Image of biome Climatograph Copyright TERC, 2018
  • 30.
    Caribou, ME (USA) Elev:109.2 m Lat: 46° 52'N Long: 68° 02'W Image of biome Climatograph Copyright TERC, 2018
  • 31.
    Charleston, SC (USA) Elev:12.2 m Lat: 32° 54'N Long: 80˚ 02'W Image of biome Climatograph Copyright TERC, 2018
  • 32.
    Christchurch, New Zealand Elev:36 m Lat: 43 ° 29' S Long: 172 ° 36' E Image of biome Climatograph Copyright TERC, 2018
  • 33.
    Dakar, Senegal Elev: 39.9m Lat: 14 ˚ 42' N Long: 17˚ 29' W Image of biome Climatograph Copyright TERC, 2018
  • 34.
    Darwin, Australia Elev: 31.7m Lat: 15˚ 25' S Long: 130˚ 52' E Image of biome Climatograph Copyright TERC, 2018
  • 35.
    Denver, CO (USA) Elev:1611.2 m Lat: 39° 46'N Long: 104˚ 52'W Image of biome Climatograph Copyright TERC, 2018
  • 36.
    Des Moines, IA(USA) Elev: 291.7 m Lat: 41˚ 32'N Long: 93˚ 40'W Image of biome Climatograph Copyright TERC, 2018
  • 37.
    Fairbanks, AK (USA) Elev:141.1 m Lat: 64˚ 49'N Long: 147˚ 51'W Image of biome Climatograph Copyright TERC, 2018
  • 38.
    Fresno, CA (USA) Elev:101.5 m Lat: 36° 47'N Long: 119° 43'W Image of biome Climatograph Copyright TERC, 2018
  • 39.
    Green Bay, WI(USA) Elev: 209.7 m Lat: 44˚ 29'N Long: 88˚ 08'W Image of biome Climatograph Copyright TERC, 2018
  • 40.
    Hilo, HI (USA) Elev:9.1 m Lat: 19˚ 43'N Long: 155˚ 04'W Image of biome Climatograph Copyright TERC, 2018
  • 41.
    Jackson, MS (USA) Elev:94.5 m Lat: 32° 19'N Long: 90° 05'W Image of biome Climatograph Copyright TERC, 2018
  • 42.
    Lubbock, TX (USA) Elev:991.8 m Lat: 33˚ 39'N Long: 101˚ 49'W Image of biome Climatograph Copyright TERC, 2018
  • 43.
    Miami, FL (USA) Elev:10.7 m Lat: 25˚ 49'N Long: 80˚ 18'W Image of biome Climatograph Copyright TERC, 2018
  • 44.
    Moscow, ID (USA) Elev:810.8 m Lat: 46˚ 43'N Long: 116˚ 58'W Image of biome Climatograph Copyright TERC, 2018
  • 45.
    Omsk, Russia Elev: 85m Lat: 54˚ 58' N Long: 73˚ 20' E Image of biome Climatograph Copyright TERC, 2018
  • 46.
    Phoenix, AZ (USA) Elev:337.4 m Lat: 33° 26'N Long: 112˚ 00'W Image of biome Climatograph Copyright TERC, 2018
  • 47.
    Portland, OR (USA) Elev:13.7 m Lat: 43° 39'N Long: 70° 18'W Image of biome Climatograph Copyright TERC, 2018
  • 48.
    Reykjavik, Iceland Elev: 28m Lat: 64 ˚ 09' N Long: 21 ˚ 56' W Image of biome Climatograph Copyright TERC, 2018
  • 49.
    Salt Lake City,UT (USA) Elev: 1287.8 m Lat: 40˚ 47'N Long: 111˚ 58'W Image of biome Climatograph Copyright TERC, 2018
  • 50.
    San Diego, CA(USA) Elev: 4.0 m Lat: 32˚ 44'N Long:117˚ 10'W Image of biome Climatograph Copyright TERC, 2018
  • 51.
    Santiago, Chile Elev: 520m Lat: 33˚ 27' S Long: 70˚ 42'W Image of biome Climatograph Copyright TERC, 2018
  • 52.
    Saskatoon, Canada Elev: 515.1m Lat: 52˚ 08' N Long: 106˚ 38'W Image of biome Climatograph Copyright TERC, 2018
  • 53.
    Vancouver, BC (Canada) Elev:38.7 m Lat: 49 ˚ 17' N Long: 123 ˚ 05'W Image of biome Climatograph Copyright TERC, 2018
  • 54.
    Name of City,Country elevation lat long Image of biome Insert a picture of your home area here. Climatograph Insert your Climatograph here: source of climatographs Weather.com type in your city name. On your cities weather page, click the link for historical data. Set up and copy your local climatograph here. Copyright TERC, 2018

Editor's Notes

  • #2 This file can be used to replace the Google Earth Activity on the Earthlabs site.
  • #3 Google Earth opening window.
  • #6 Whittaker Diagram
  • #7 Source: NASA NEO
  • #8 Data Source: NASA NEO
  • #12 Biome Type: Tropical and Subtropical Dry
  • #13 Biome Type: Montane Grasslands and Shrublands
  • #14 Biome Type: Desert and Xeric Shrubland
  • #15 Biome Type: Tundra, Boreal Forest
  • #16 Biome Type: Temperate Broadleaf Forest
  • #17 Biome Type: Mediterranean Forest
  • #18 Biome Type: Temperate Broadleaf Forest
  • #19 Biome Type: Temperate Broadleaf Forest
  • #20 Biome Type: Tidal Marsh, Temperate Broadleaf Forest
  • #21 Biome Type: Tropical and Subtropical Moist Broadleaf
  • #22 Biome Type: Wetlands
  • #23 Biome Type: Tropical and Subtropical Moist Broadleaf
  • #24 Biome Type: Grassland
  • #25 Biome Type: Temperate Broadleaf Forest
  • #26 Biome Type: Tropical and Subtropical Grasslands, Savannas & Shrubland
  • #27 Elev:214.9 m    Lat: 42o 56'N    Long: 78o 44'W Biome Type: Temperate Broadleaf Forest
  • #28 Biome Type: Temperate Forest
  • #29 Biome Type: Desert and Xeric Shrubland
  • #30 Biome Type: Temperate Grasslands, Savannas & Shrubland
  • #31 Biome Type: Temperate Broadleaf Forest
  • #32 Biome Type: Temperate Coniferous Forest
  • #33 Biome Type: Temperate Grasslands, Savannas & Shrubland
  • #34 Biome Type: Tropical and Subtropical Grasslands, Savannas & Shrubland
  • #35 Biome Type: Tropical and Subtropical Grasslands, Savannas & Shrubland
  • #36 Biome Type: Temperate Coniferous Forest
  • #37 Biome Type: Temperate Grasslands, Savannas & Shrubland
  • #38 Biome Type: Boreal Forest
  • #39 Biome Type: Oak savanna
  • #40 Biome Type: Temperate Broadleaf Forest
  • #41 Biome Type: Tropical and Subtropical Moist Broadleaf
  • #42 Biome Type: Temperate Broadleaf Forest
  • #43 Biome Type: Temperate Grasslands, Savannas & Shrubland
  • #44 Biome Type: Tropical and Subtropical Moist Broadleaf
  • #45 Biome Type: Temperate Coniferous Forest
  • #46 Biome Type: Temperate Grasslands, Savannas & Shrubland
  • #47 Biome Type: Desert and Xeric Shrubland
  • #48 Biome Type: Temperate Broadleaf Forest
  • #49 Biome Type: Tundra
  • #50 Biome Type: Desert Wetlands
  • #51 Biome Type: Mediterranean, Woodlands and Shrubland
  • #52 Biome Type: Mediterranean, Woodlands and Shrubland
  • #53 Biome Type: Temperate Grasslands, Savannas & Shrubland
  • #54 Biome Type: Temperate Coniferous Forest
  • #55 Biome Type: description and any other notes.