This study analyzed the relationship between the Madden-Julian Oscillation (MJO), El Niño Southern Oscillation (ENSO), and the impacts of Saharan Air Layer (SAL) dust storms on 96 tropical cyclones in the Atlantic. The results showed that MJO wet phases and El Niño conditions were associated with lower minimum central pressures and fewer dust impacts for tropical cyclones. SAL dust was found to increase wind shear and dry air uptake, weakening storms. Future work will further examine the MJO-ENSO relationship and dust concentration effects on storm intensity changes.
Telluric currents are the currents that are responsible for the generation of earth's magnetic field. Also the help the earth to bound onto the solar path around the sun.
Telluric currents are the currents that are responsible for the generation of earth's magnetic field. Also the help the earth to bound onto the solar path around the sun.
Review of last week's lecture. Air's composition. Particulates. Vertical structure of the atmosphere. Conduction, ELR, ozone. Review of today's material.
SEMS and ATMOSPHERIC STRUCTURE
As we know, the main states of matter are three: solid, liquid and gas; states whose respective elasticities have their corresponding formulas or equations. We also know that the atmosphere is the gaseous part that surrounds the Earth and that this consists of 5 layers: troposphere, stratosphere, mesosphere, thermosphere or ionosphere and exosphere. The troposphere is the lowest layer in contact with the earth and with higher density , since it supports the other layers and wherein the greater thermal variations take place, leading in turn to the variations of pressure (high and low pressure) , which are the cause of the meteorological or climate phenomenas.
earth is being cover with the blanket of gases called atmosphere which is further divided into 4 layers troposphere, stratosphere, mesosphere and thermospere
each layer is made up of some chemical constituents which could be water molecule traces of gases etc, Japan has done research and send a satellite in space to observe it as describe in this presentation
This is the paper for our final project in our Numerical Weather Prediction class. For this project, we analyzed model output from a Nested Regional Climate Model (NRCM), which is an adaptation of the Advanced Research WRF (ARW). The model output variables analyzed were outgoing long wave radiation (OLR) and precipitation (convective plus non-convective). The goal of this research project was to determine why errors were occurring in the model, and what could be done to correct them. In this paper, we provide some insight into why these errors occurred, particularly errors within the model which equaled or surpassed the overall mean climate error.
diurnal temperature range trend over North Carolina and the associated mechan...Sayem Zaman, Ph.D, PE.
This study seeks to investigate the variability and presence of trends in the diurnal surface air temperature range
(DTR) over North Carolina (NC) for the period 1950–2009. The significance trend test and the magnitude of trends were determined using the non-parametric Mann–Kendall test and the Theil–Sen approach, respectively.
Statewide significant trends (p b 0.05) of decreasing DTR were found in all seasons and annually during the analysis period. The highest (lowest) temporal DTR trends of magnitude −0.19 (−0.031) °C/decade were found in summer (winter). Potential mechanisms for the presence/absence of trends in DTR have been highlighted. Historical
data sets of the three main moisture components (precipitation, total cloud cover (TCC), and soil moisture) and
the two major atmospheric circulation modes (North Atlantic Oscillation and Southern Oscillation) were used for
correlation analysis. The DTRs were found to be negatively correlated with the precipitation, TCC, and soil moisture across the state for all the seasons and annual basis. It appears that the moisture components related better to the DTR than to the atmospheric circulation modes.
Understanding Cyclones. Cyclone Freddy being of interestPeter Maphalla
These was an assignment that we were required to complete with the topic being the understanding of tropical cyclones. But the main focus of these research was on cyclone freddy which was the longest living cyclone in history. I hope you enjoy my work
Impact of Climate Modes such as El Nino on Australian RainfallAlexander Pui
The relationship between seasonal aggregate rainfall and large scale climate modes, particularly the El Niño-Southern Oscillation (ENSO), has been the subject of a significant and on-going research effort. However, relatively little is known about how the character of individual rainfall events varies as a function of each of these climate modes. This study investigates the change in rainfall occurrence, intensity, and storm inter-event time at both daily and sub-daily timescales in East Australia, as a function of indices for ENSO, the Indian Ocean Dipole (IOD), and the Southern Annular Mode (SAM), with a focus on the cool season months. Long record data sets have been used to sample large variety of climate events for better statistical significance. Results using both the daily and sub-daily rainfall data sets consistently show that it is the occurrence of rainfall events, rather than the average intensity of rainfall during the events, which is most strongly influenced by each of the climate modes. This is shown to be most likely associated with changes to the time between wet spells. Furthermore, it is found that despite the recent attention in the research literature on other climate modes, ENSO remains the leading driver of rainfall variability over East Australia, particularly further inland during the winter and spring seasons.
International Journal of Engineering Research and Applications (IJERA) is an open access online peer reviewed international journal that publishes research and review articles in the fields of Computer Science, Neural Networks, Electrical Engineering, Software Engineering, Information Technology, Mechanical Engineering, Chemical Engineering, Plastic Engineering, Food Technology, Textile Engineering, Nano Technology & science, Power Electronics, Electronics & Communication Engineering, Computational mathematics, Image processing, Civil Engineering, Structural Engineering, Environmental Engineering, VLSI Testing & Low Power VLSI Design etc.
Hurricanes and Global Warming- Dr. Kerry EmanuelJohn Atkeison
Dr. Kerry Emanuel explains how Global Warming increased the power of hurricanes. Hurricane Katrina is discussed, with the conclusion that Katrina probably would not have had the power to break the New Orleans levees in a pre-Global Warming world. April 2009 webinar presented by the Southern Allicance for Clean Energy (http://www.cleanenergy.org/) and the Gulf Restoration Network (http://healthygulf.org/) SlideCast by John Atkeison of the Alliance for Affordable Energy. There is a very small amount of phone noise.
1. A Climatological Relationship between MJO/ENSO Phases and Tropical
Cyclone Interactions with Saharan Dust Storms across the Tropical Atlantic
Jordan Rabinowitz1, Anthony R. Lupo2
1,2Department of Soil, Environmental & Atmospheric Sciences
University of Missouri-Columbia
Introduction/Background
Saharan Air Layer (SAL): dry air masses (1.5 to 3 km in depth) that form over the Sahara Desert (late spring to early
fall) and usually move across the Atlantic Ocean every 3 to 5 days.
Over the past decade, research has investigated SAL impacts on tropical cyclones.
Saharan Dust has been known to be unfavorable to TC genesis/maintenance due to:
1) African Easterly Jet (20-50 kt winds) increases environmental vertical wind shear.
2) Dry air injected into TC; promotes downdrafts in the vicinity of developing VHTs.
3) Radiative dust enhancing trade wind inversion; less potential for deep convection.
Methodology
Analyzed satellite-derived parameters from the University of Wisconsin’s Cooperative Institute for Meteorological
Satellite Studies (CIMSS) tropical archive: 24-hour Wind Shear Tendency, Deep-Layer Shear, SAL Imagery and Atlantic
IR/IR NHC-Enhanced Satellite Imagery.
Objectives
Evaluate potential relationship(s) between the Madden-Julian Oscillation and the El Nino Southern Oscillation with
respect to SAL impacts on TC structure and intensity. This work was conducted on the 96 TCs in this study.
Conclusions
MJO Wet Phases across the W. Hemisphere and E. Pacific enhance TCs via enhanced deep-layer moisture.
TC symmetry increased in the majority of cases within 12 to 24 hours after SAL influences decreased.
Future Work
Assess how the MJO may act to enhance ENSO conditions and subsequent impacts on TC intensity/structure.
Expand upon the dynamics of the MJO/ENSO relationship and implications on TC intensity changes.
Assess Saharan Dust plume concentration/origin with respect to the filamentation of Saharan Dust into TC vortices.
References
Atlantic Oceanographic & Meteorological Laboratory, Hurricane Research Division.
'TCFAQ A17) What Is The Saharan Air Layer (SAL) ?'. Aoml.noaa.gov. N.p., 2010. Web.
10 Nov. 2015.
Braun, Scott A. 'Reevaluating The Role Of The Saharan Air Layer In Atlantic Tropical
Cyclogenesis And Evolution'. Monthly Weather Review. N.p., 2009. Web. 10 Nov. 2015.
Dunion, Jason P., and Christopher S. Velden. 'THE IMPACT OF THE SAHARAN AIR LAYER
ON ATLANTIC TROPICAL CYCLONE ACTIVITY'. Journals.ametsoc.org. N.p., 2003. Web. 10
Nov. 2015.
Goldman, Jana. 'NOAA News Online (Story 2206)'. Noaanews.noaa.gov. N.p., 2004.
Web. 1 Dec. 2015.
Meted.ucar.edu,. 'Schematic Of Saharan Air Layer'. N.p., 2015. Web. 20 Nov. 2015.
Michalak, Arthur E. 'Properties And Influences Of The Saharan Air Layer On Tropical
Cyclogenesis'. Department of Physics, and Program in Atmospheric and Oceanic
Sciences. N.p., 2004. Web. 10 Nov. 2015.
Nhc.noaa.gov,. 'NHC Data Archive'. N.p., 2015. Web. 10 Nov. 2015.
University of Wisconsin (CIMSS)
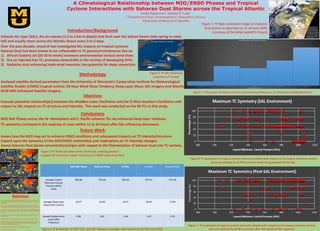
Figure 6 Scatterplot of tropical cyclone symmetry plotted with respect to the lowest minimum central
pressure attained by all 96 hurricanes while being exposed to the SAL.
Figure 7 Scatterplot of tropical cyclone symmetry plotted with respect to the lowest minimum central
pressure attained by all 96 hurricanes after the period of SAL exposure.
Figure 5 Bar graph of lowest minimum central pressure frequency (21 hPa pressure differential bins).
Figure 4 Breakdown of MCP, DLS, and ERC frequency averages with respect to the MJO and ENSO
Figure 3 Three-day time-series of the SAL tracking product
imagery for Hurricane Isabel. (courtesy of CIMSS tropical archive)
Figure 2 SAL Schematic
(courtesy of Comet)
MJO Wet Phase MJO Dry Phase El Niño La Niña Neutral-ENSO
Average Lowest
Minimum Central
Pressure (MCP)
(hPa)
969.86 976.60 965.69 973.41 974.20
Average Deep-Layer
Shear (DLS) (knots)
18.27 18.40 19.23 18.59 17.94
Eyewall Replacement
Cycle (ERC)
Frequency
0.98 0.87 1.08 1.09 0.78
Figure 1 High-resolution image of a Saharan
Dust plume as observed on 12 January 2000.
(courtesy of the NASA SeaWiFS Project)