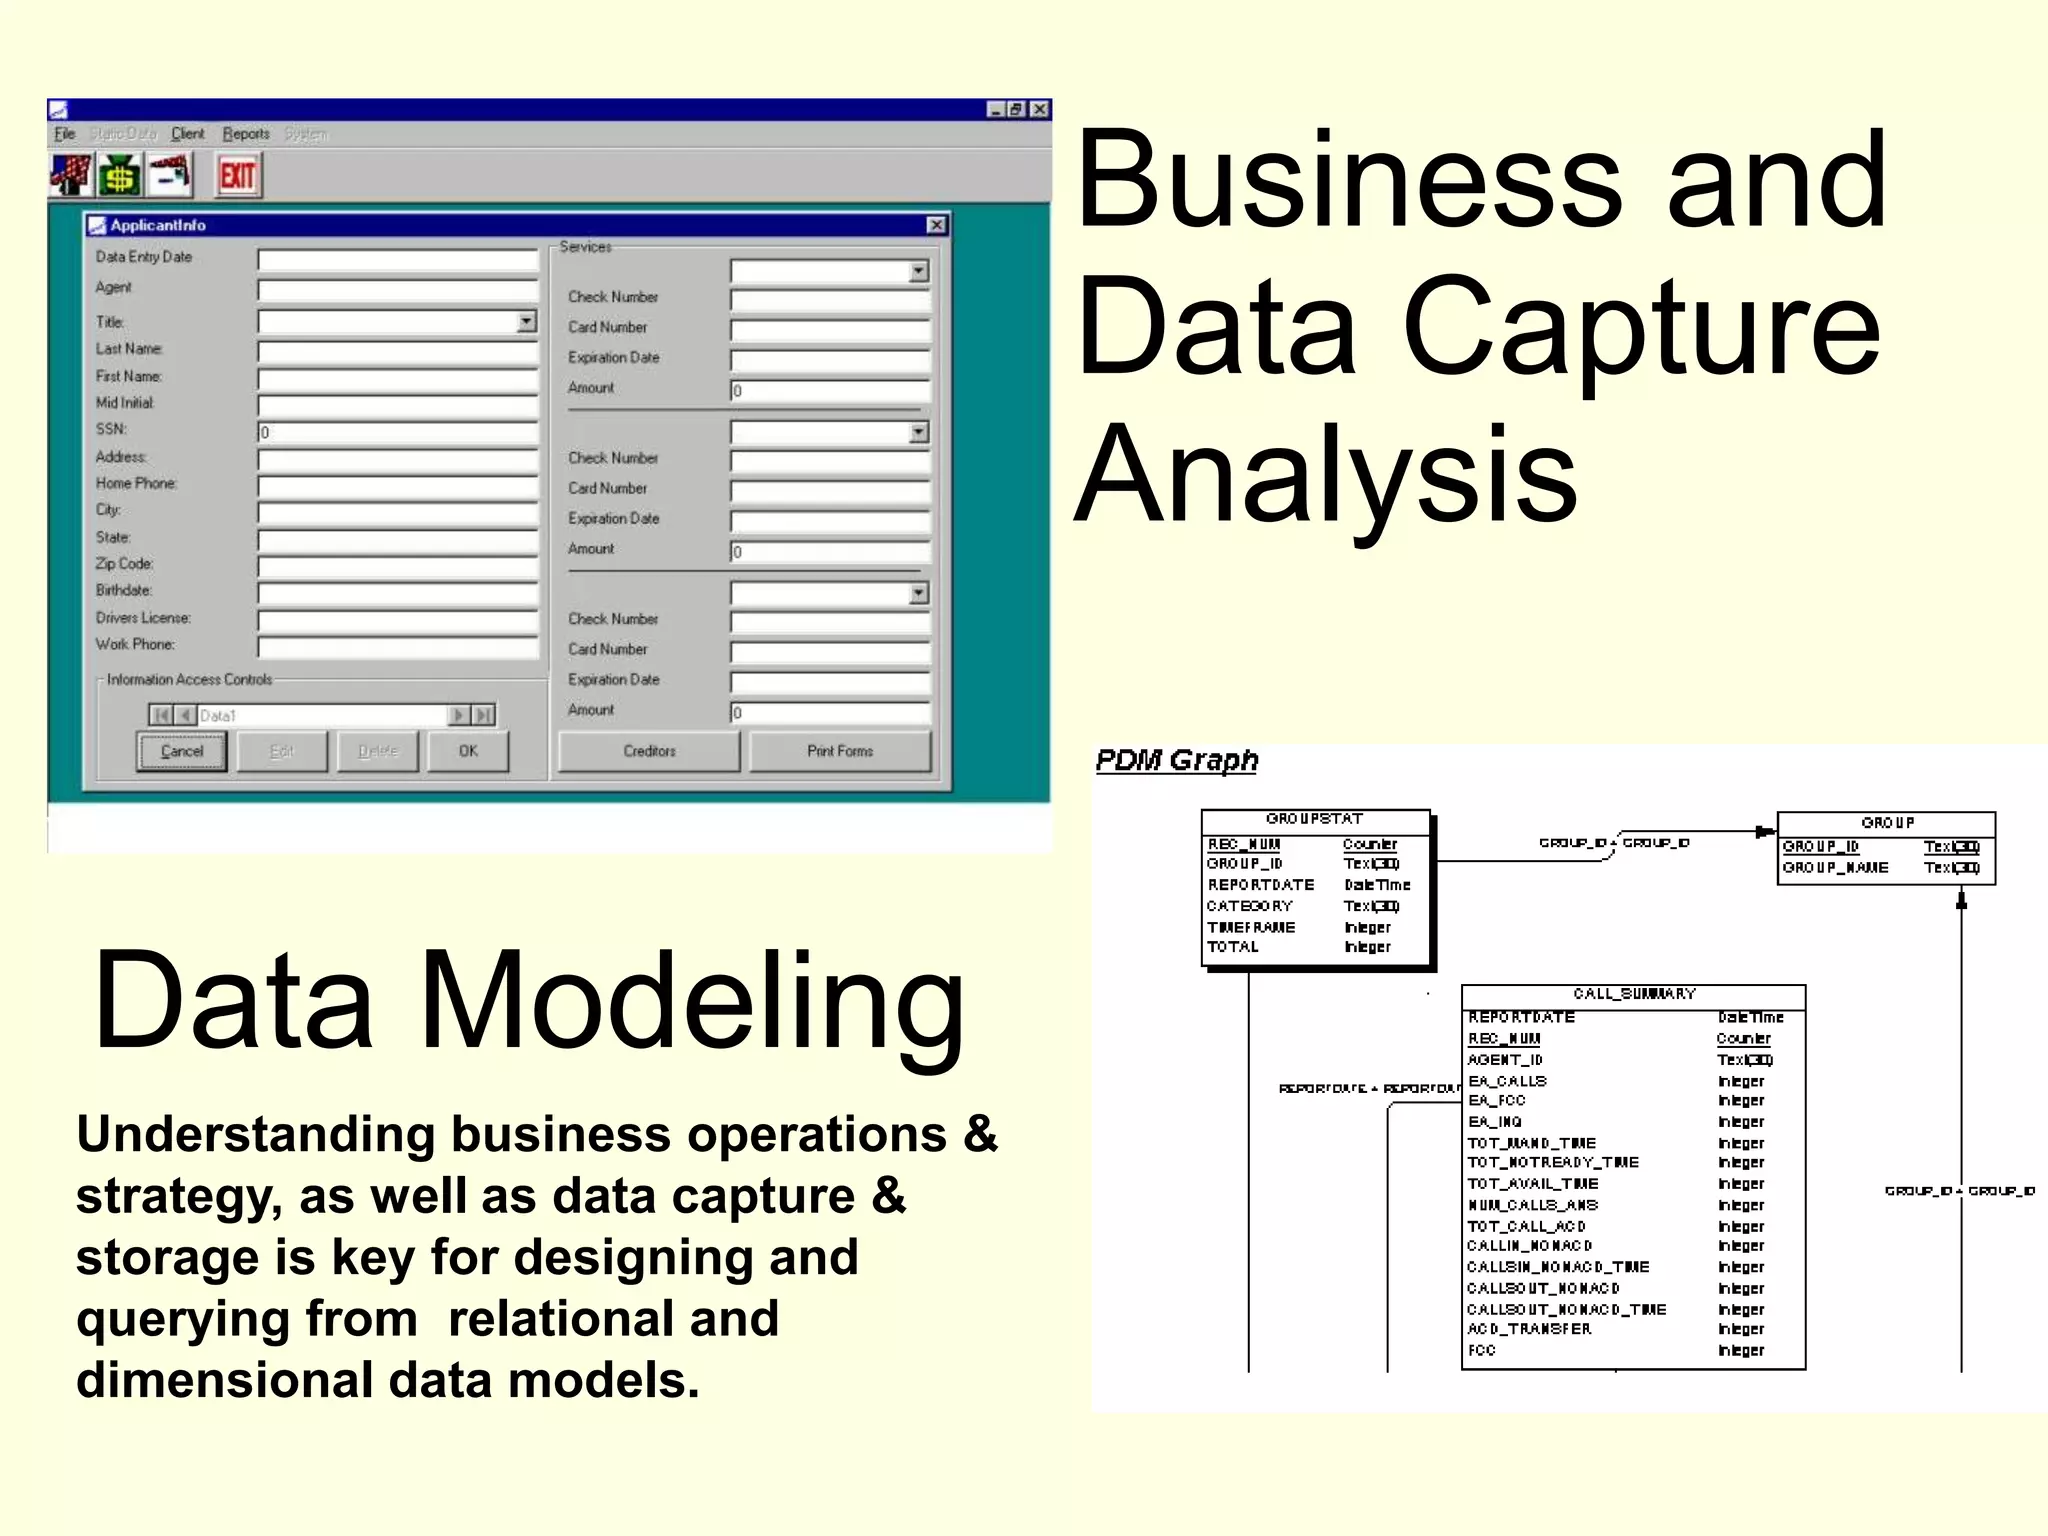
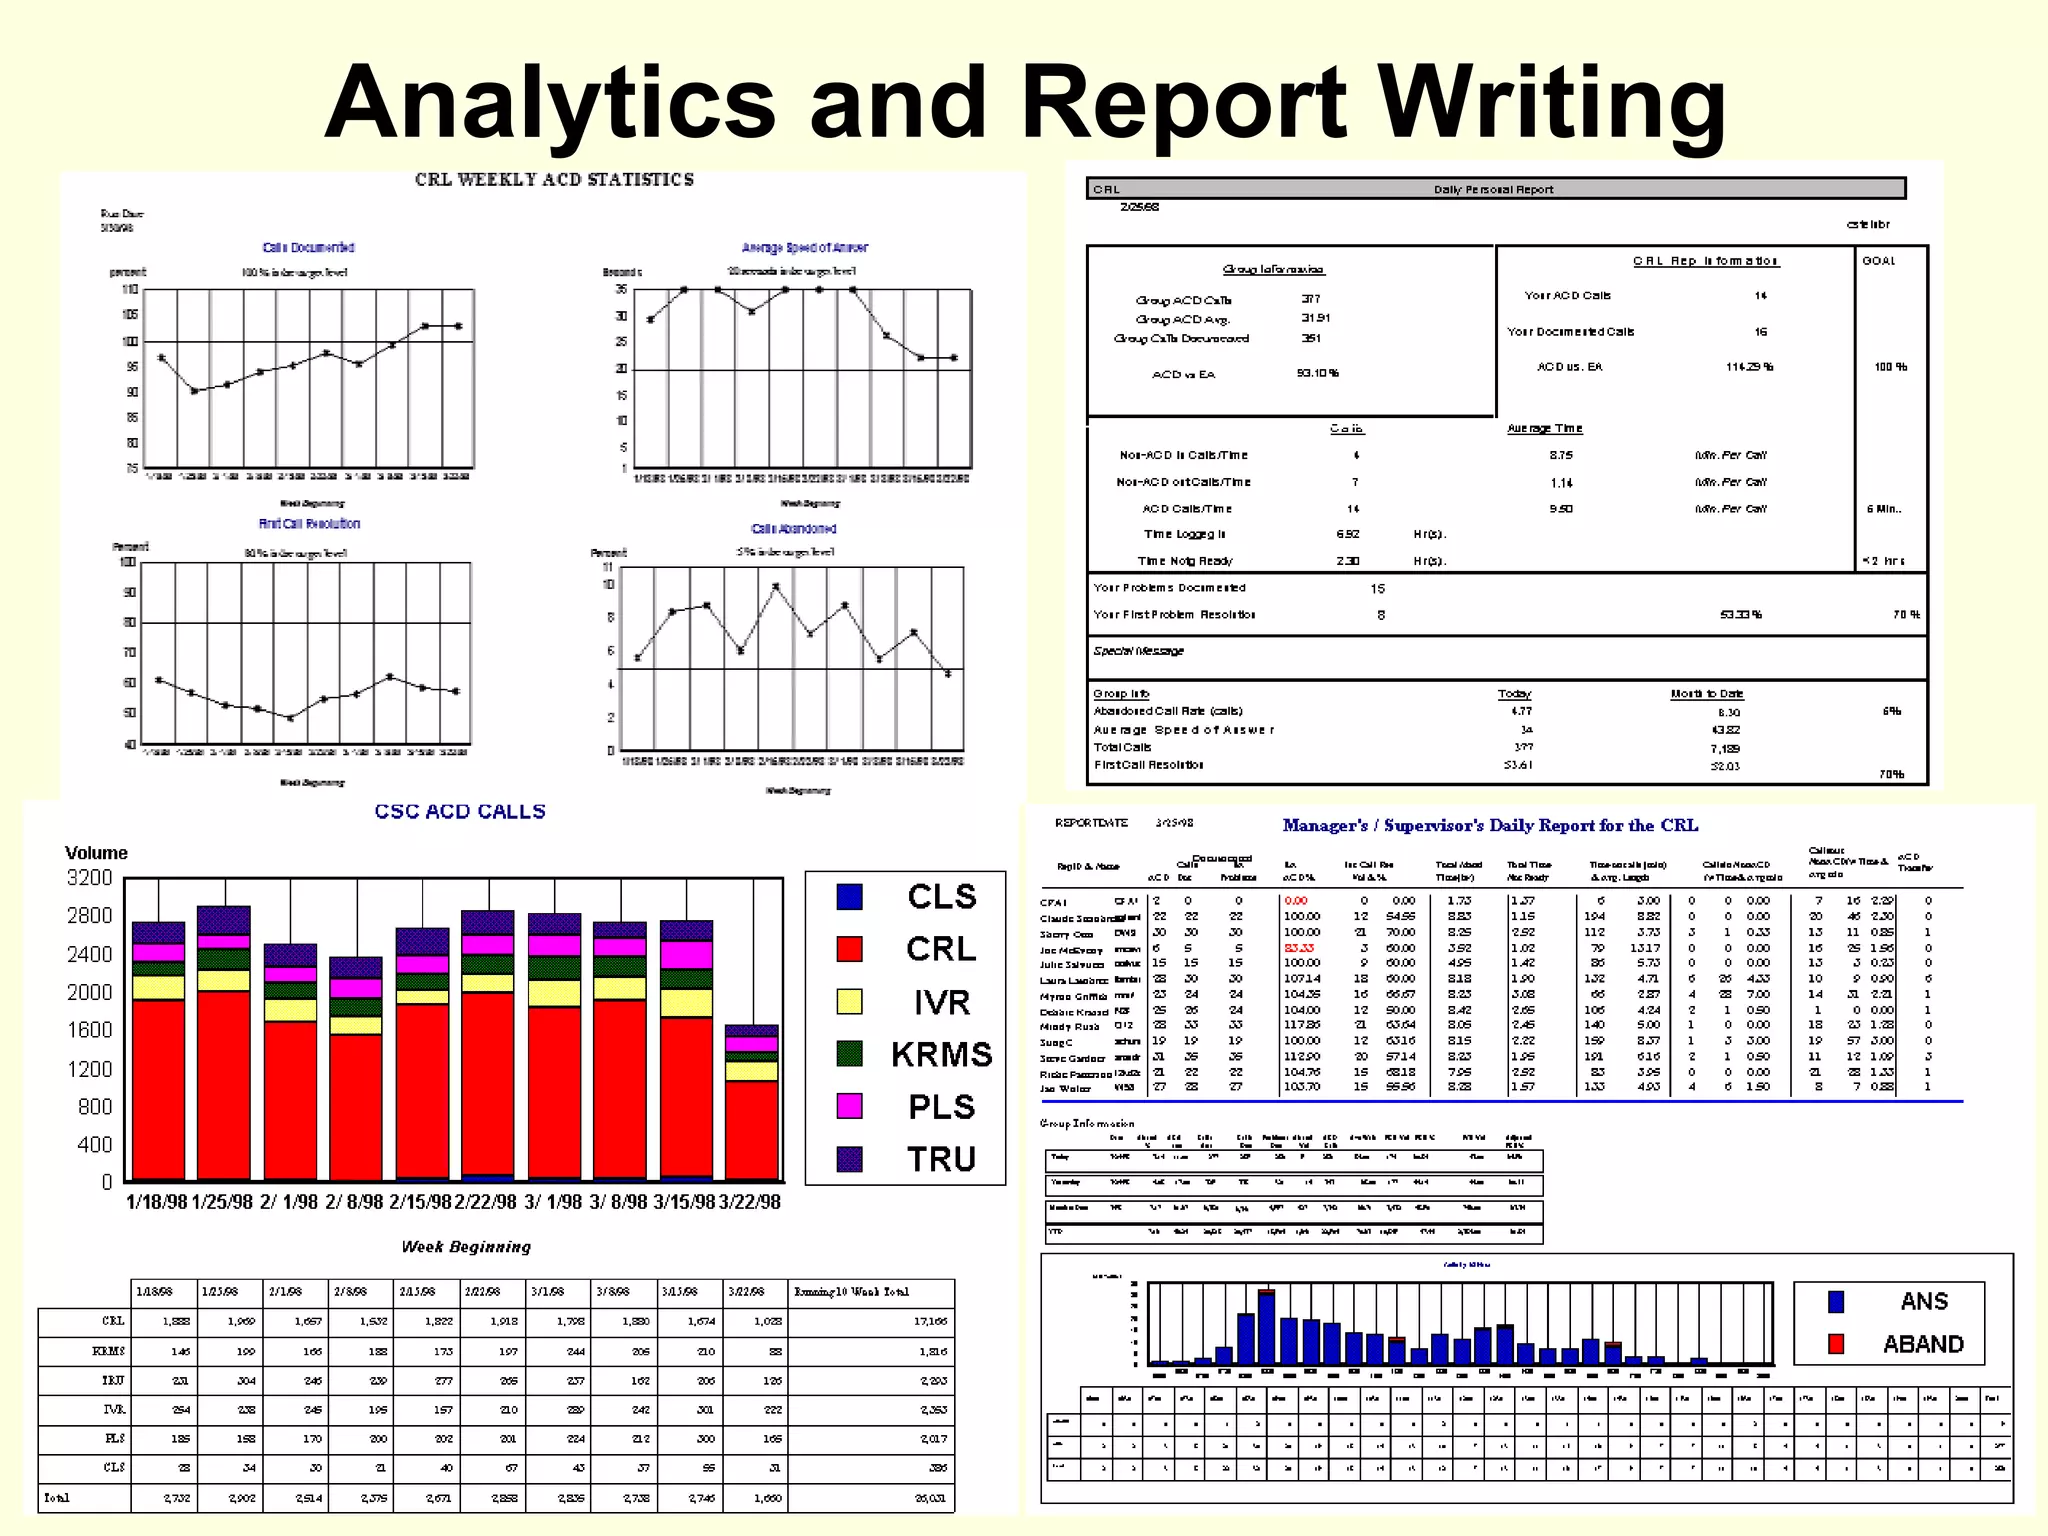
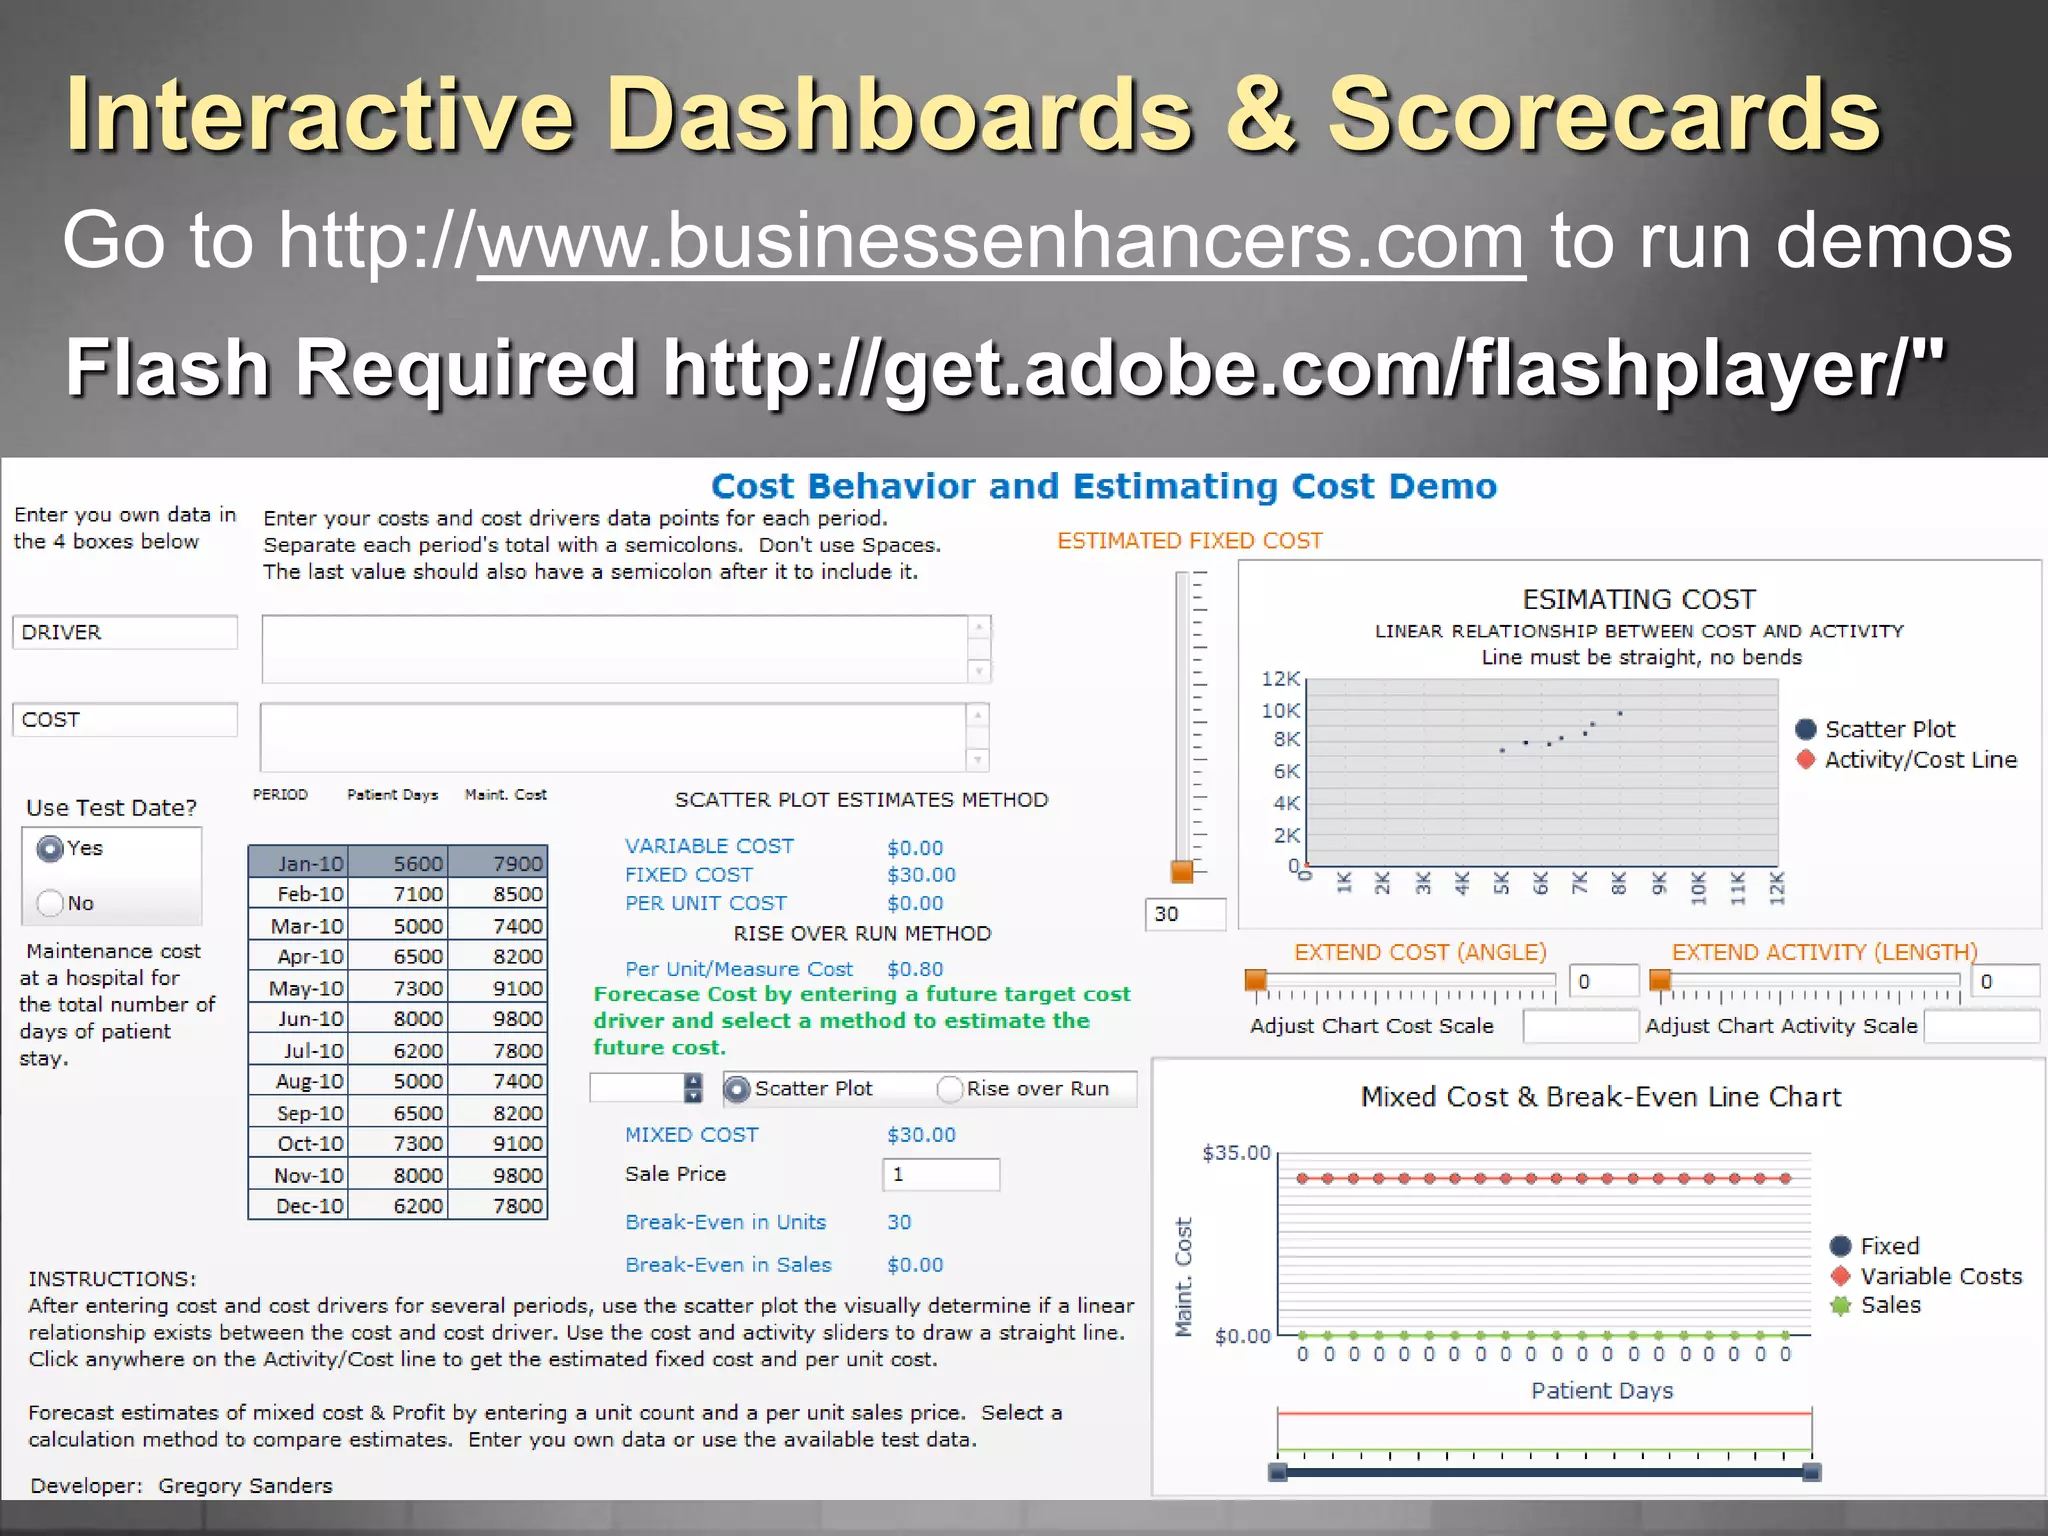
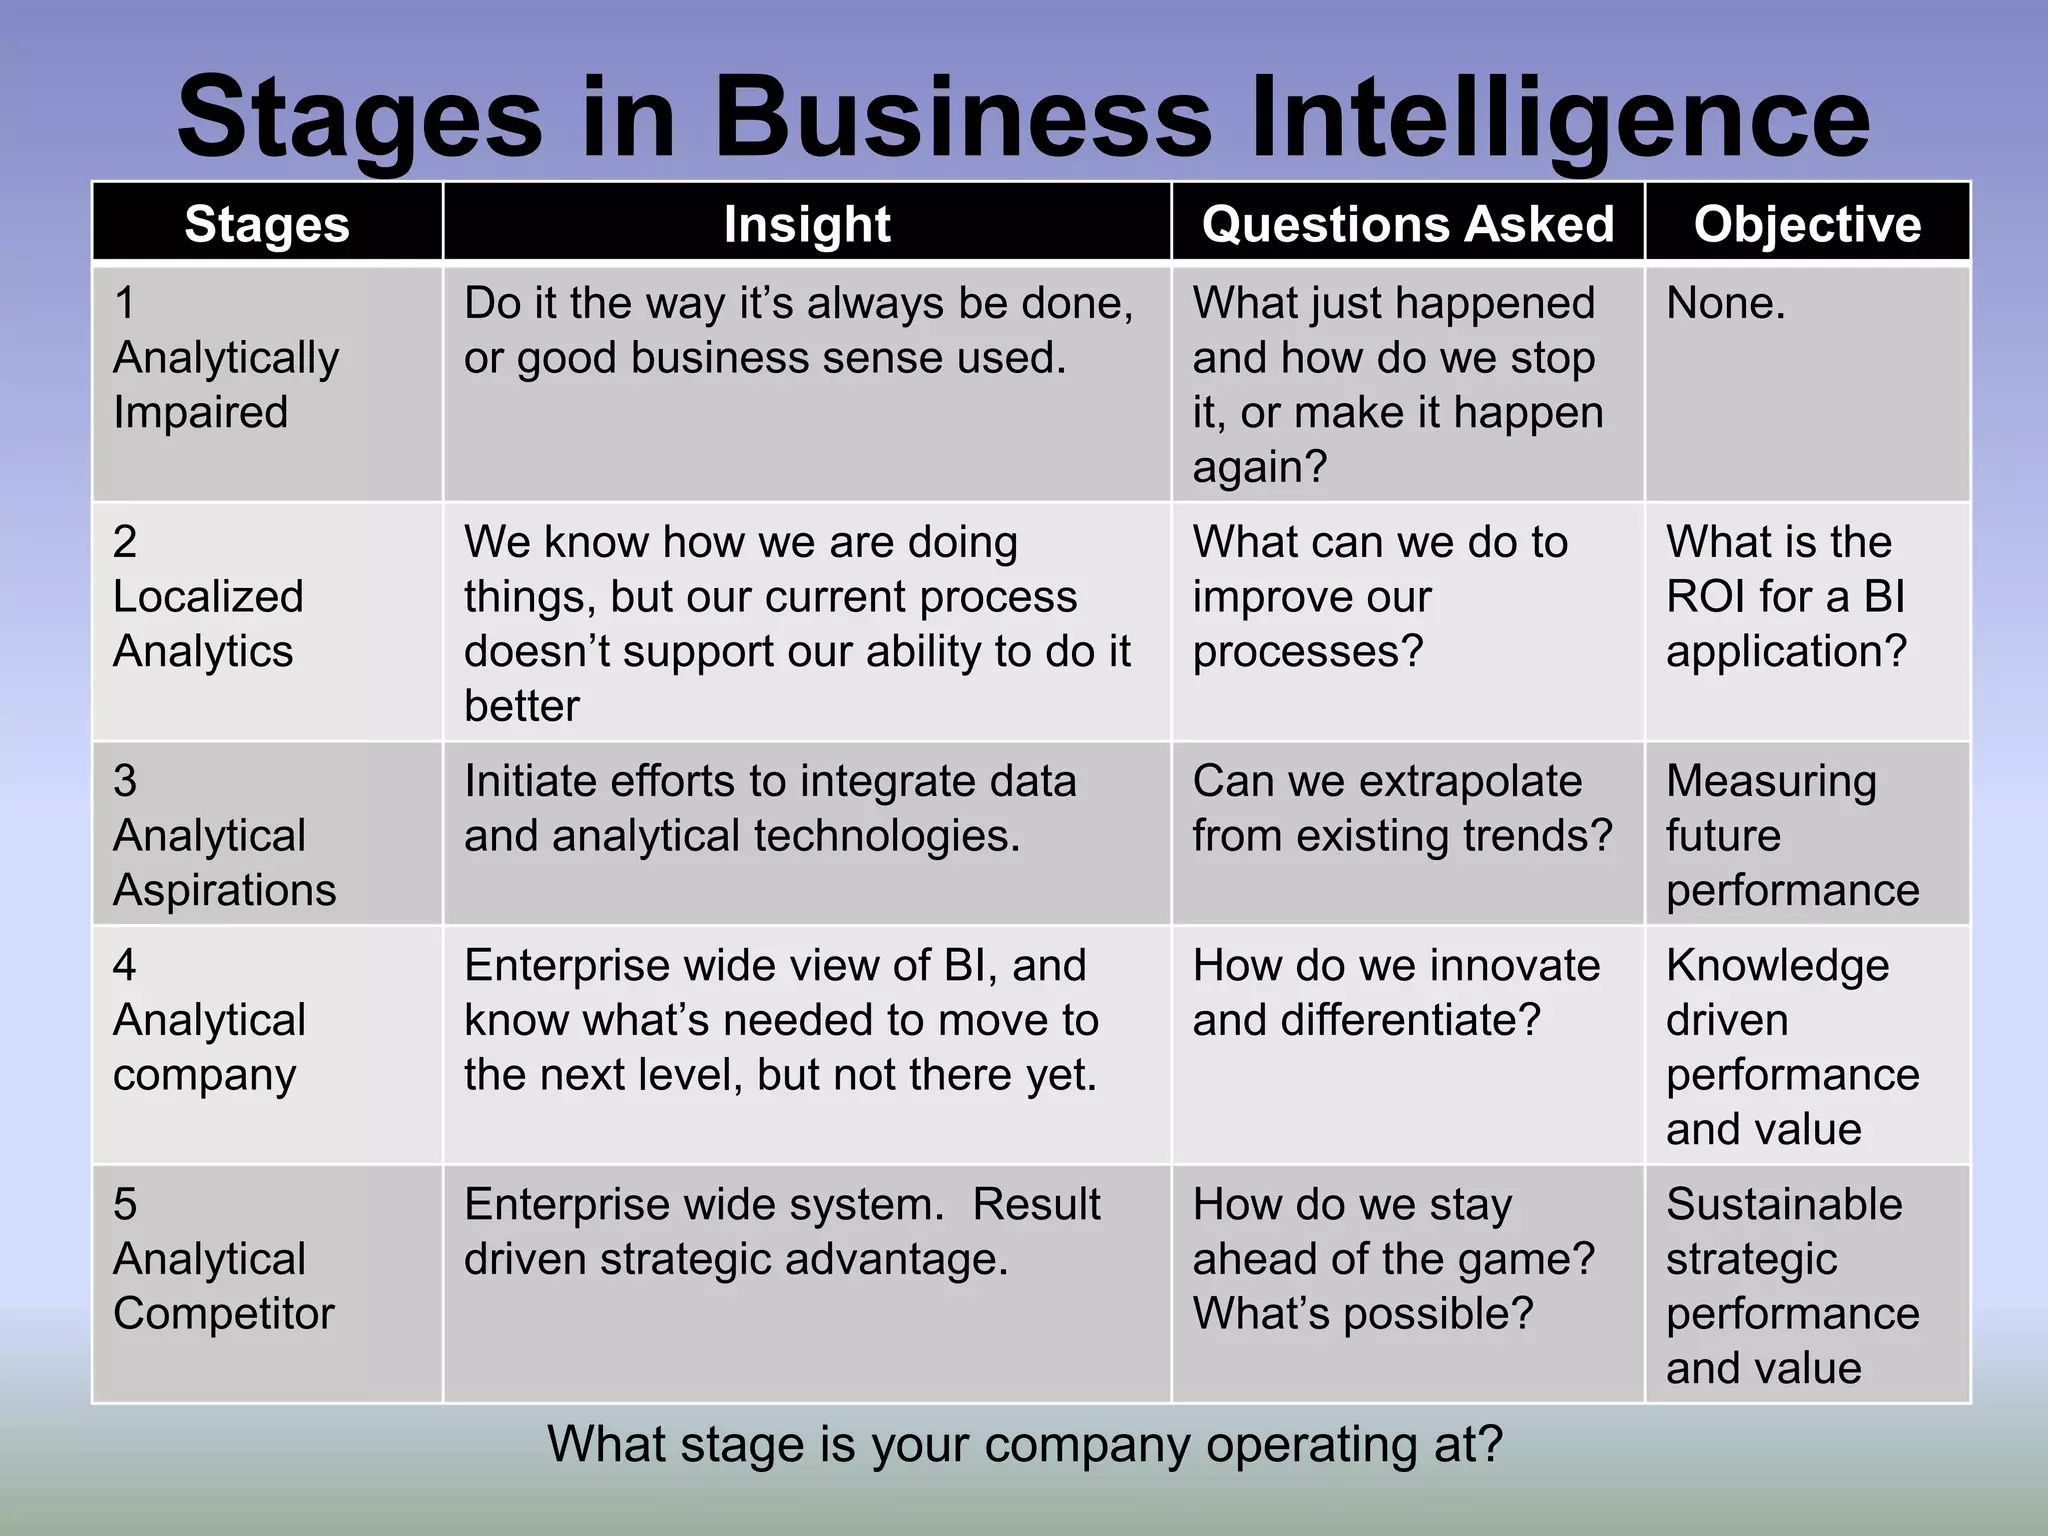
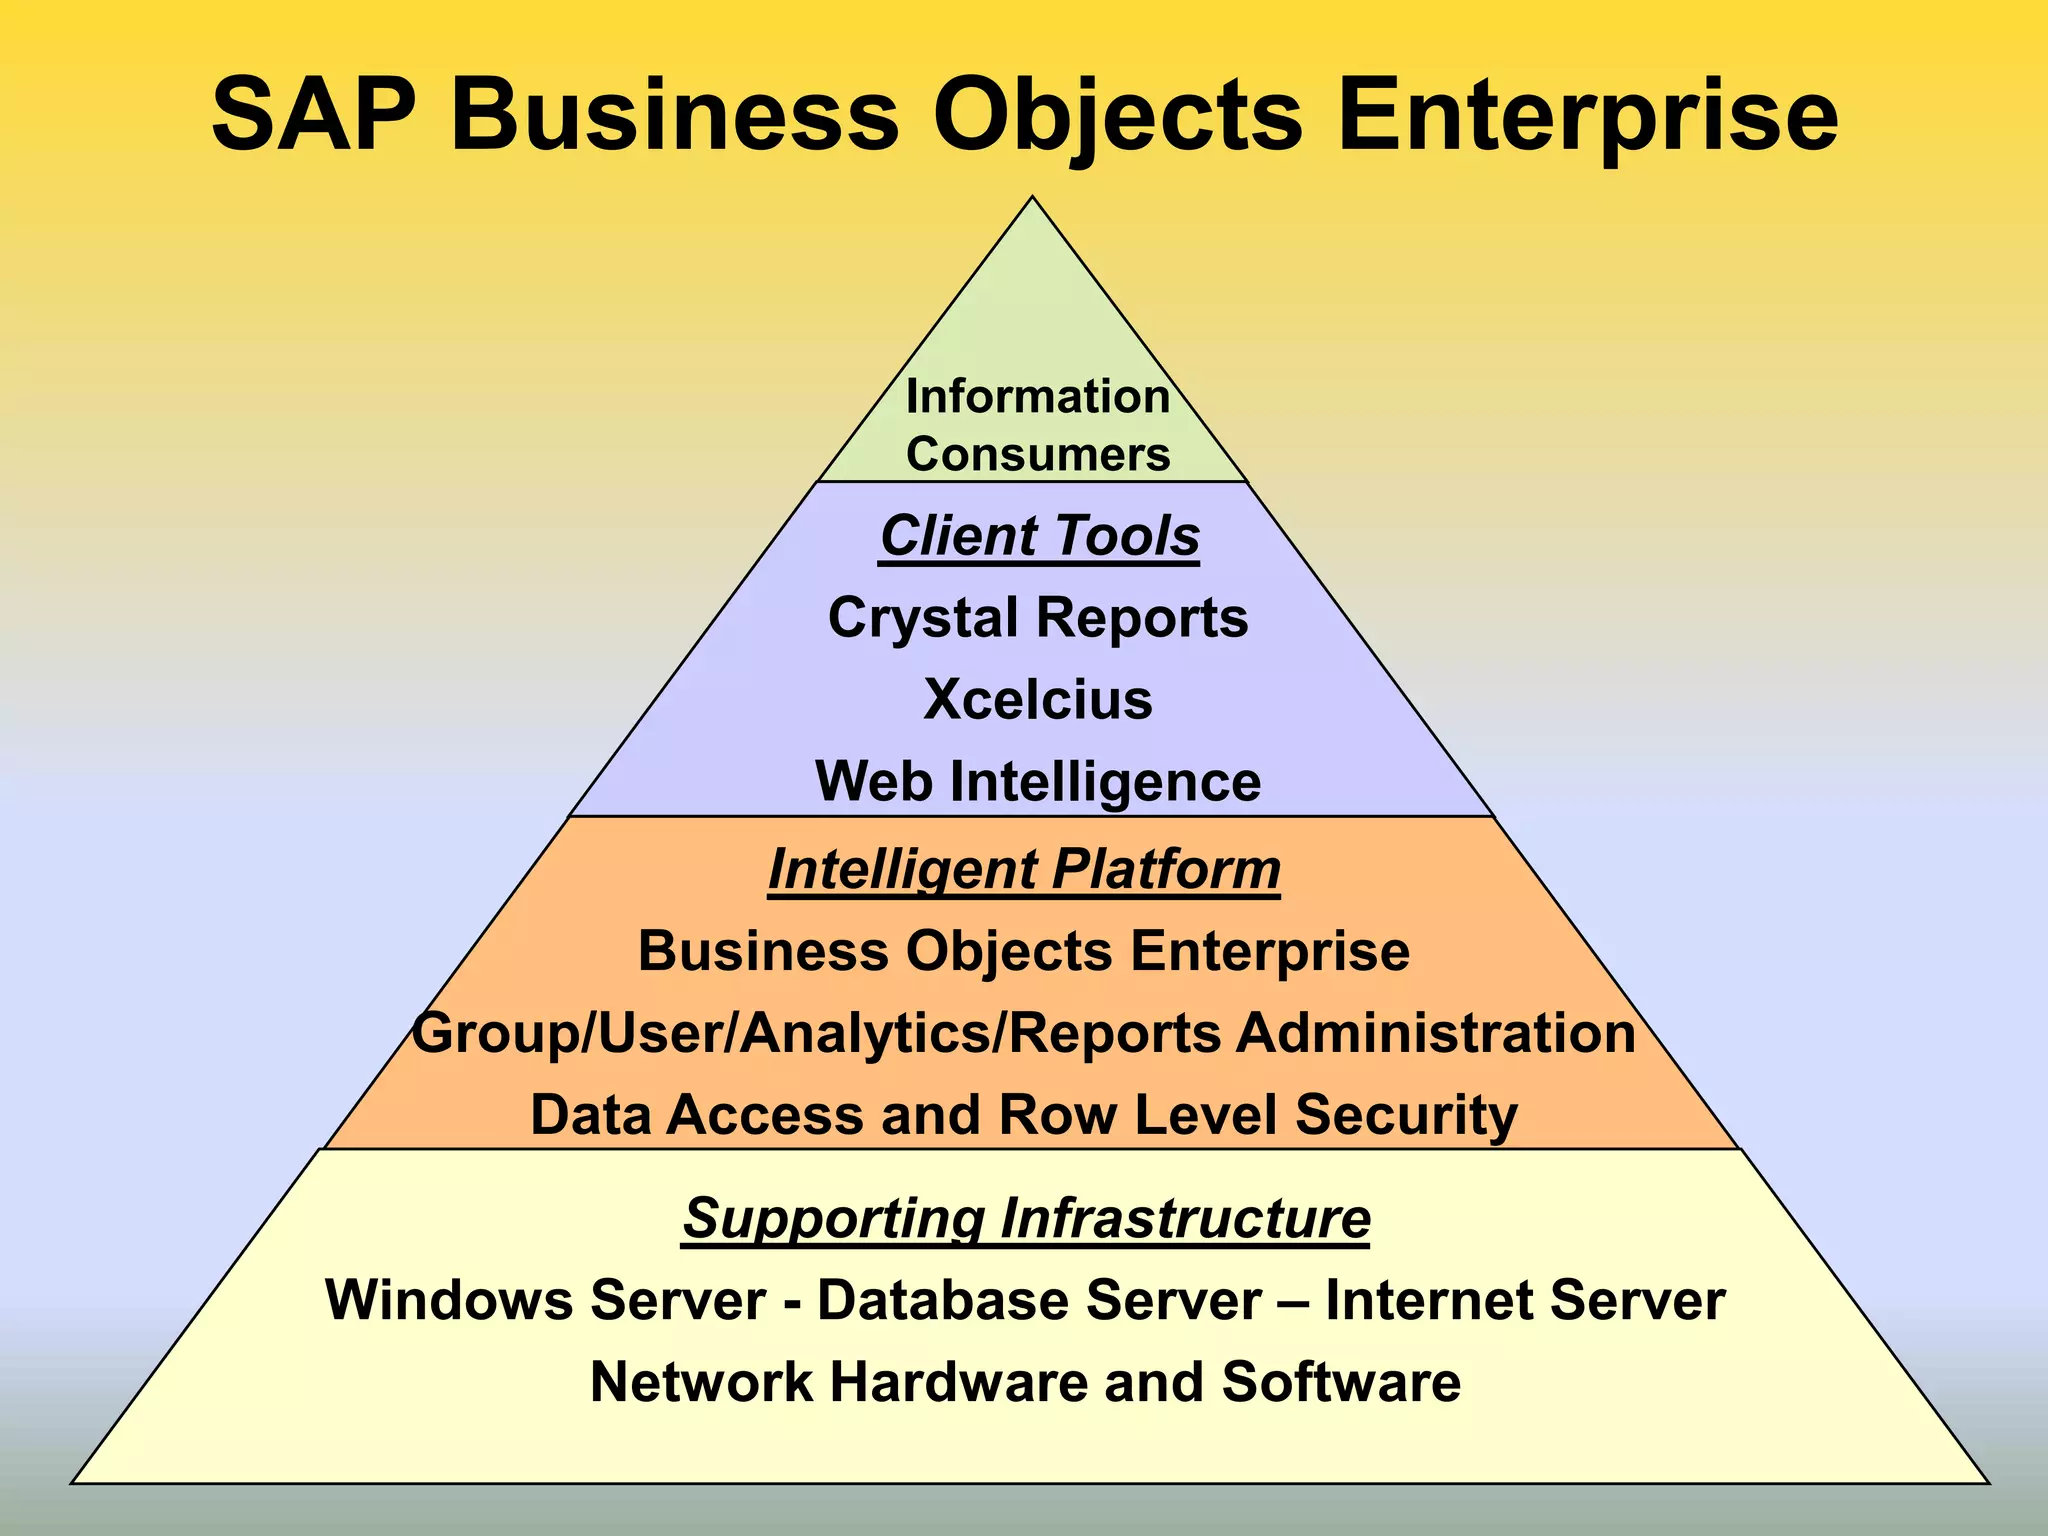
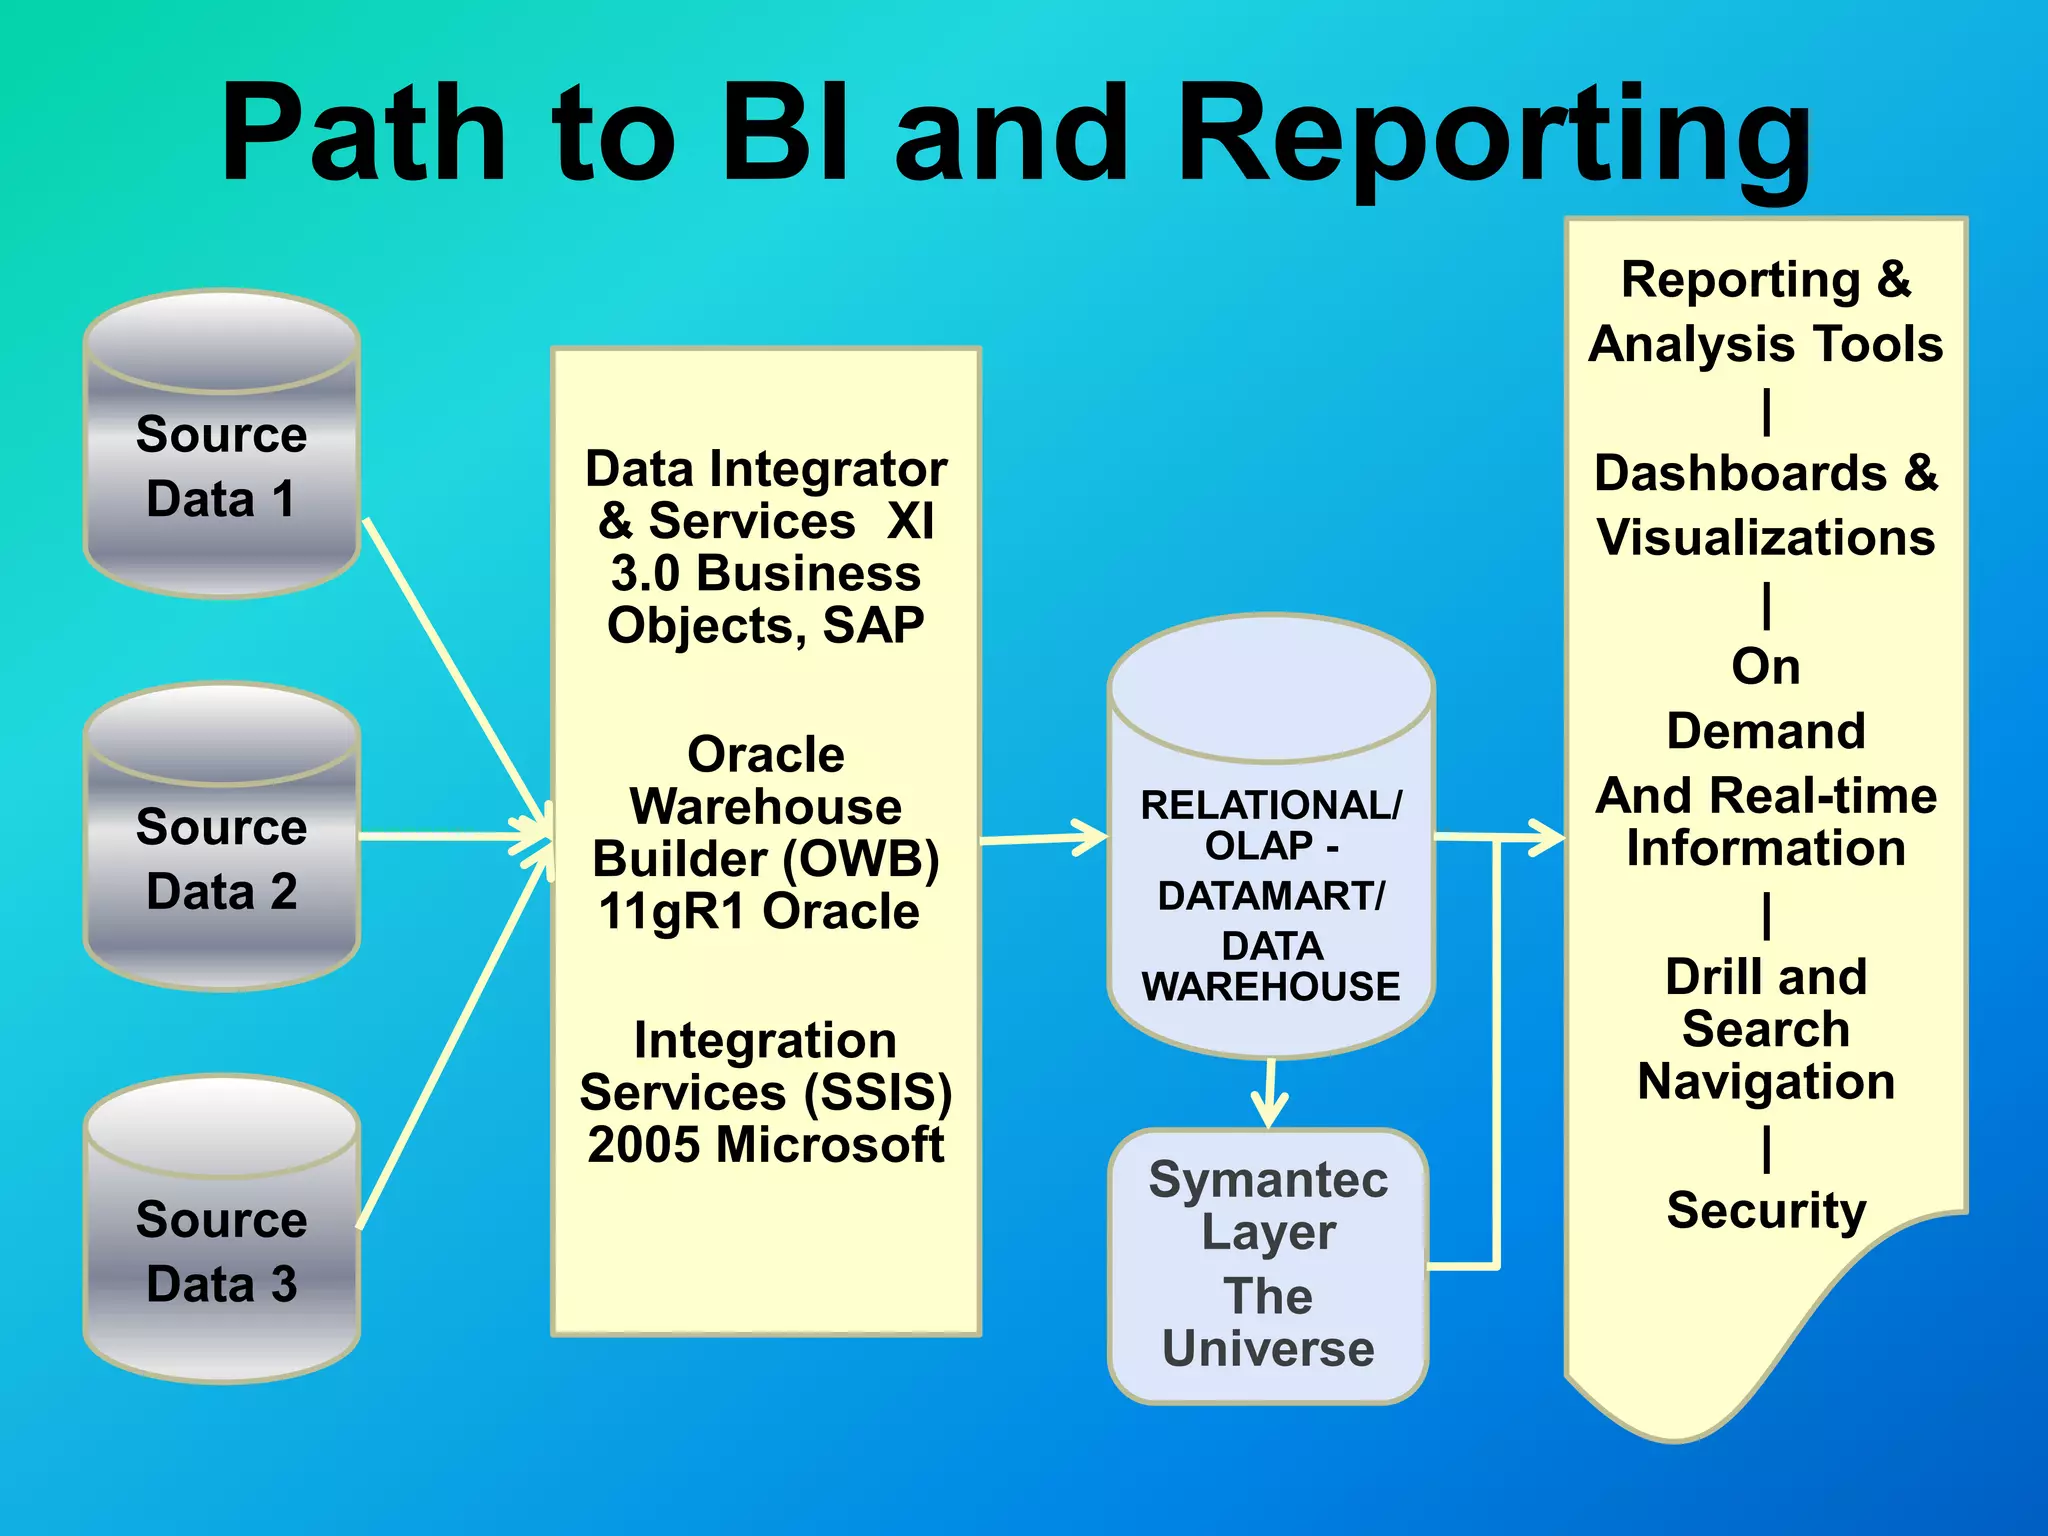
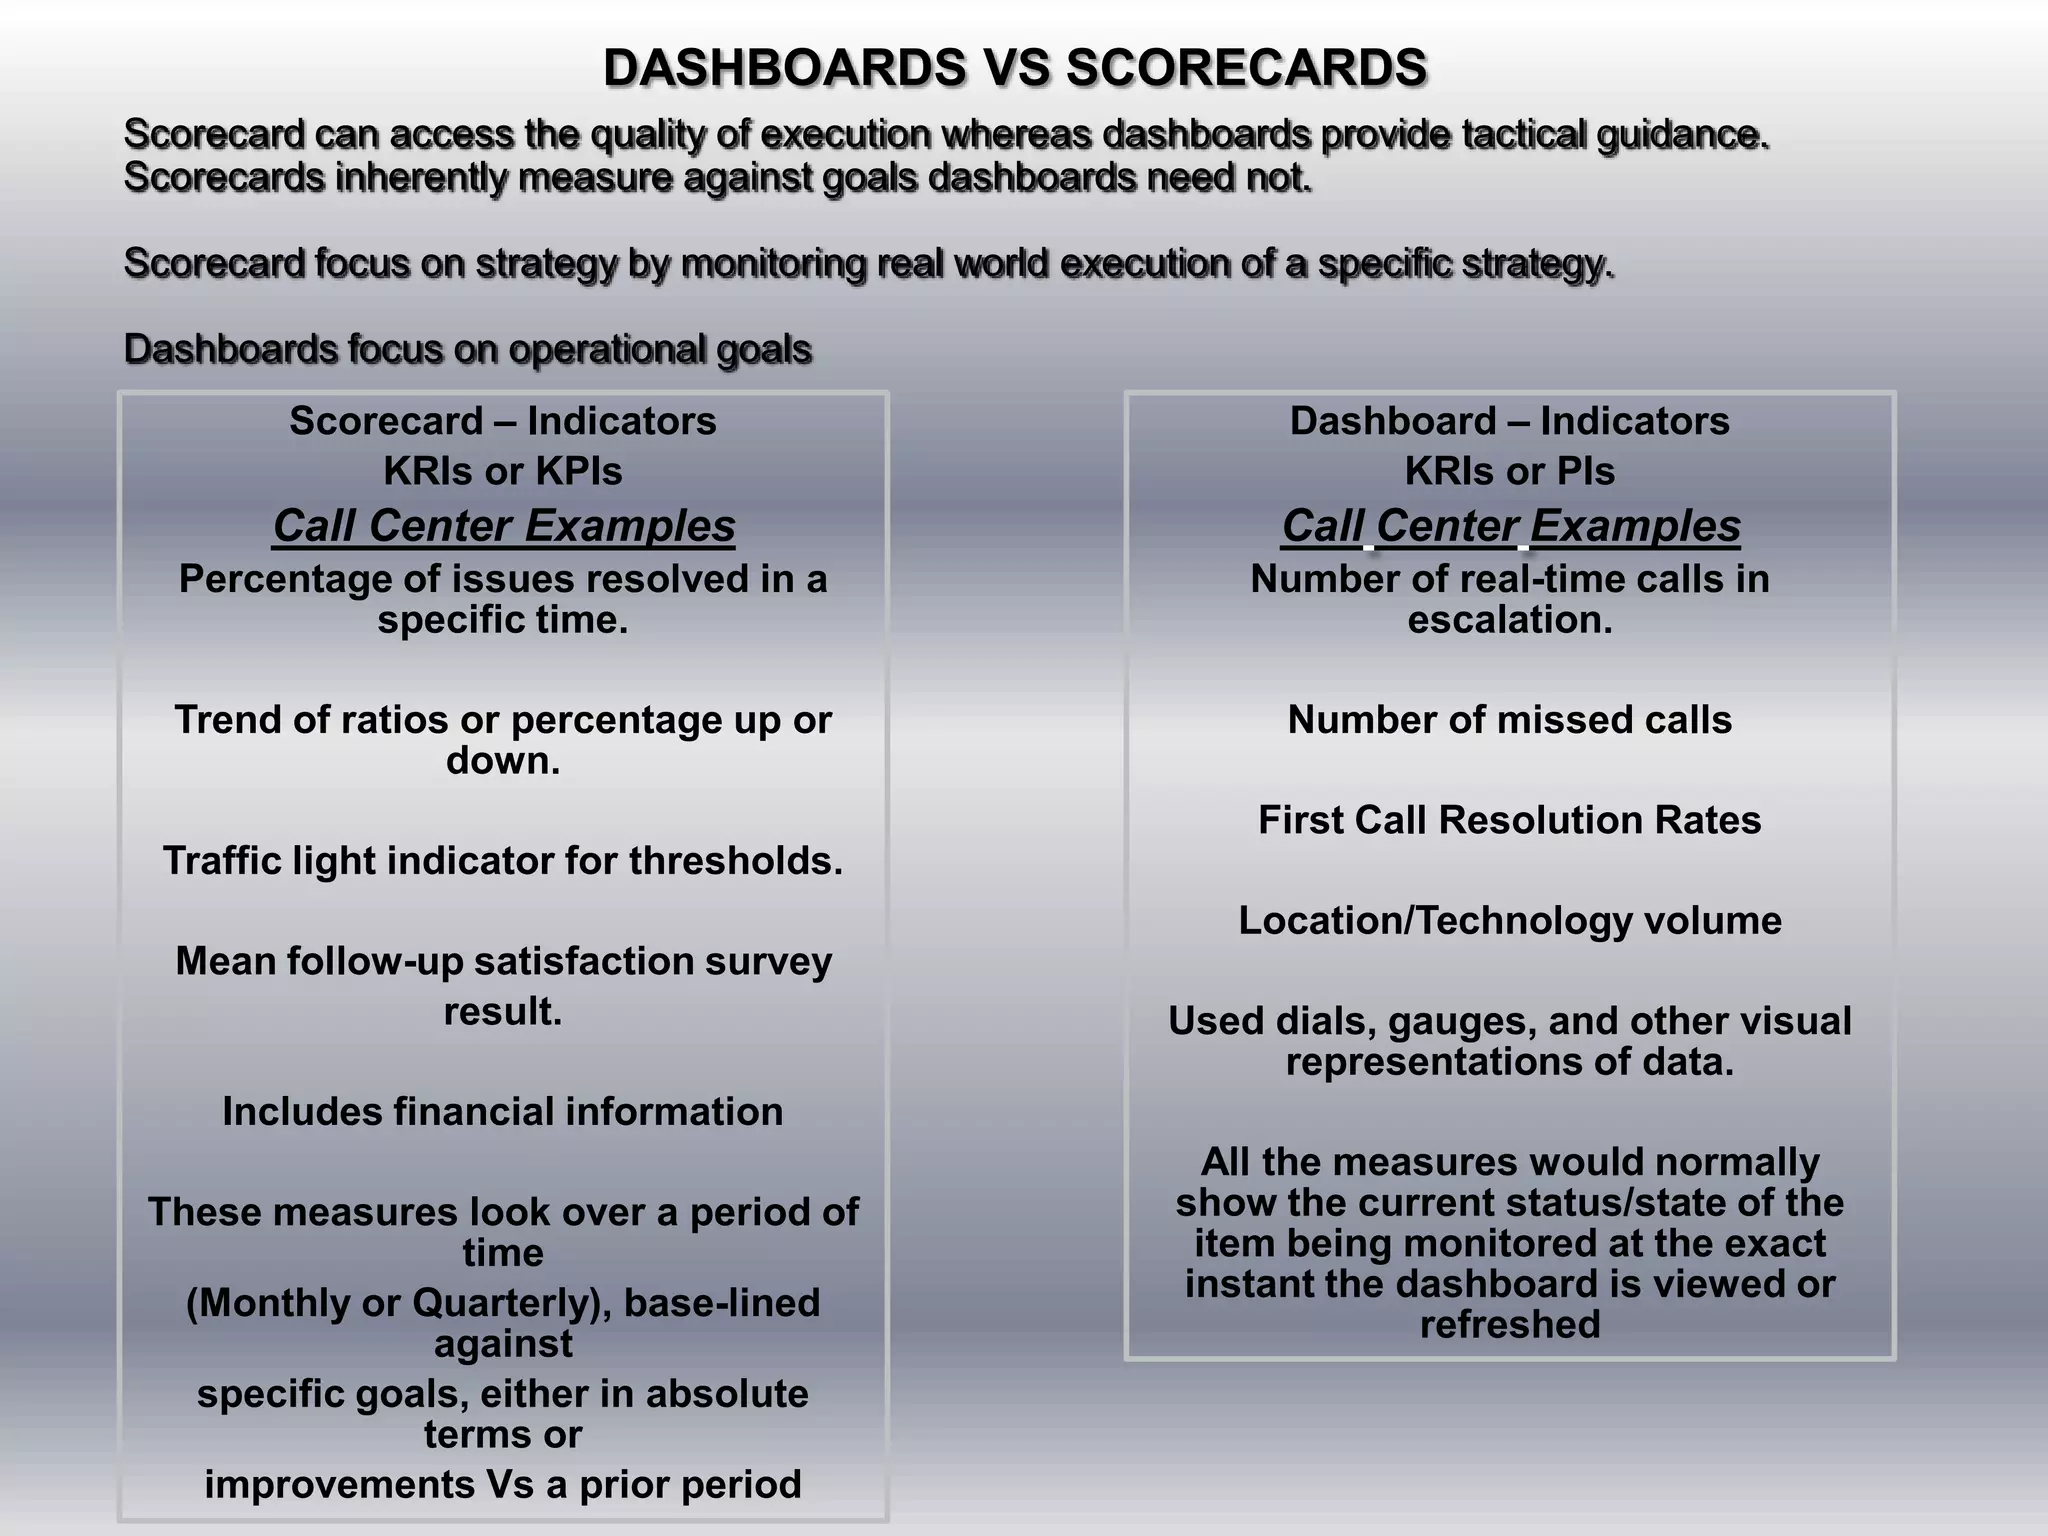
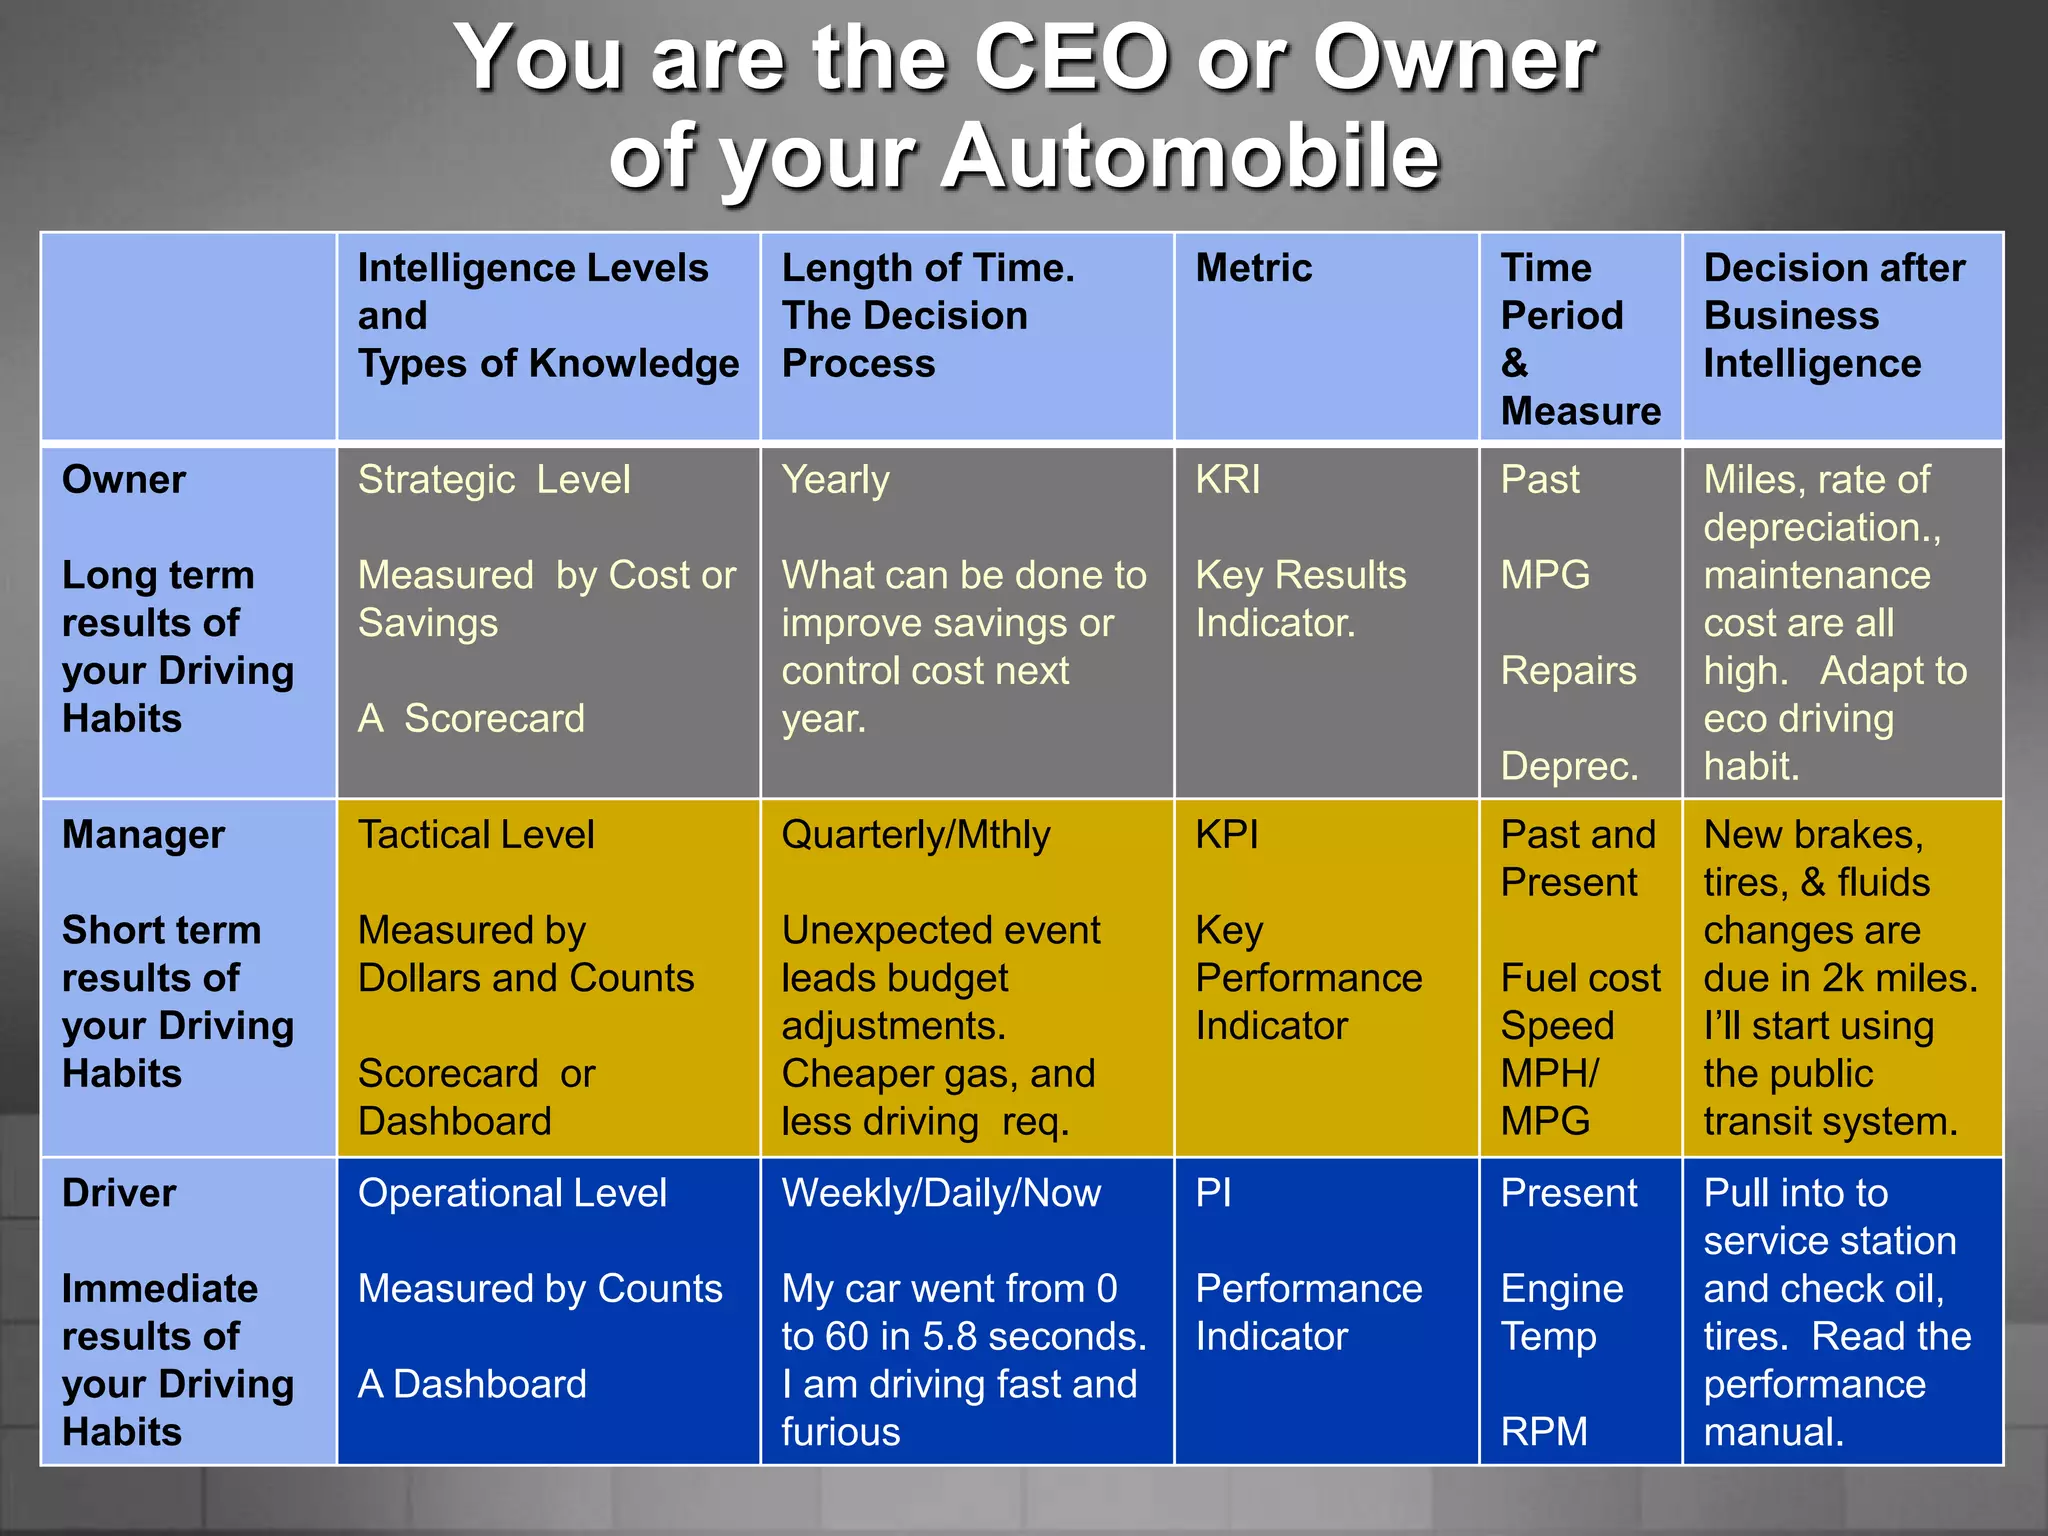
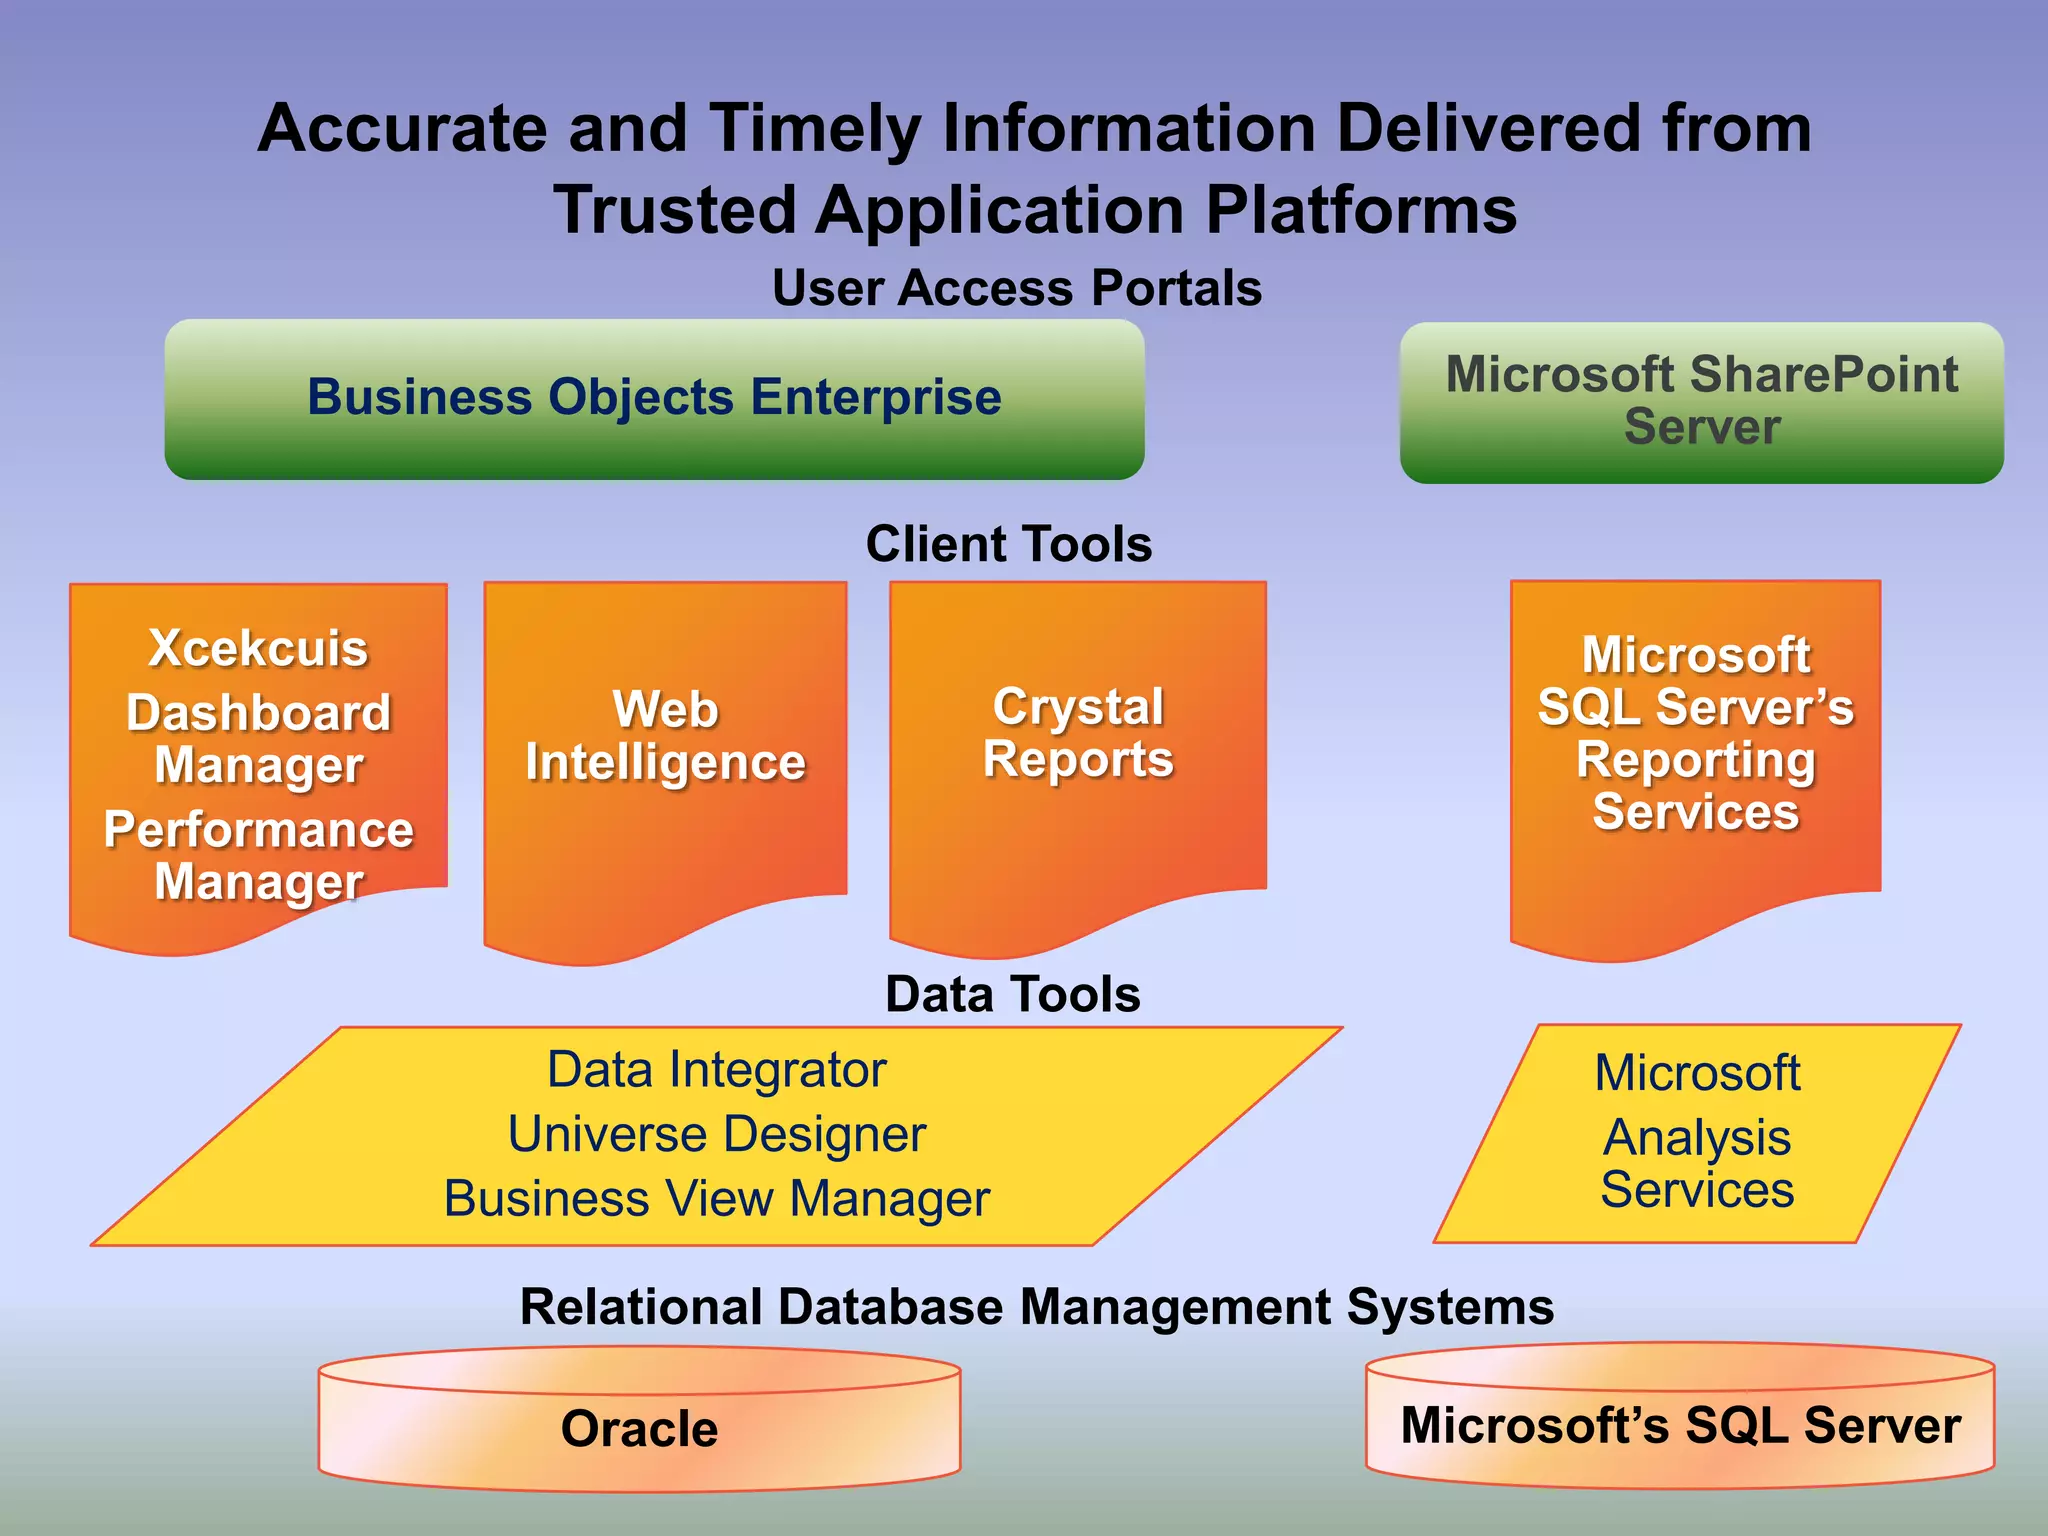
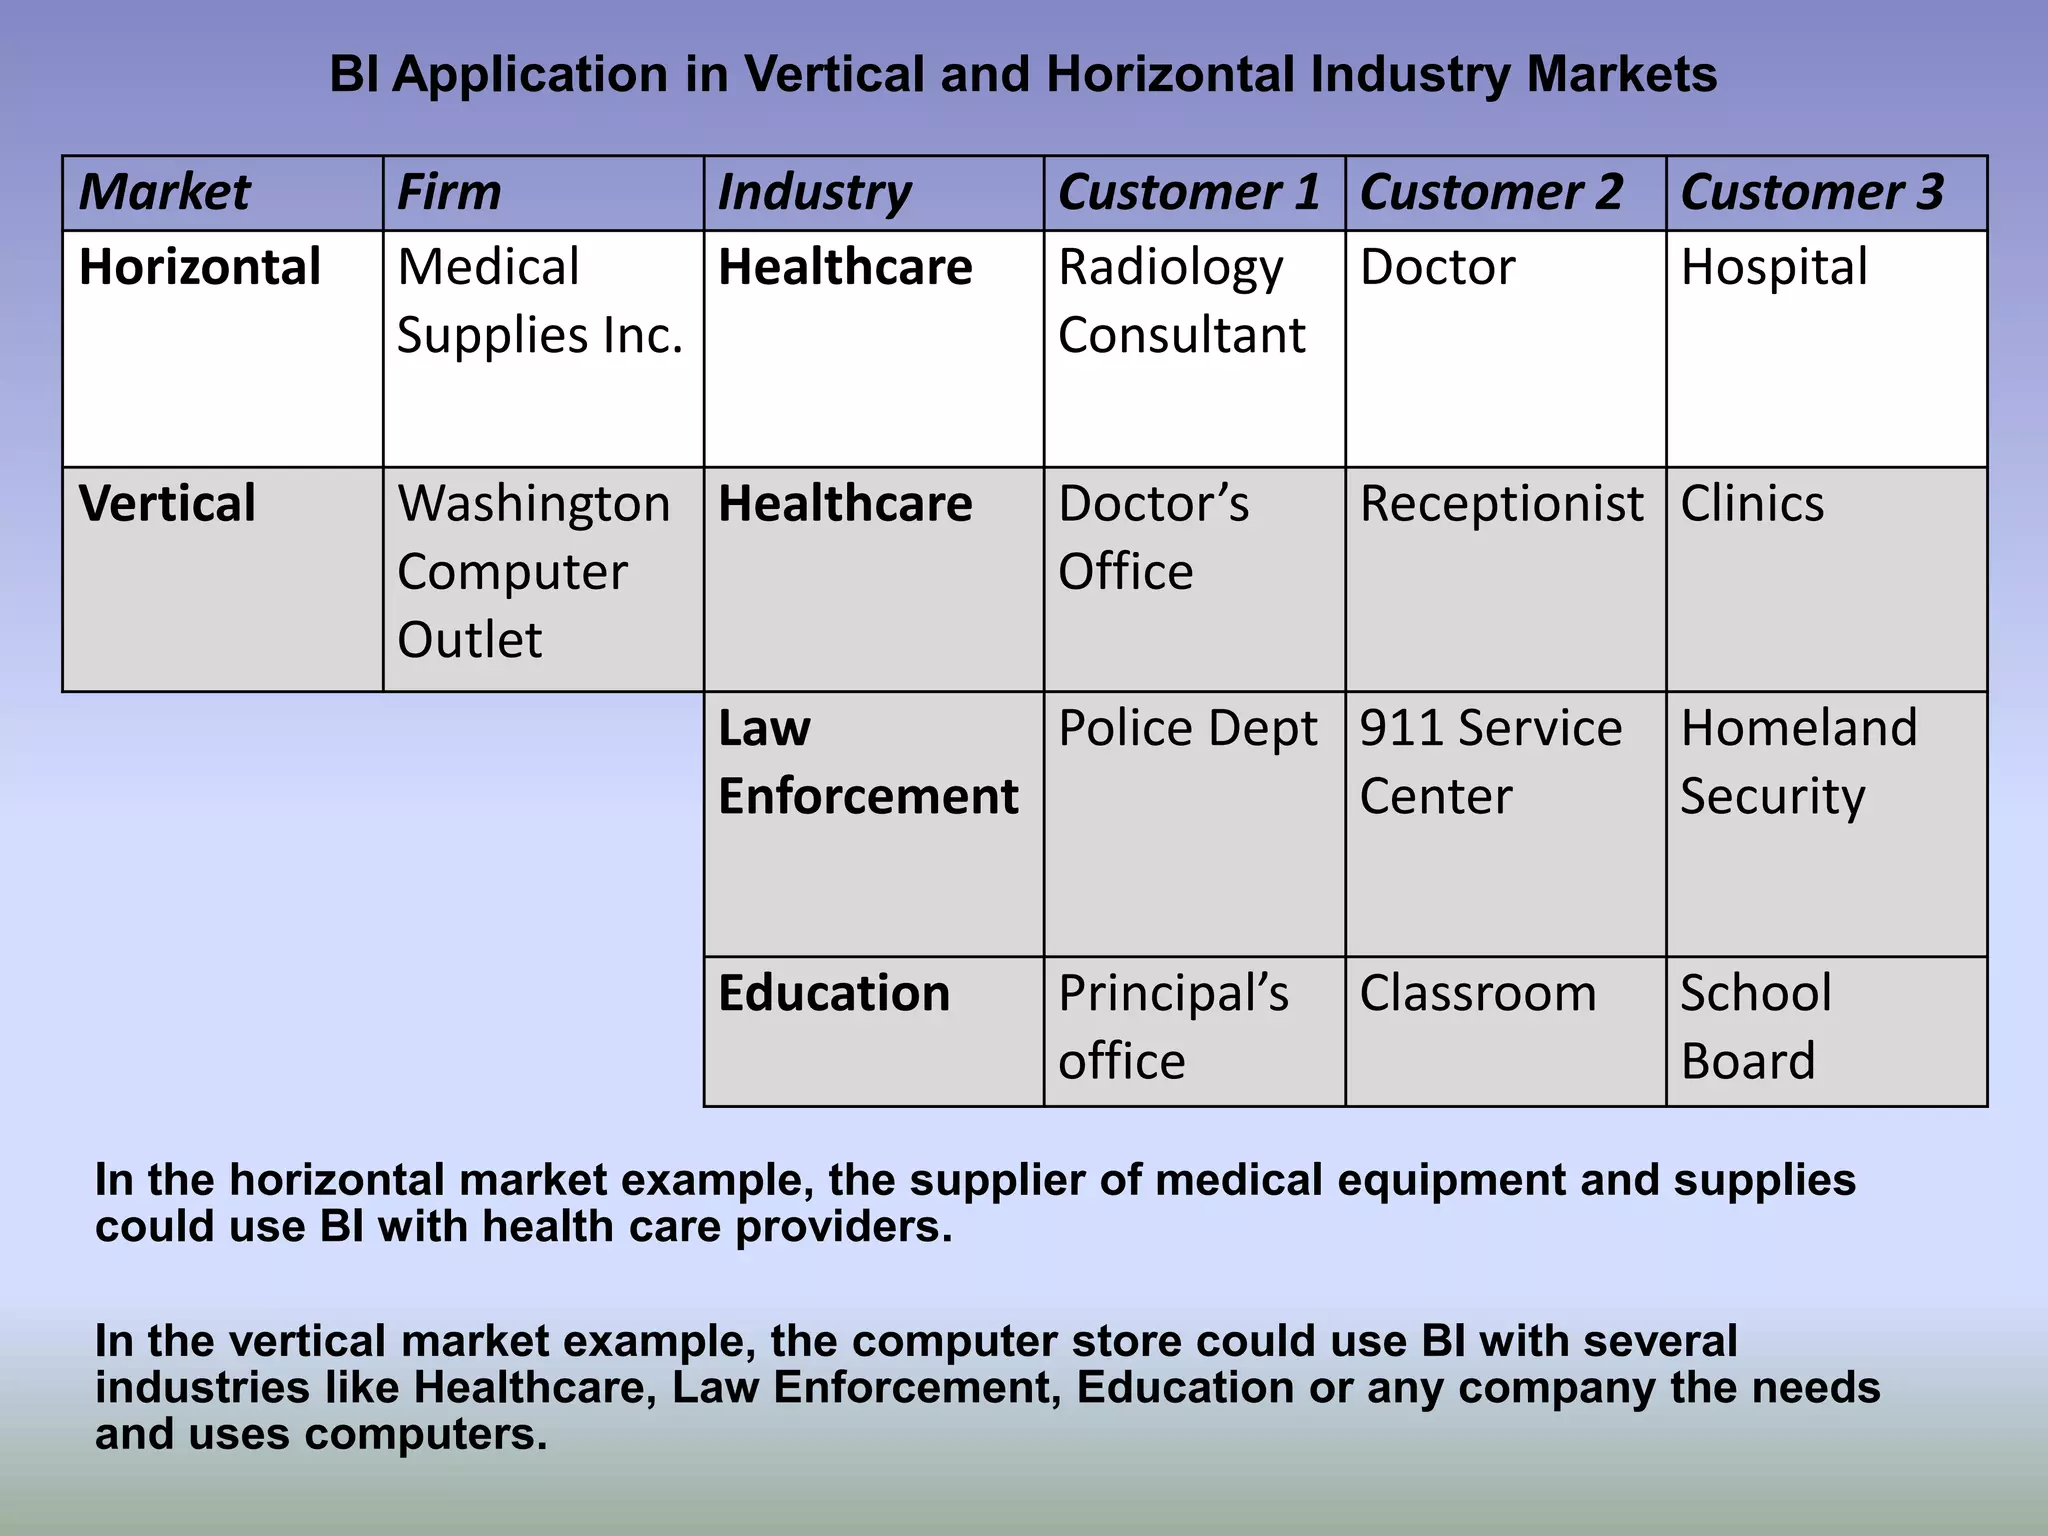
Developed by:
       Business Enhancers Inc.
       Where success is promoted.
       360-831-9133


 Business Intelligence Components,
     Concepts, and Processes
Business Intelligence, Decision Support
              & Analytics
Business and
                                      Data Capture
                                      Analysis


Data Modeling
Understanding business operations &
strategy, as well as data capture &
storage is key for designing and
querying from relational and
dimensional data models.
Analytics and Report Writing
Interactive Dashboards & Scorecards
Go to http://www.businessenhancers.com to run demos
Flash Required http://get.adobe.com/flashplayer/"
Stages in Business Intelligence
   Stages                    Insight                  Questions Asked          Objective
1              Do it the way it’s always be done,     What just happened      None.
Analytically   or good business sense used.           and how do we stop
Impaired                                              it, or make it happen
                                                      again?
2              We know how we are doing               What can we do to       What is the
Localized      things, but our current process        improve our             ROI for a BI
Analytics      doesn’t support our ability to do it   processes?              application?
               better
3              Initiate efforts to integrate data     Can we extrapolate      Measuring
Analytical     and analytical technologies.           from existing trends?   future
Aspirations                                                                   performance
4              Enterprise wide view of BI, and        How do we innovate      Knowledge
Analytical     know what’s needed to move to          and differentiate?      driven
company        the next level, but not there yet.                             performance
                                                                              and value
5              Enterprise wide system. Result         How do we stay          Sustainable
Analytical     driven strategic advantage.            ahead of the game?      strategic
Competitor                                            What’s possible?        performance
                                                                              and value
                   What stage is your company operating at?
SAP Business Objects Enterprise

                      Information
                      Consumers
                    Client Tools
                   Crystal Reports
                      Xcelcius
                   Web Intelligence
                 Intelligent Platform
            Business Objects Enterprise
     Group/User/Analytics/Reports Administration
         Data Access and Row Level Security
             Supporting Infrastructure
  Windows Server - Database Server – Internet Server
          Network Hardware and Software
Path to BI and Reporting
                                          Reporting &
                                         Analysis Tools
                                                 |
Source
         Data Integrator                 Dashboards &
Data 1   & Services XI                   Visualizations
          3.0 Business
          Objects, SAP                           |
                                               On
             Oracle                         Demand
          Warehouse        RELATIONAL/   And Real-time
Source                        OLAP -      Information
         Builder (OWB)
Data 2   11gR1 Oracle       DATAMART/            |
                               DATA
                           WAREHOUSE        Drill and
           Integration                       Search
         Services (SSIS)                   Navigation
         2005 Microsoft                          |
                           Symantec
Source                       Layer          Security
Data 3                        The
                           Universe
DASHBOARDS VS SCORECARDS
Scorecard can access the quality of execution whereas dashboards provide tactical guidance.
Scorecards inherently measure against goals dashboards need not.

Scorecard focus on strategy by monitoring real world execution of a specific strategy.

Dashboards focus on operational goals
         Scorecard – Indicators                                    Dashboard – Indicators
             KRIs or KPIs                                               KRIs or PIs
        Call Center Examples                                      Call Center Examples
   Percentage of issues resolved in a                           Number of real-time calls in
            specific time.                                             escalation.

  Trend of ratios or percentage up or                              Number of missed calls
                 down.
                                                                 First Call Resolution Rates
  Traffic light indicator for thresholds.
                                                                Location/Technology volume
   Mean follow-up satisfaction survey
                result.                                     Used dials, gauges, and other visual
                                                                 representations of data.
     Includes financial information
                                                              All the measures would normally
 These measures look over a period of                       show the current status/state of the
                  time                                       item being monitored at the exact
   (Monthly or Quarterly), base-lined                       instant the dashboard is viewed or
                 against                                                 refreshed
    specific goals, either in absolute
                terms or
    improvements Vs a prior period
You are the CEO or Owner
                       of your Automobile
               Intelligence Levels   Length of Time.         Metric        Time        Decision after
               and                   The Decision                          Period      Business
               Types of Knowledge    Process                               &           Intelligence
                                                                           Measure
Owner          Strategic Level       Yearly                  KRI           Past        Miles, rate of
                                                                                       depreciation.,
Long term      Measured by Cost or   What can be done to     Key Results   MPG         maintenance
results of     Savings               improve savings or      Indicator.                cost are all
your Driving                         control cost next                     Repairs     high. Adapt to
Habits         A Scorecard           year.                                             eco driving
                                                                           Deprec.     habit.
Manager        Tactical Level        Quarterly/Mthly         KPI           Past and    New brakes,
                                                                           Present     tires, & fluids
Short term     Measured by           Unexpected event        Key                       changes are
results of     Dollars and Counts    leads budget            Performance   Fuel cost   due in 2k miles.
your Driving                         adjustments.            Indicator     Speed       I’ll start using
Habits         Scorecard or          Cheaper gas, and                      MPH/        the public
               Dashboard             less driving req.                     MPG         transit system.
Driver         Operational Level     Weekly/Daily/Now        PI            Present     Pull into to
                                                                                       service station
Immediate      Measured by Counts    My car went from 0      Performance   Engine      and check oil,
results of                           to 60 in 5.8 seconds.   Indicator     Temp        tires. Read the
your Driving   A Dashboard           I am driving fast and                             performance
Habits                               furious                               RPM         manual.
Accurate and Timely Information Delivered from
             Trusted Application Platforms
                           User Access Portals

       Business Objects Enterprise                Microsoft SharePoint
                                                        Server

                                Client Tools

  Xcekcuis                                             Microsoft
 Dashboard           Web            Crystal           SQL Server’s
  Manager        Intelligence       Reports            Reporting
Performance                                             Services
  Manager

                                 Data Tools
                  Data Integrator                         Microsoft
                Universe Designer                         Analysis
              Business View Manager                       Services

                 Relational Database Management Systems

                  Oracle                         Microsoft’s SQL Server
BI Application in Vertical and Horizontal Industry Markets

Market         Firm          Industry      Customer 1 Customer 2 Customer 3
Horizontal     Medical       Healthcare    Radiology Doctor      Hospital
               Supplies Inc.               Consultant

Vertical       Washington Healthcare       Doctor’s      Receptionist Clinics
               Computer                    Office
               Outlet
                             Law         Police Dept 911 Service Homeland
                             Enforcement             Center      Security


                             Education     Principal’s   Classroom     School
                                           office                      Board

In the horizontal market example, the supplier of medical equipment and supplies
could use BI with health care providers.

In the vertical market example, the computer store could use BI with several
industries like Healthcare, Law Enforcement, Education or any company the needs
and uses computers.
Resources
    Business Enhancers Inc.
      http://www.businessenhancers.com
         email: admin
   Windows Server System Main Website
       http://www.microsoft.com/windowsserversystem
    

   SAP Business Objects Enterprise
    Server System Web Site
       http://www.sap.com/solutions/sapbusinessobject
        s/index.epx

Gregs BI Presentation

  • 1.
    Developed by: Business Enhancers Inc. Where success is promoted. 360-831-9133 Business Intelligence Components, Concepts, and Processes Business Intelligence, Decision Support & Analytics
  • 2.
    Business and Data Capture Analysis Data Modeling Understanding business operations & strategy, as well as data capture & storage is key for designing and querying from relational and dimensional data models.
  • 3.
  • 4.
    Interactive Dashboards &Scorecards Go to http://www.businessenhancers.com to run demos Flash Required http://get.adobe.com/flashplayer/"
  • 5.
    Stages in BusinessIntelligence Stages Insight Questions Asked Objective 1 Do it the way it’s always be done, What just happened None. Analytically or good business sense used. and how do we stop Impaired it, or make it happen again? 2 We know how we are doing What can we do to What is the Localized things, but our current process improve our ROI for a BI Analytics doesn’t support our ability to do it processes? application? better 3 Initiate efforts to integrate data Can we extrapolate Measuring Analytical and analytical technologies. from existing trends? future Aspirations performance 4 Enterprise wide view of BI, and How do we innovate Knowledge Analytical know what’s needed to move to and differentiate? driven company the next level, but not there yet. performance and value 5 Enterprise wide system. Result How do we stay Sustainable Analytical driven strategic advantage. ahead of the game? strategic Competitor What’s possible? performance and value What stage is your company operating at?
  • 6.
    SAP Business ObjectsEnterprise Information Consumers Client Tools Crystal Reports Xcelcius Web Intelligence Intelligent Platform Business Objects Enterprise Group/User/Analytics/Reports Administration Data Access and Row Level Security Supporting Infrastructure Windows Server - Database Server – Internet Server Network Hardware and Software
  • 7.
    Path to BIand Reporting Reporting & Analysis Tools | Source Data Integrator Dashboards & Data 1 & Services XI Visualizations 3.0 Business Objects, SAP | On Oracle Demand Warehouse RELATIONAL/ And Real-time Source OLAP - Information Builder (OWB) Data 2 11gR1 Oracle DATAMART/ | DATA WAREHOUSE Drill and Integration Search Services (SSIS) Navigation 2005 Microsoft | Symantec Source Layer Security Data 3 The Universe
  • 8.
    DASHBOARDS VS SCORECARDS Scorecardcan access the quality of execution whereas dashboards provide tactical guidance. Scorecards inherently measure against goals dashboards need not. Scorecard focus on strategy by monitoring real world execution of a specific strategy. Dashboards focus on operational goals Scorecard – Indicators Dashboard – Indicators KRIs or KPIs KRIs or PIs Call Center Examples Call Center Examples Percentage of issues resolved in a Number of real-time calls in specific time. escalation. Trend of ratios or percentage up or Number of missed calls down. First Call Resolution Rates Traffic light indicator for thresholds. Location/Technology volume Mean follow-up satisfaction survey result. Used dials, gauges, and other visual representations of data. Includes financial information All the measures would normally These measures look over a period of show the current status/state of the time item being monitored at the exact (Monthly or Quarterly), base-lined instant the dashboard is viewed or against refreshed specific goals, either in absolute terms or improvements Vs a prior period
  • 9.
    You are theCEO or Owner of your Automobile Intelligence Levels Length of Time. Metric Time Decision after and The Decision Period Business Types of Knowledge Process & Intelligence Measure Owner Strategic Level Yearly KRI Past Miles, rate of depreciation., Long term Measured by Cost or What can be done to Key Results MPG maintenance results of Savings improve savings or Indicator. cost are all your Driving control cost next Repairs high. Adapt to Habits A Scorecard year. eco driving Deprec. habit. Manager Tactical Level Quarterly/Mthly KPI Past and New brakes, Present tires, & fluids Short term Measured by Unexpected event Key changes are results of Dollars and Counts leads budget Performance Fuel cost due in 2k miles. your Driving adjustments. Indicator Speed I’ll start using Habits Scorecard or Cheaper gas, and MPH/ the public Dashboard less driving req. MPG transit system. Driver Operational Level Weekly/Daily/Now PI Present Pull into to service station Immediate Measured by Counts My car went from 0 Performance Engine and check oil, results of to 60 in 5.8 seconds. Indicator Temp tires. Read the your Driving A Dashboard I am driving fast and performance Habits furious RPM manual.
  • 10.
    Accurate and TimelyInformation Delivered from Trusted Application Platforms User Access Portals Business Objects Enterprise Microsoft SharePoint Server Client Tools Xcekcuis Microsoft Dashboard Web Crystal SQL Server’s Manager Intelligence Reports Reporting Performance Services Manager Data Tools Data Integrator Microsoft Universe Designer Analysis Business View Manager Services Relational Database Management Systems Oracle Microsoft’s SQL Server
  • 11.
    BI Application inVertical and Horizontal Industry Markets Market Firm Industry Customer 1 Customer 2 Customer 3 Horizontal Medical Healthcare Radiology Doctor Hospital Supplies Inc. Consultant Vertical Washington Healthcare Doctor’s Receptionist Clinics Computer Office Outlet Law Police Dept 911 Service Homeland Enforcement Center Security Education Principal’s Classroom School office Board In the horizontal market example, the supplier of medical equipment and supplies could use BI with health care providers. In the vertical market example, the computer store could use BI with several industries like Healthcare, Law Enforcement, Education or any company the needs and uses computers.
  • 12.
    Resources Business Enhancers Inc. http://www.businessenhancers.com email: admin  Windows Server System Main Website  http://www.microsoft.com/windowsserversystem   SAP Business Objects Enterprise Server System Web Site  http://www.sap.com/solutions/sapbusinessobject s/index.epx

Editor's Notes