Download to read offline


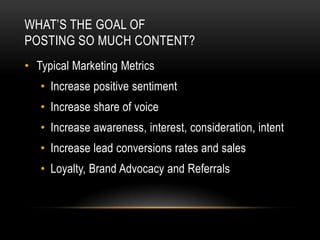


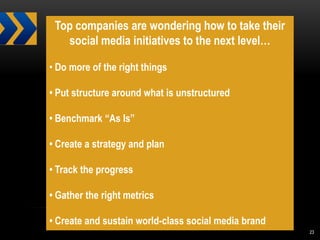

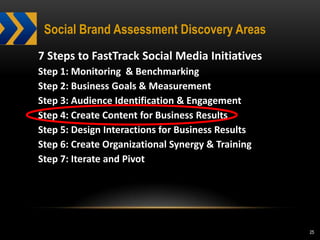
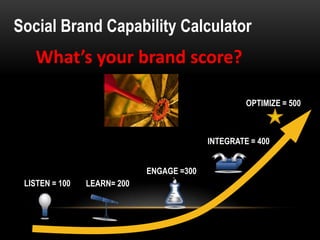
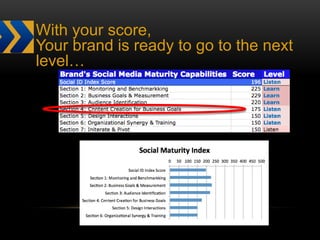


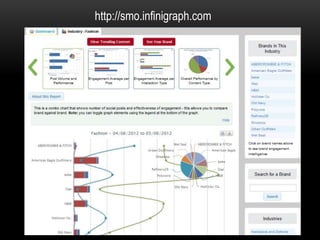


This document discusses the importance of data in social media marketing. It notes that top companies are looking to take their social media initiatives to the next level by benchmarking their performance, creating strategies and tracking progress. It promotes social media brand assessments that analyze areas like content, engagement, and organizational synergy to provide recommendations. Finally, it advertises a free competitive industry report that provides engagement data and content insights about brands to help optimize marketing strategies.


