Download to read offline


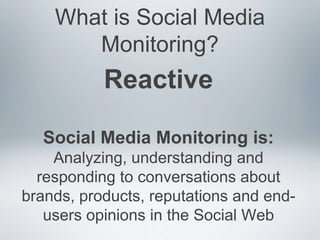


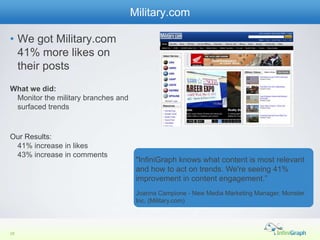


- Social media monitoring involves analyzing conversations about brands, products, and users' opinions on social networks to understand what is relevant and trending. InfiniGraph's tools go beyond listening to help brands discover hidden opportunities and competitive insights by analyzing the vast amount of user data and interactions on social media. InfiniGraph's social intelligence solutions have helped various brands like Military.com, Golden Spoon, and Complex Media significantly increase their social media engagement, traffic, sales and followers.


