Download to read offline
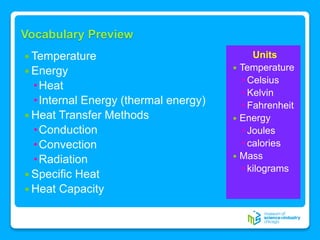
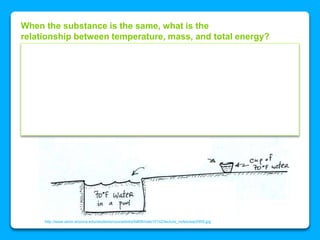
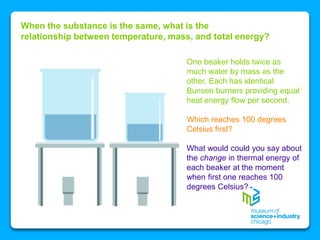
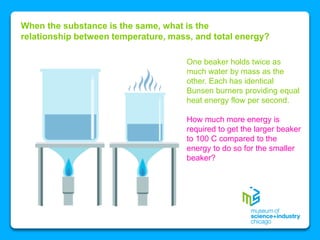
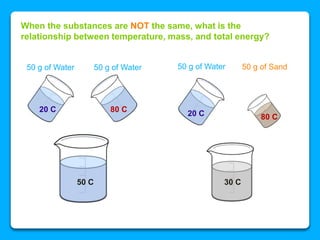
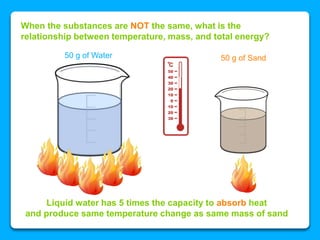
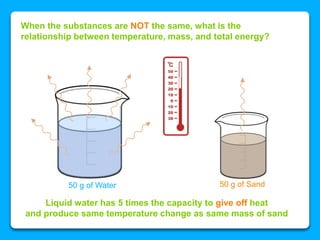
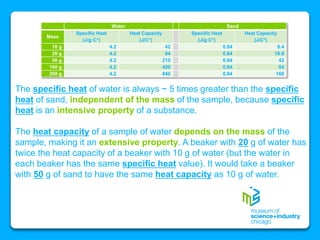
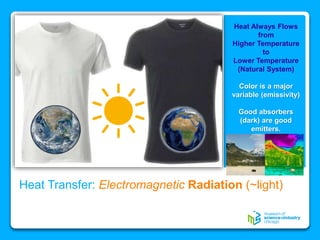
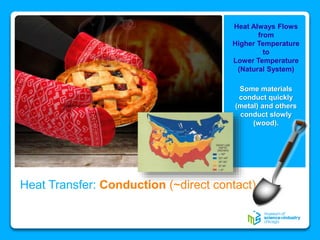
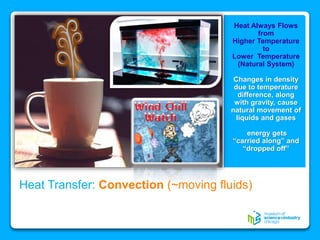

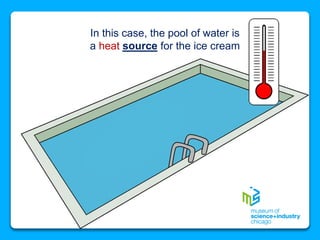
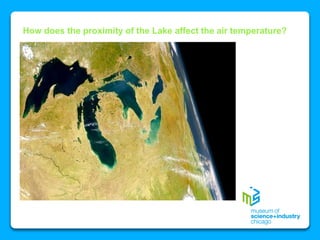
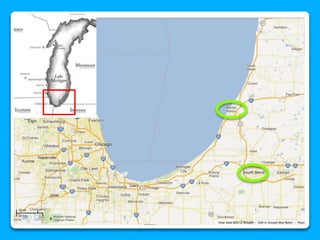
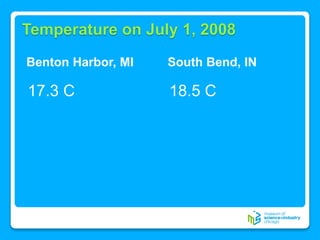
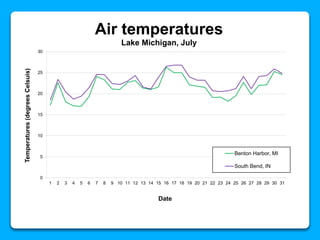
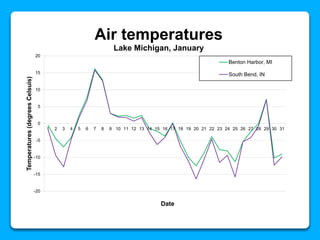
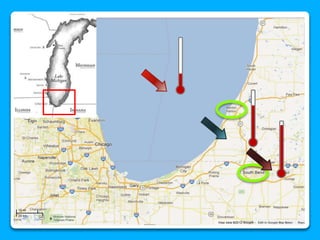
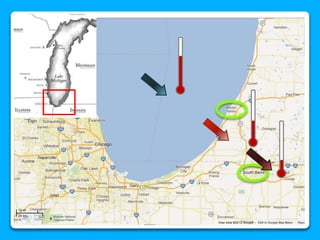

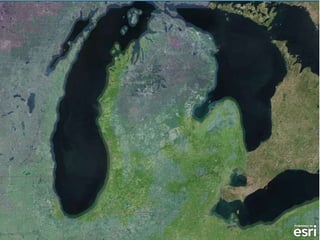
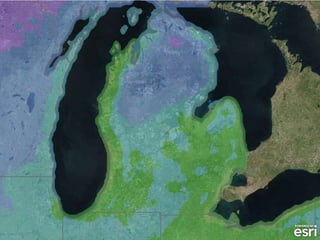
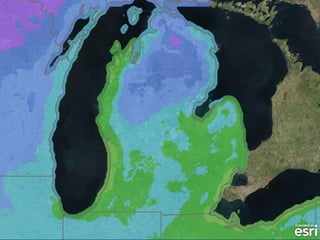
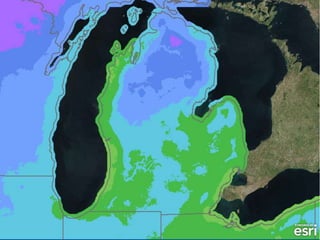
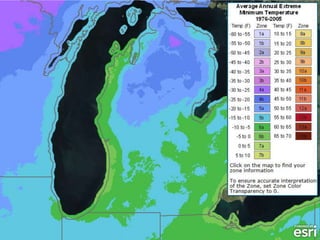
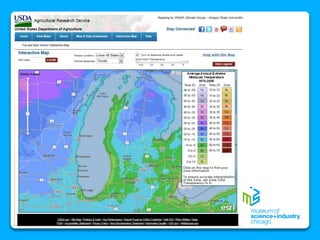

The document outlines the concepts of temperature, heat, and energy, focusing on heat transfer methods such as conduction, convection, and radiation. It discusses the relationships between temperature, mass, and total energy for different substances, emphasizing how specific heat varies between water and sand. The document also presents temperature data from locations near Lake Michigan, illustrating the influence of proximity to the lake on air temperatures.


