
![<script src="/includes/wtinit.js"
type="text/javascript"></script>
<script src="/includes/wtbase.js"
type="text/javascript"></script>
<script type="text/javascript"> //<![CDATA[ var
_tag=new WebTrends(); //]]>> </script> <script
type="text/javascript">
//<![CDATA[ // Add custom parameters here.
//_tag.DCSext.param_name=param_value;
_tag.dcsCollect(); //]]>> </script> <noscript>
<div><img alt="DCSIMG" id="DCSIMG" width="1"
height="1"
src="https://stats.ssa.gov/dcs5w0txb10000wocrvq
y1nqm_6n1p/njs.gif?dcsuri=/nojavascript&W
T.js=No&DCS.dcscfg=1&WT.tv=8.6.2"/>
</div> </noscript>](https://image.slidesharecdn.com/evanswebanalyticsingovernment1210-101208091359-phpapp01/85/Government-Web-Analytics-15-320.jpg)

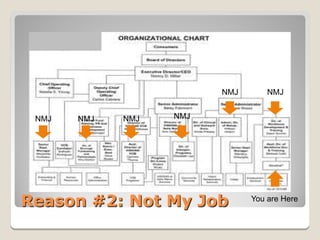
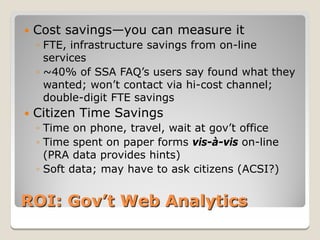
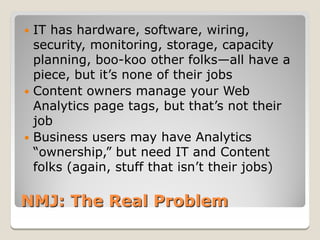


The document discusses how to implement web analytics in government, noting that it is challenging due to a lack of direct profit motivation and responsibilities being spread across different teams. It provides an overview of collecting behavioral and outcomes data, measuring the visitor experience, and analyzing social media, while emphasizing the importance of tying analytics to an organization's goals. Common challenges include different groups not seeing analytics as their core responsibility and a need to build cross-functional collaboration.