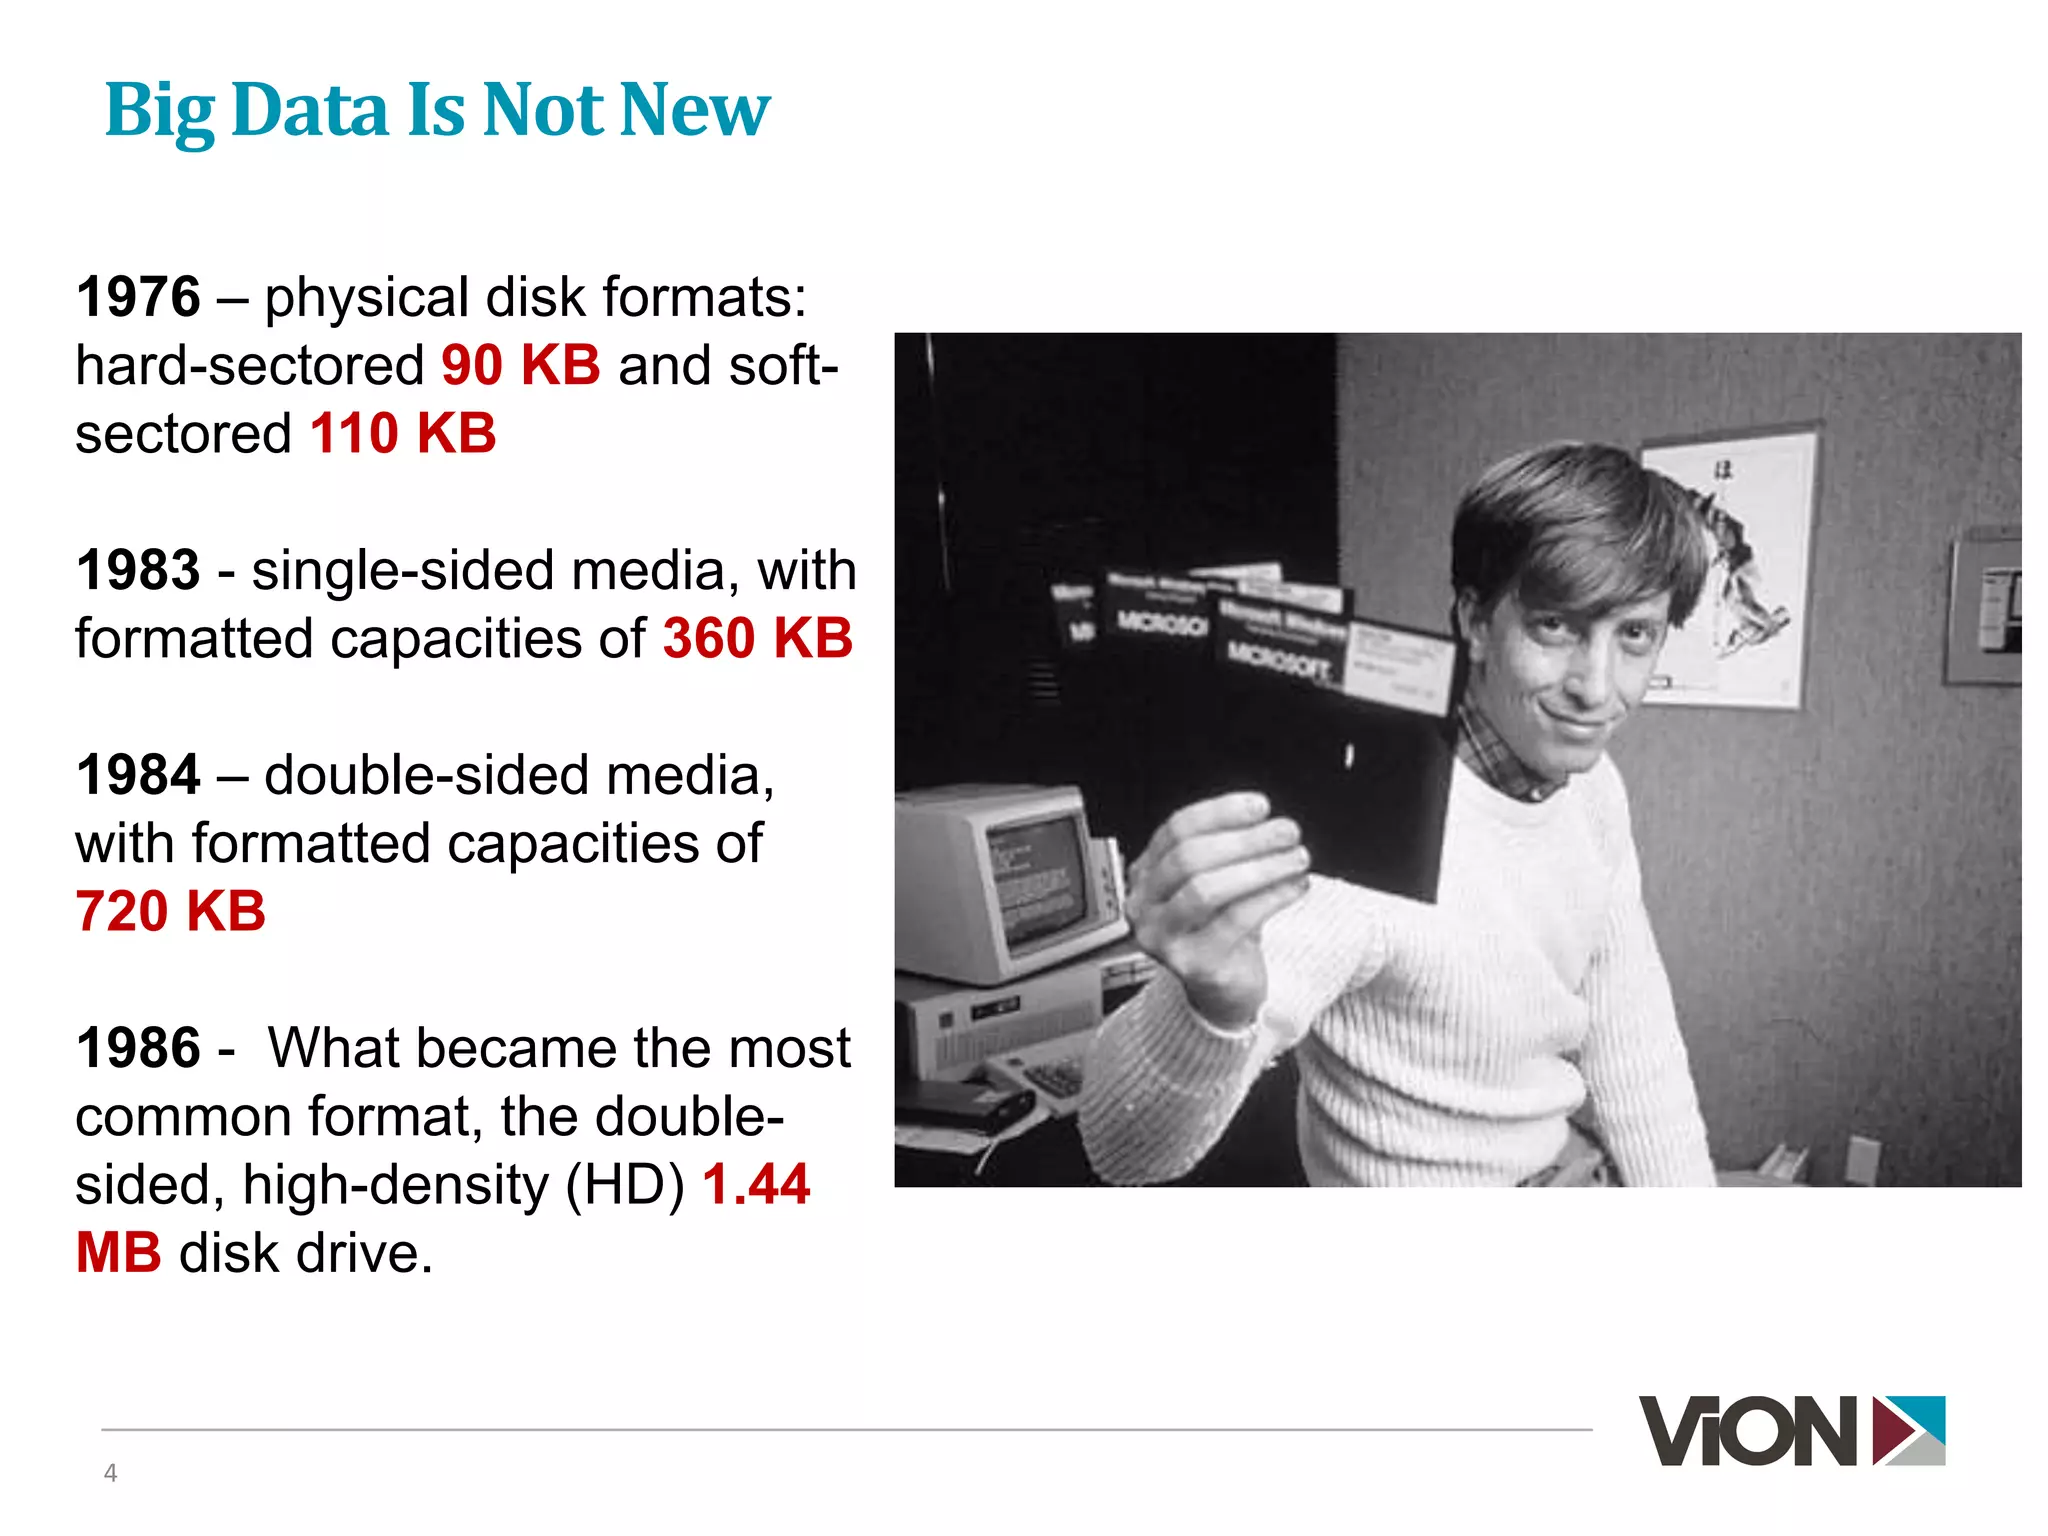
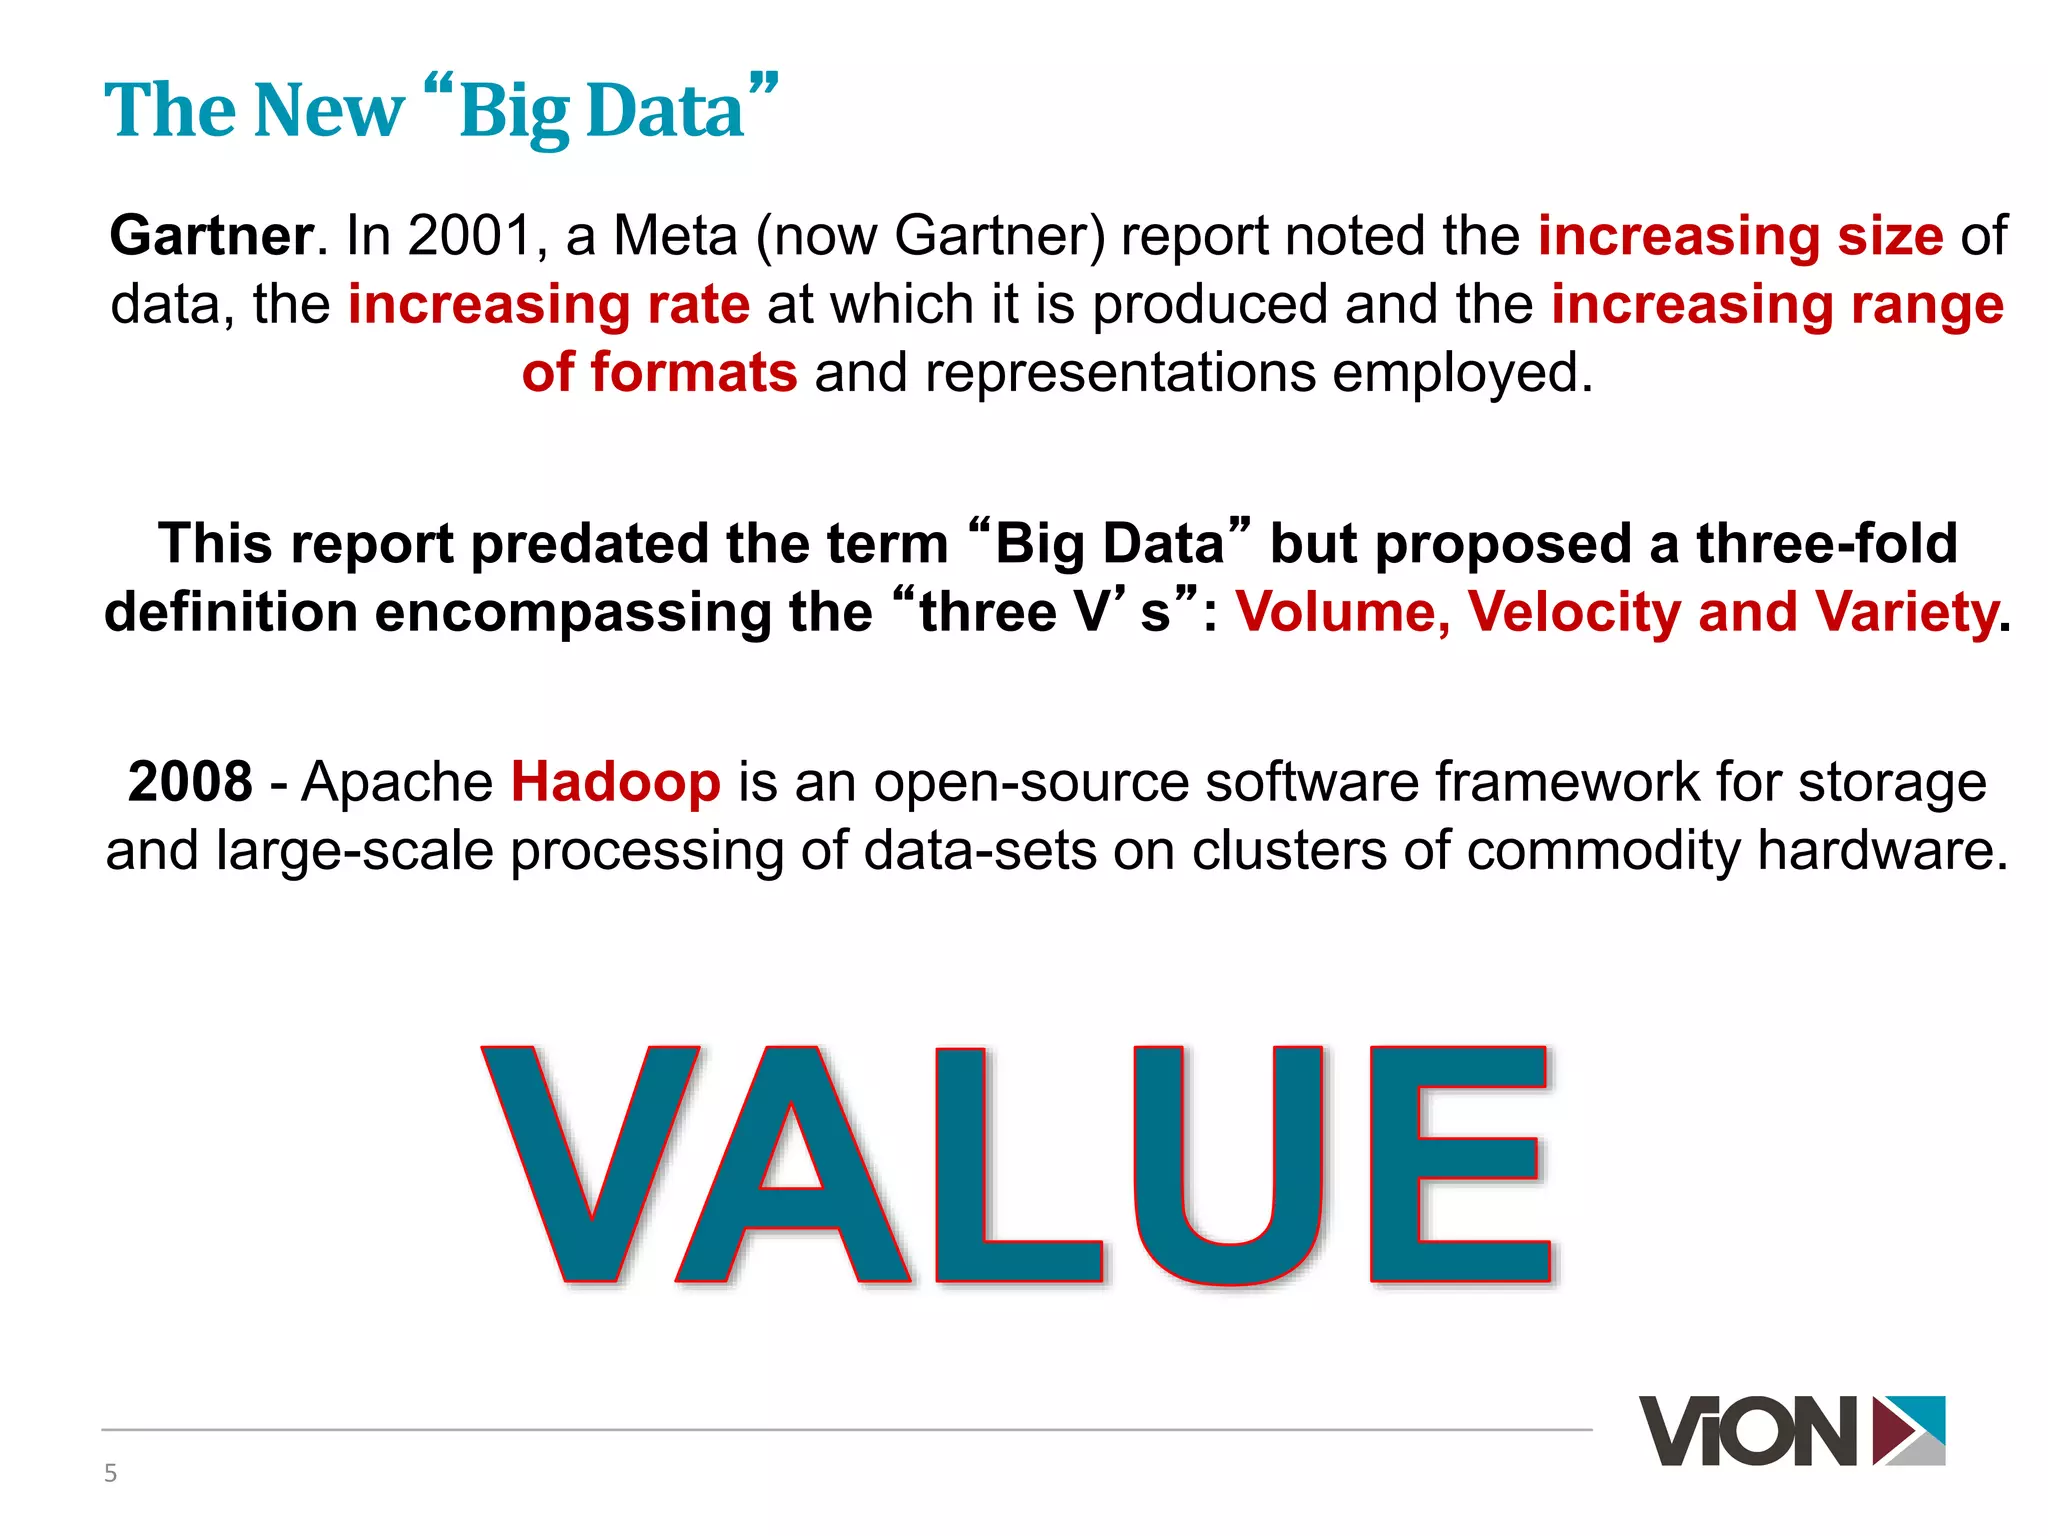
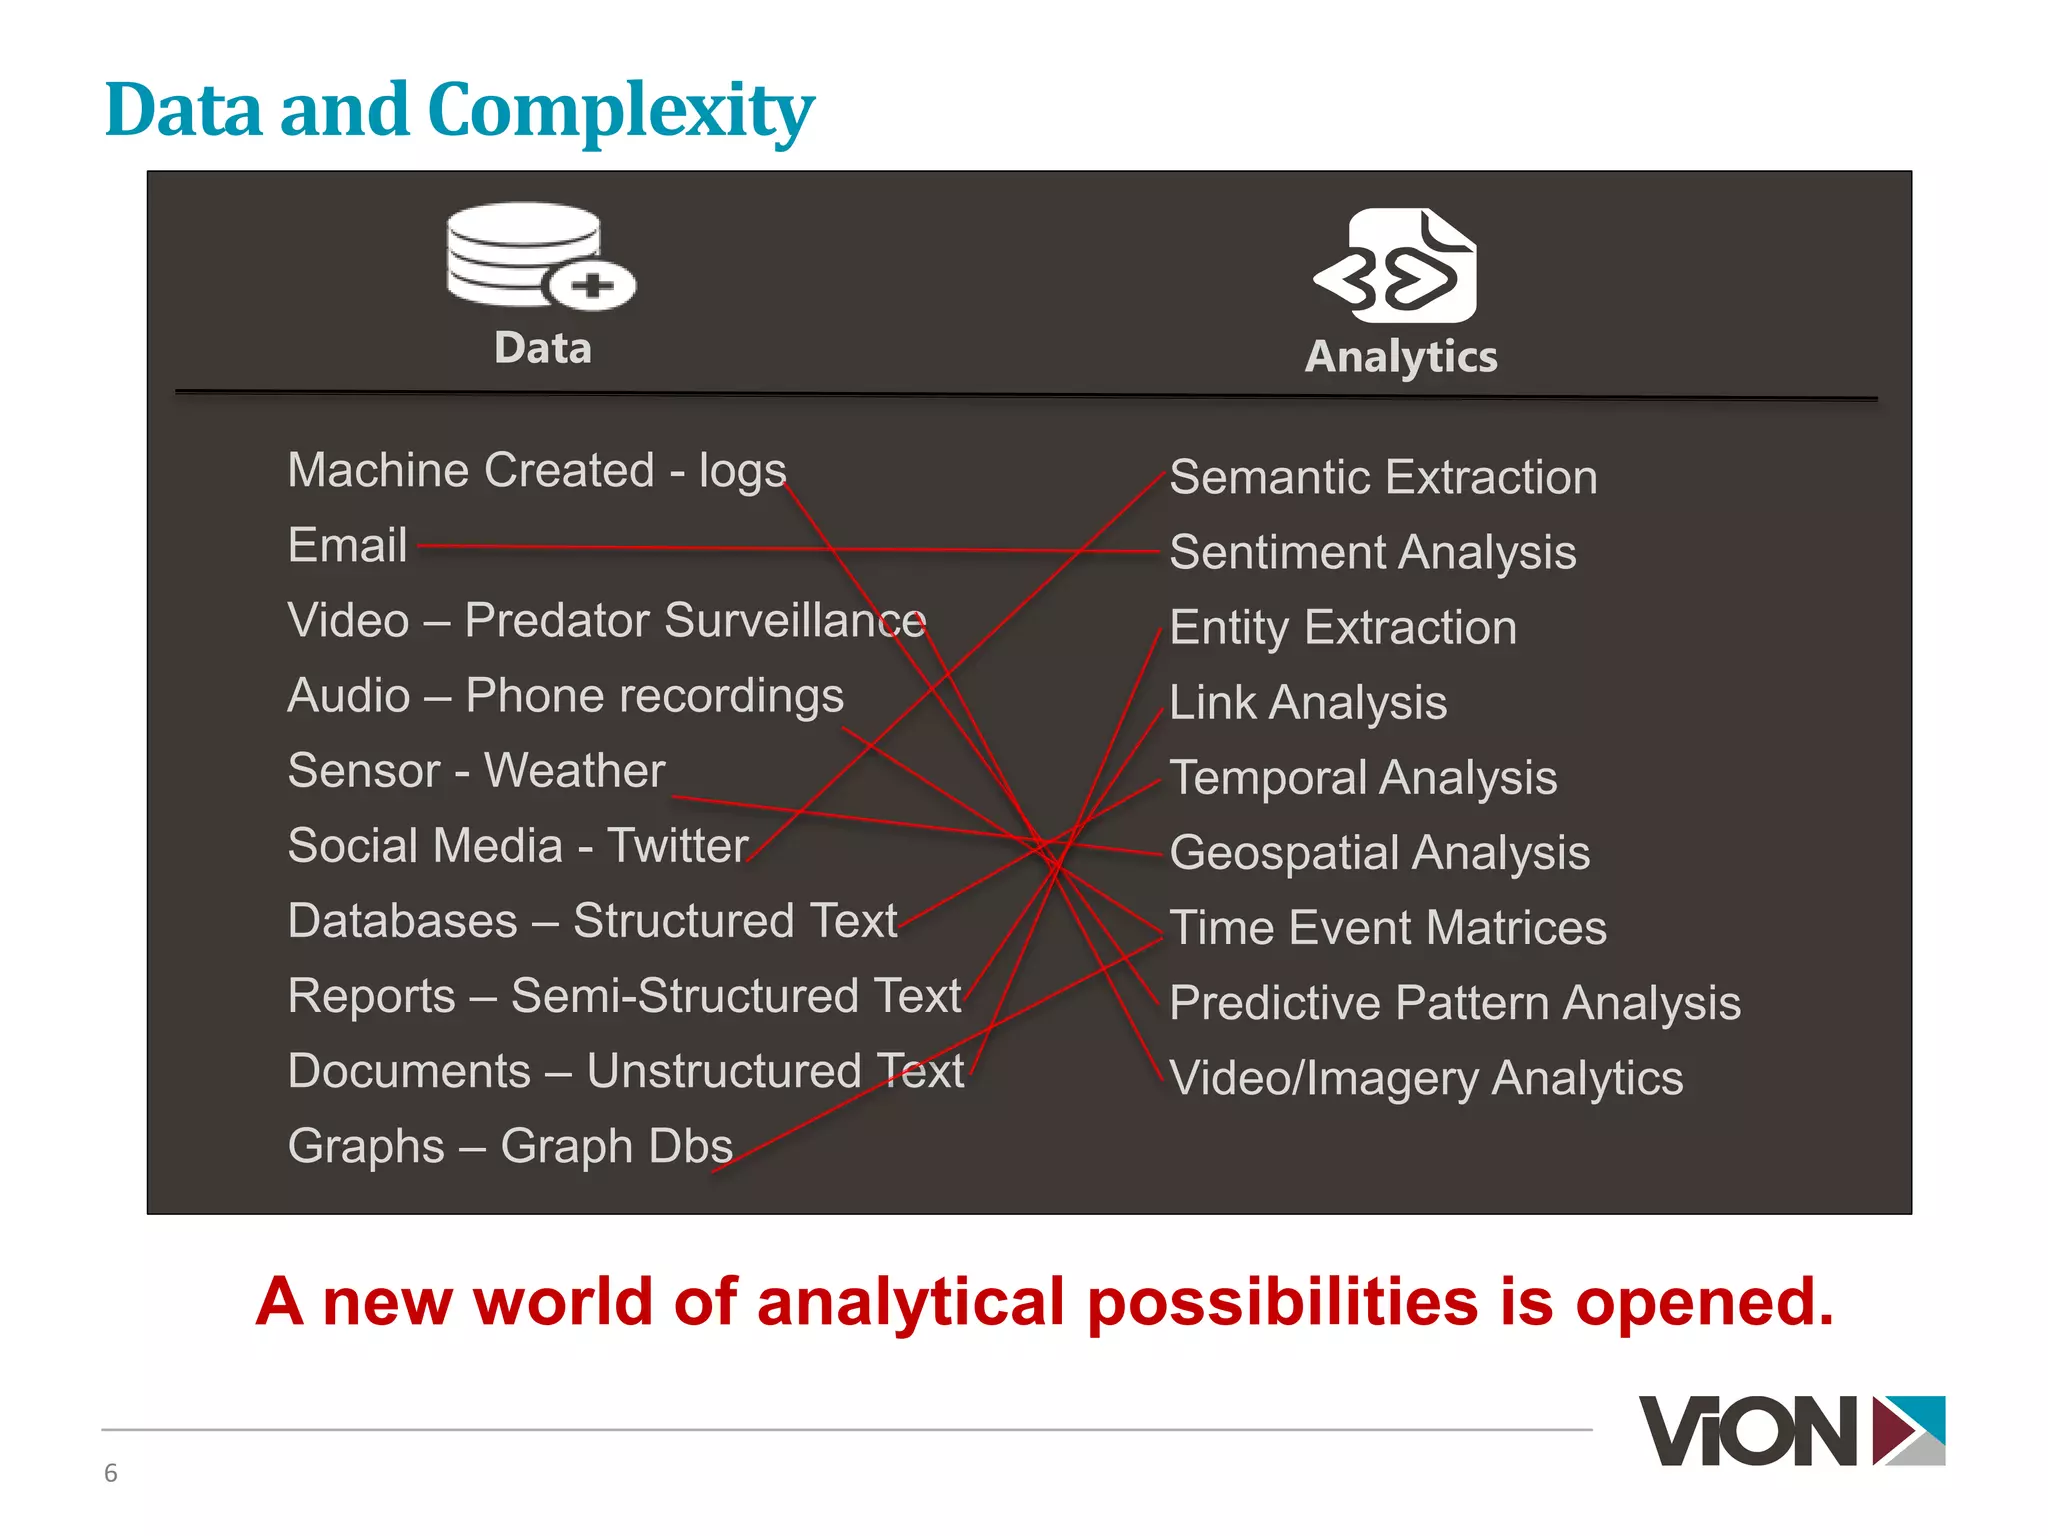
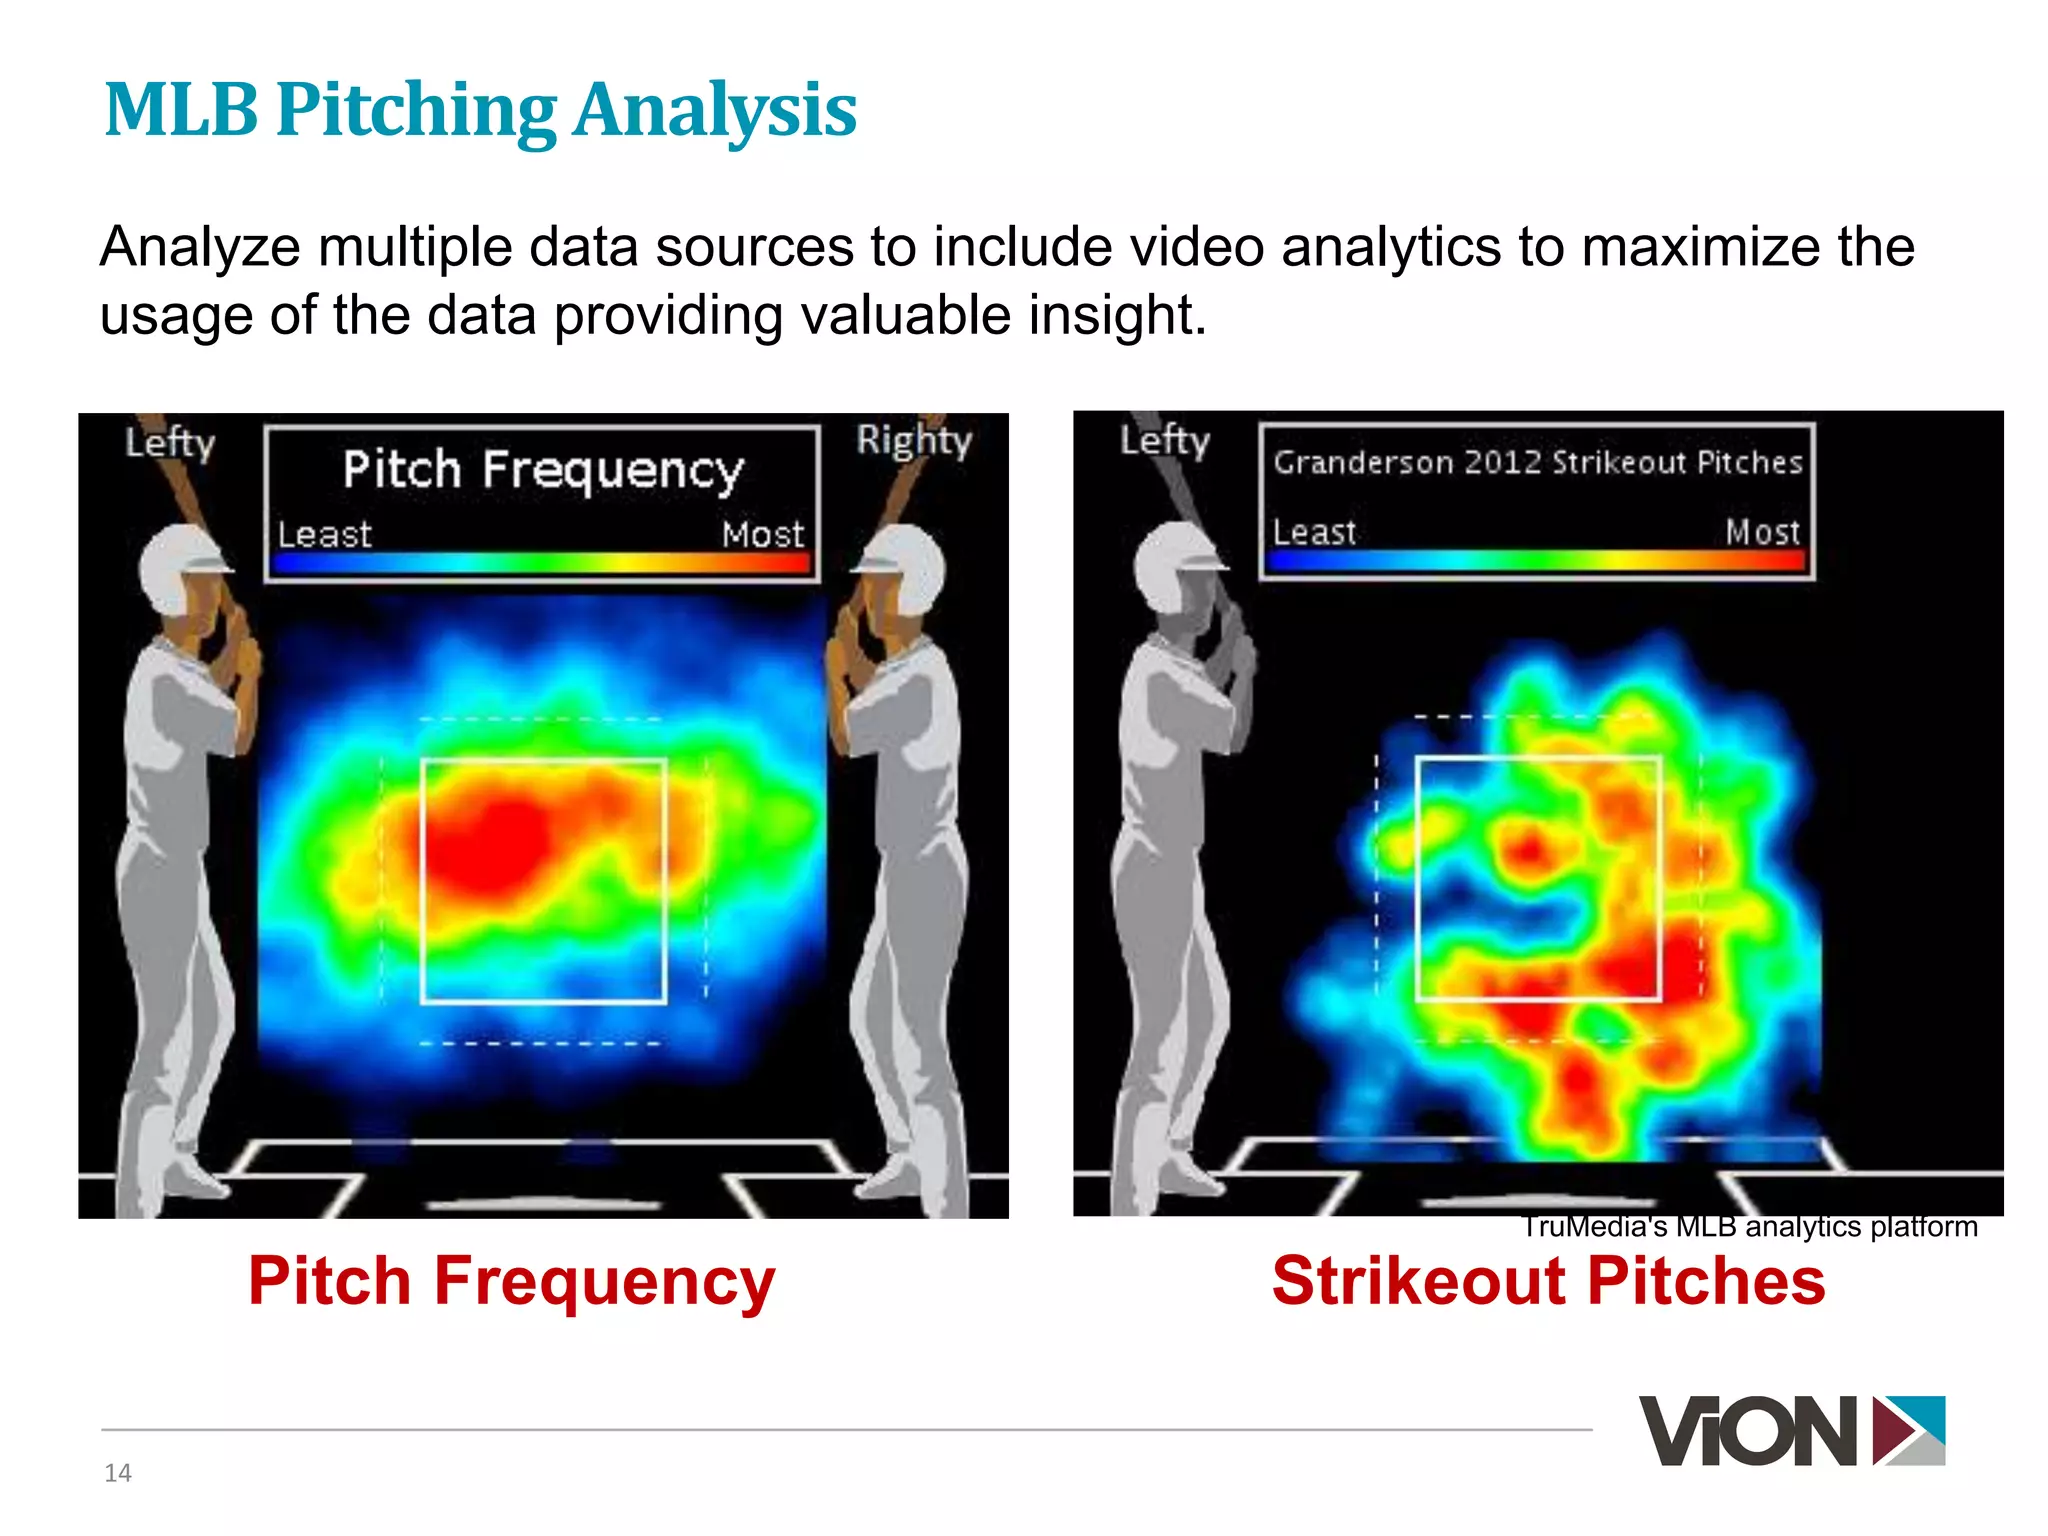
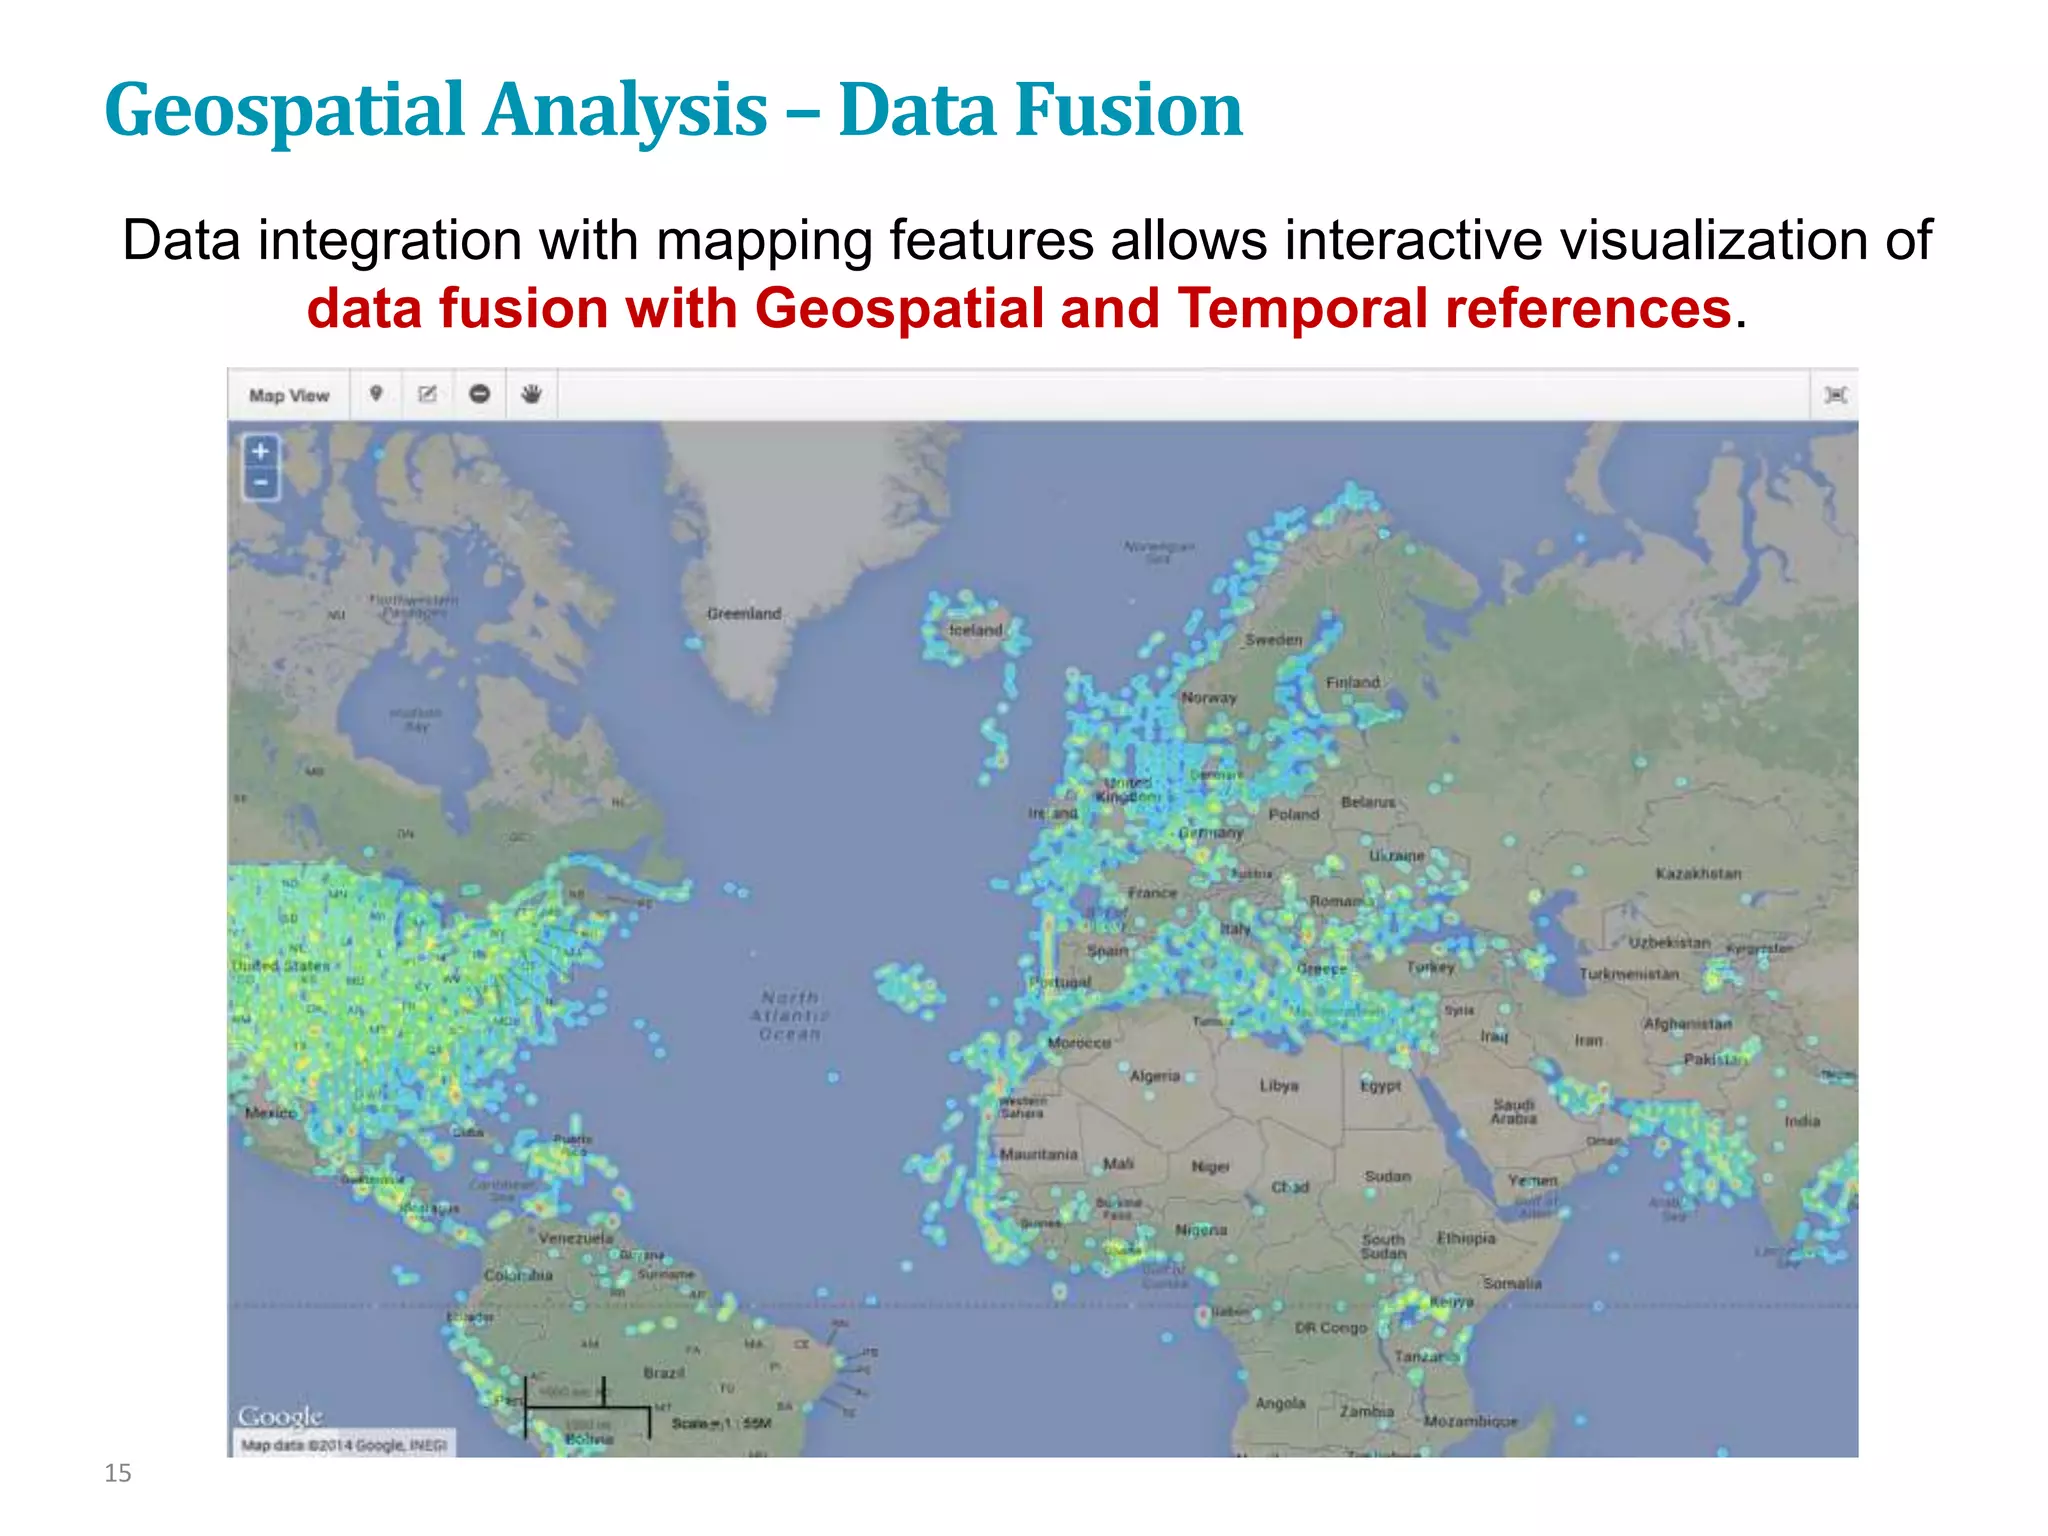
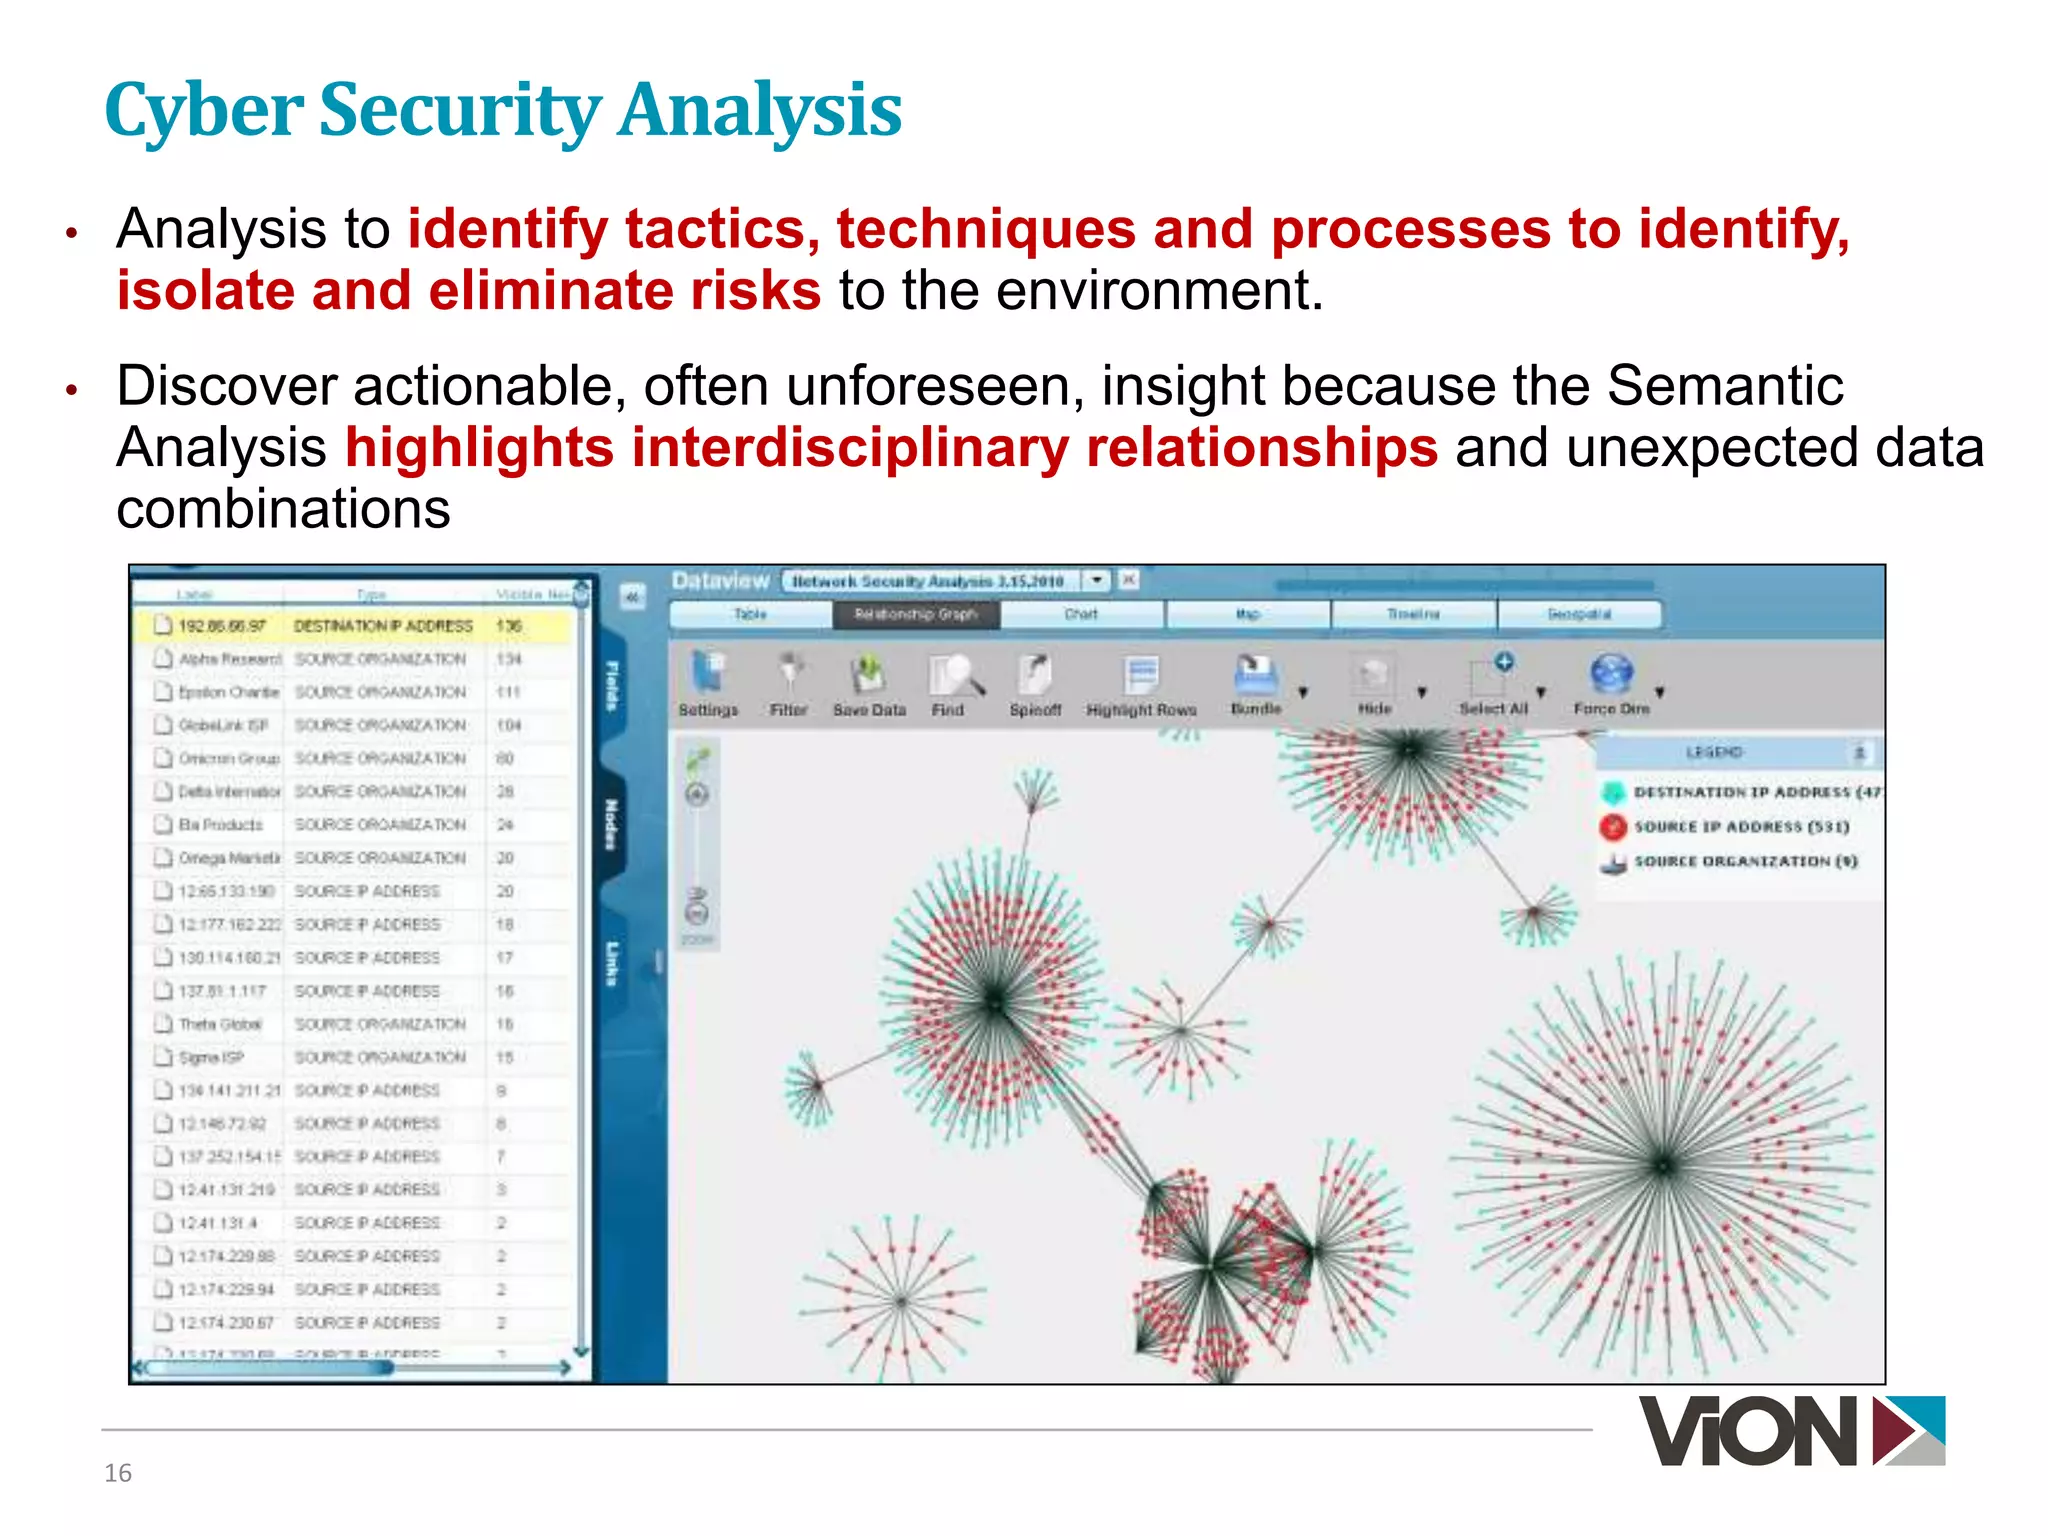
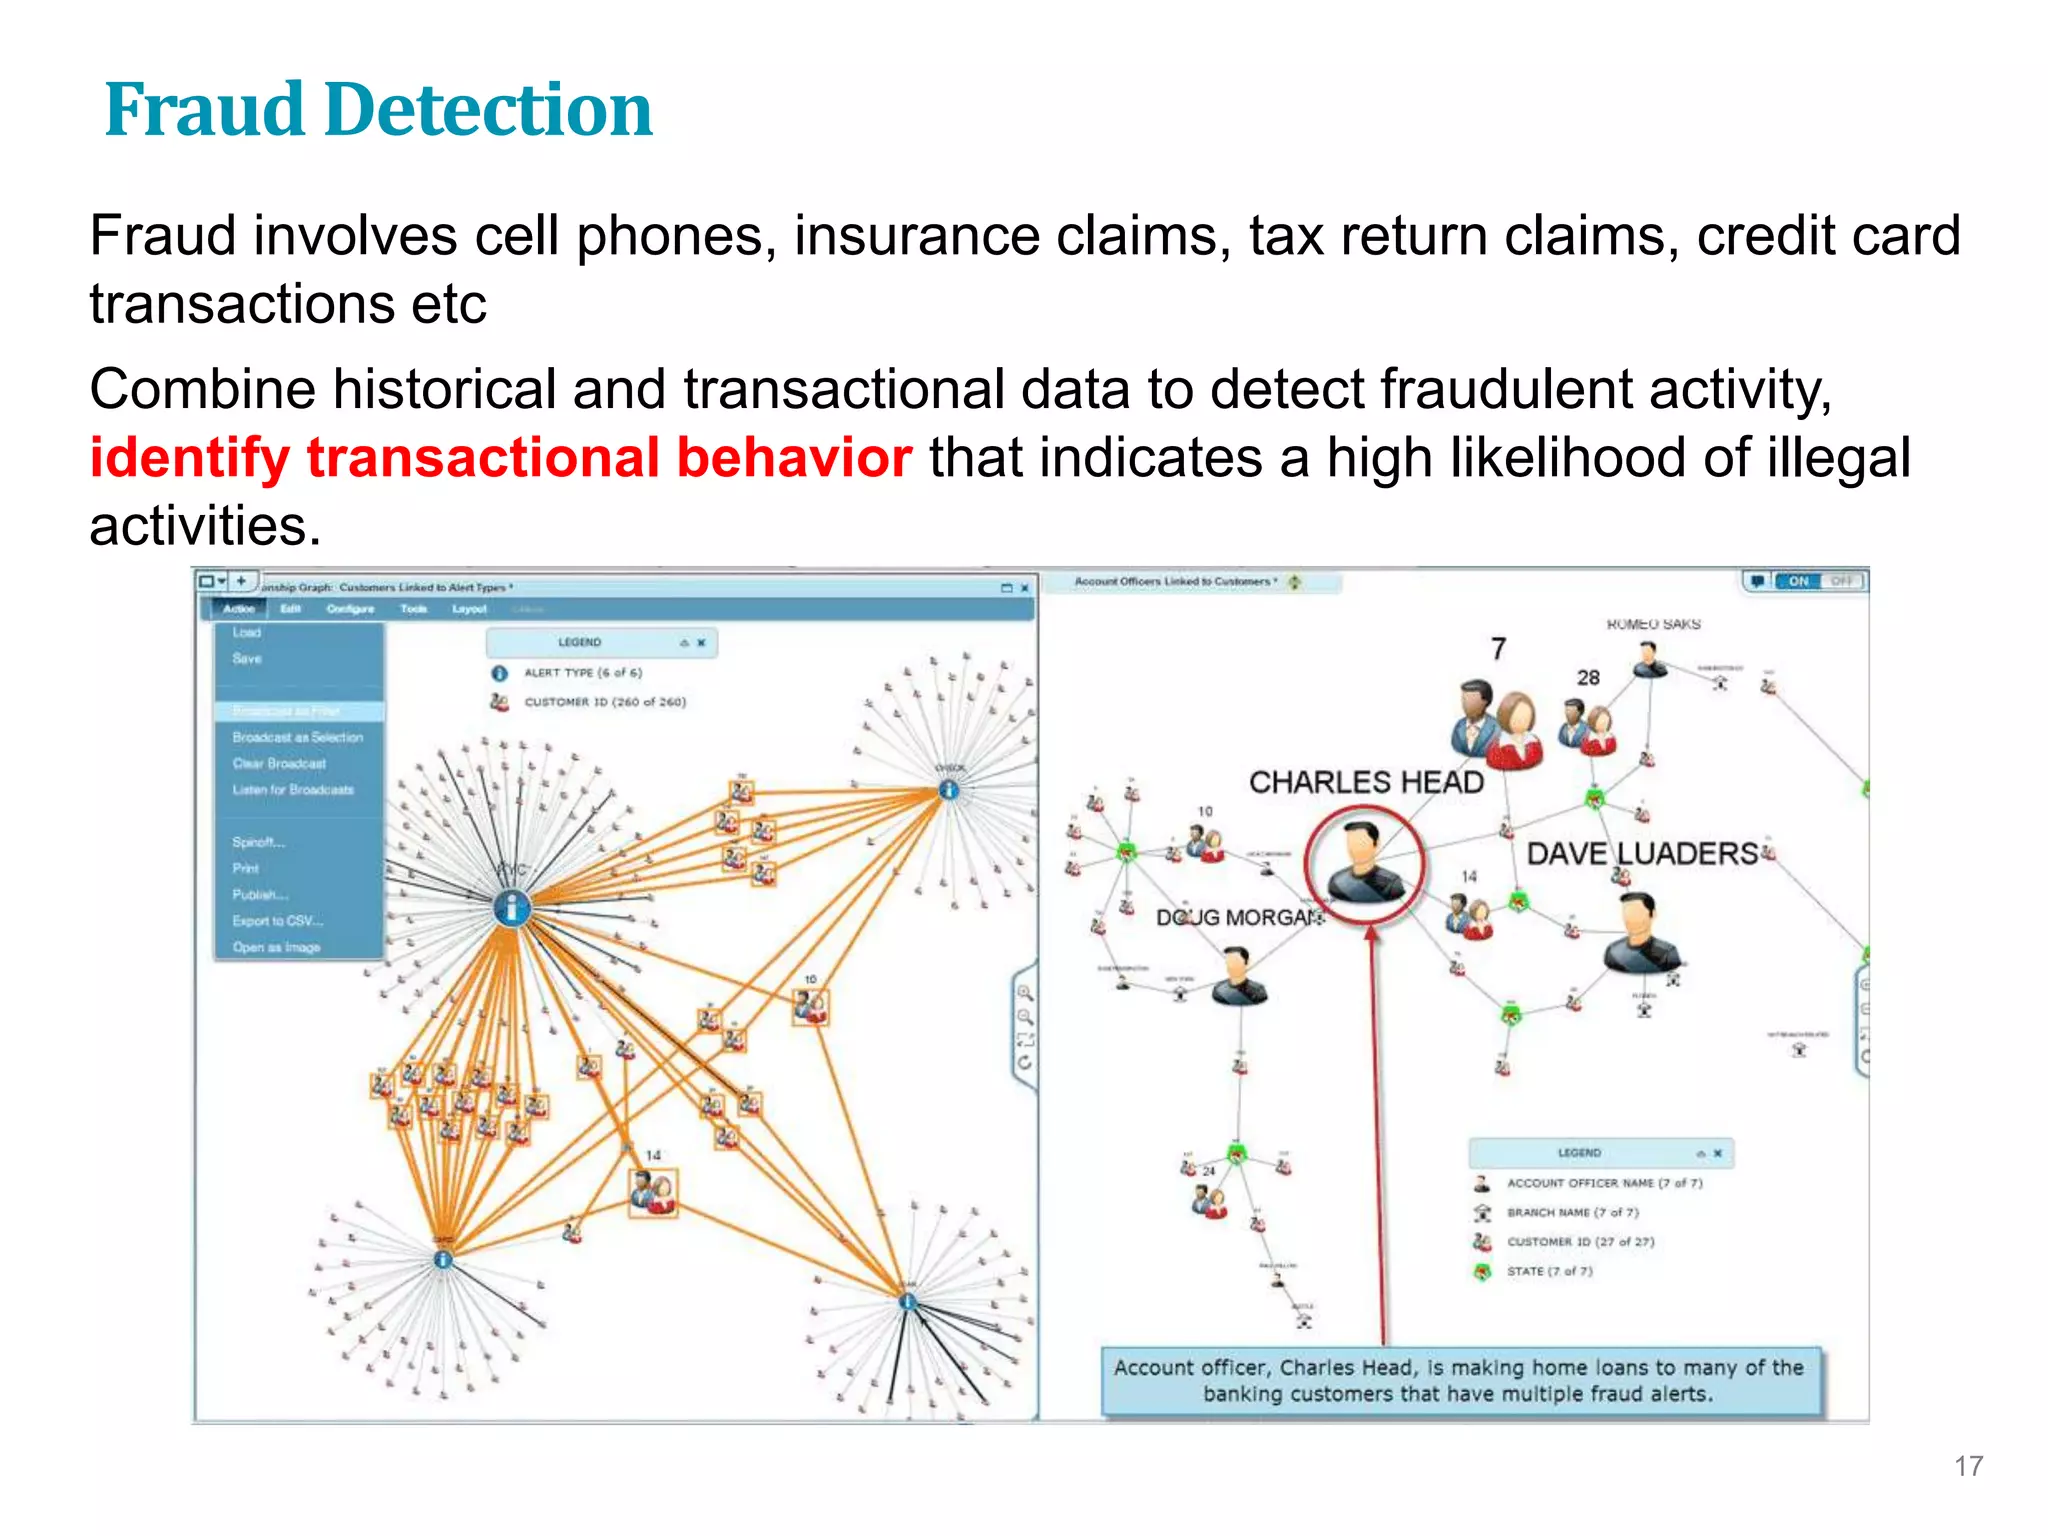
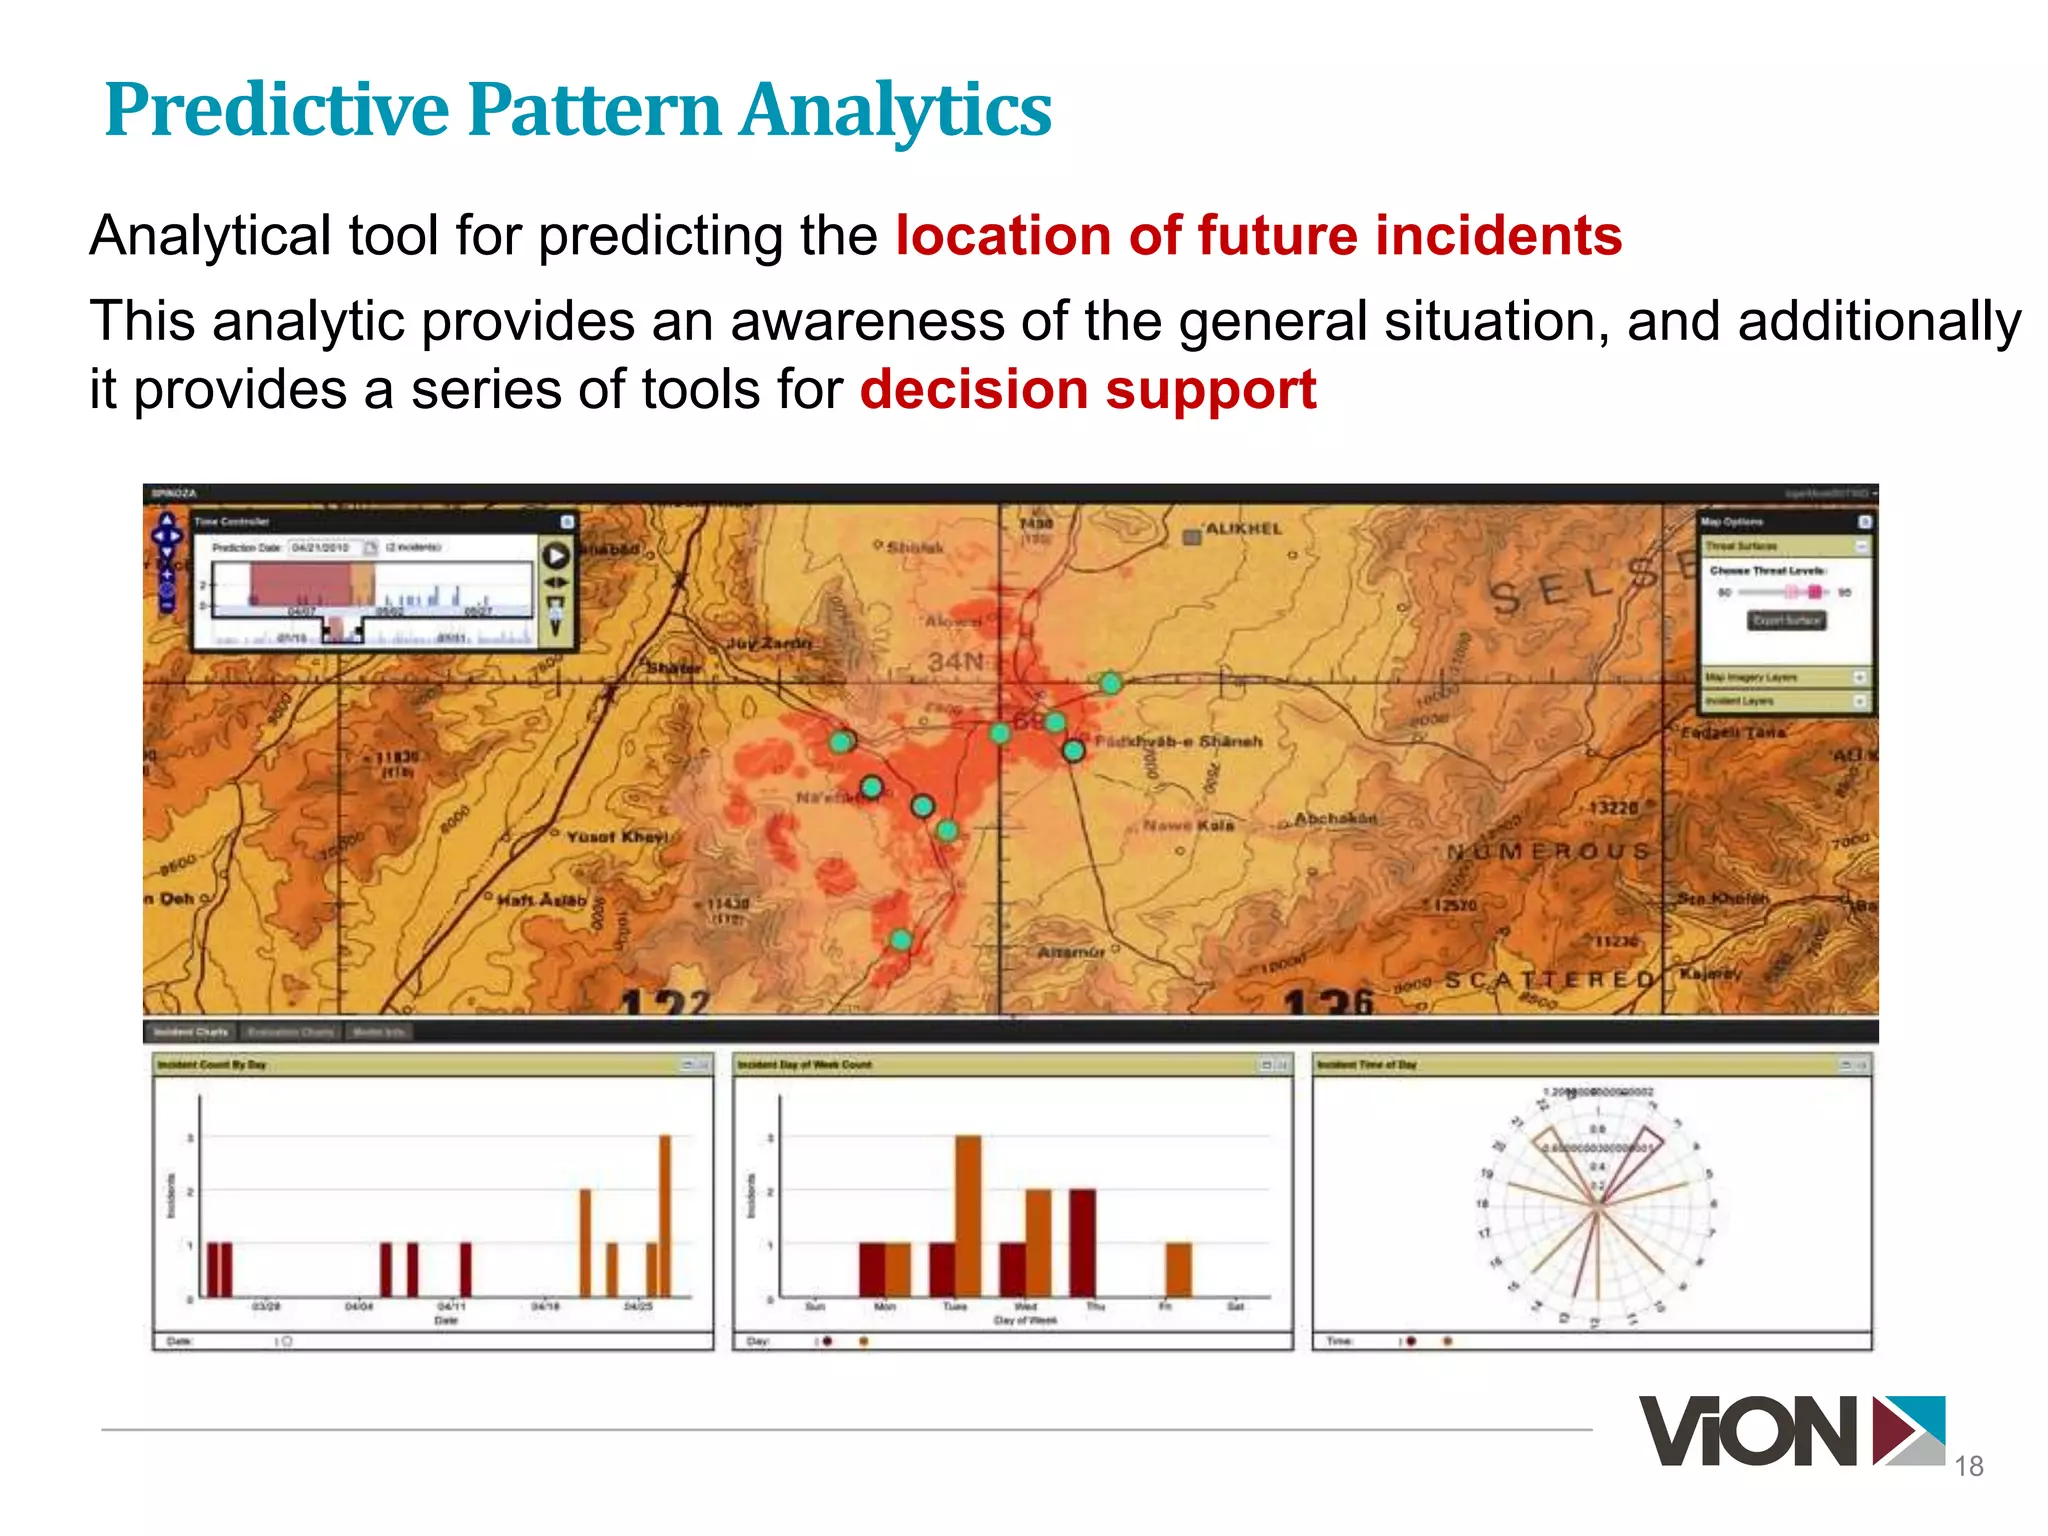
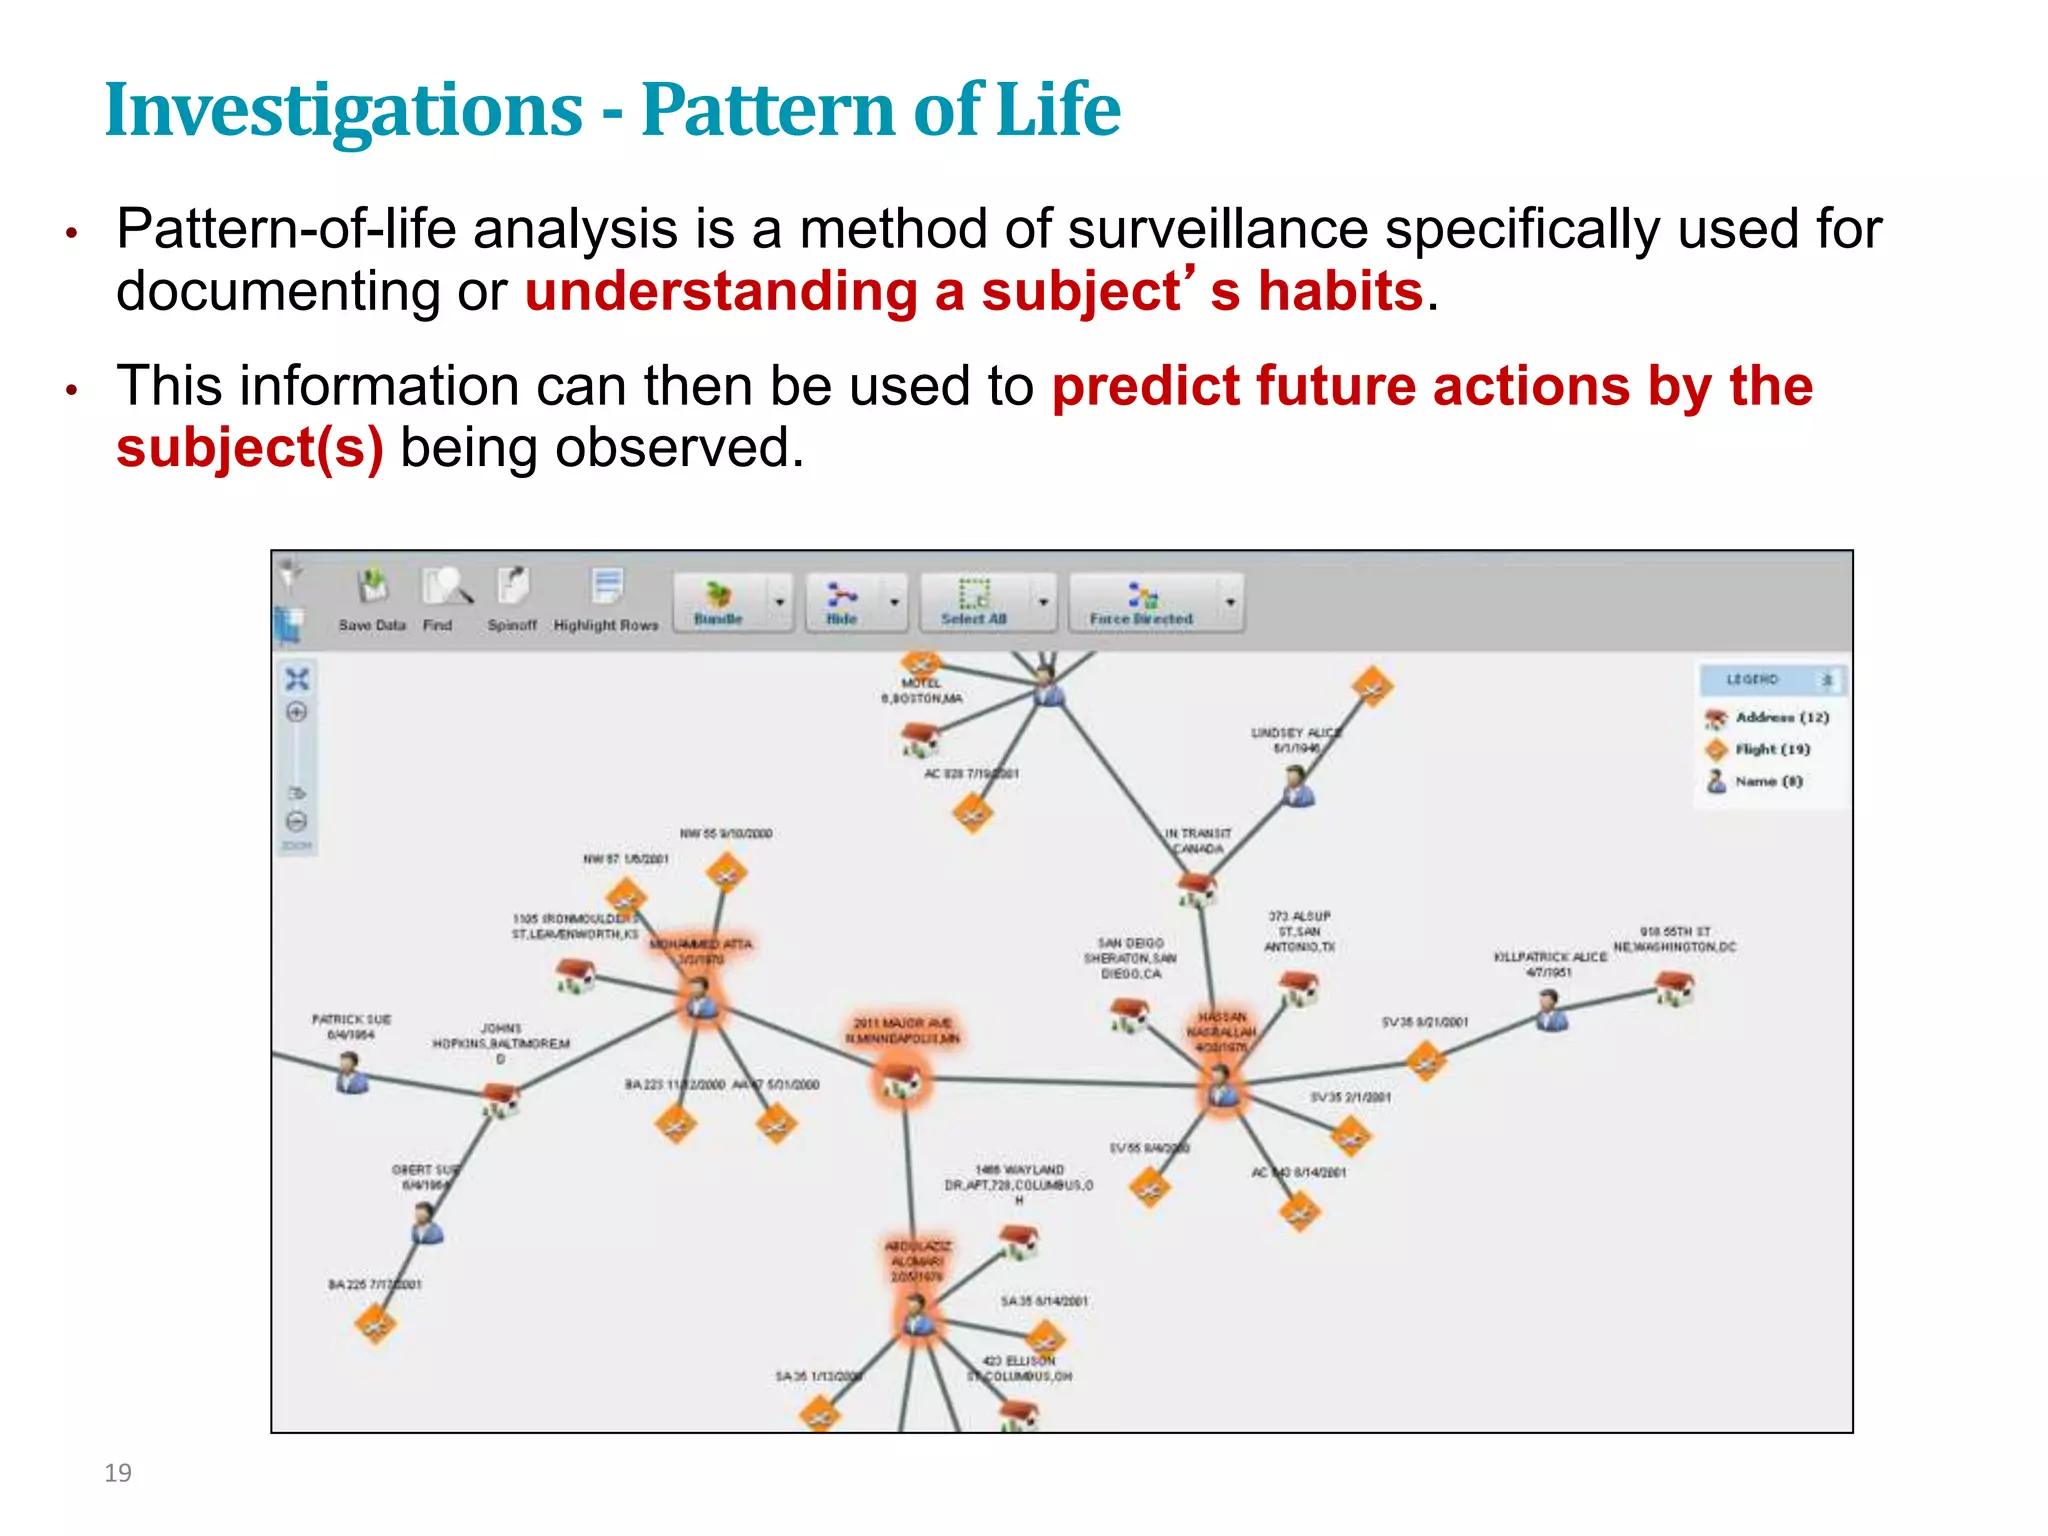
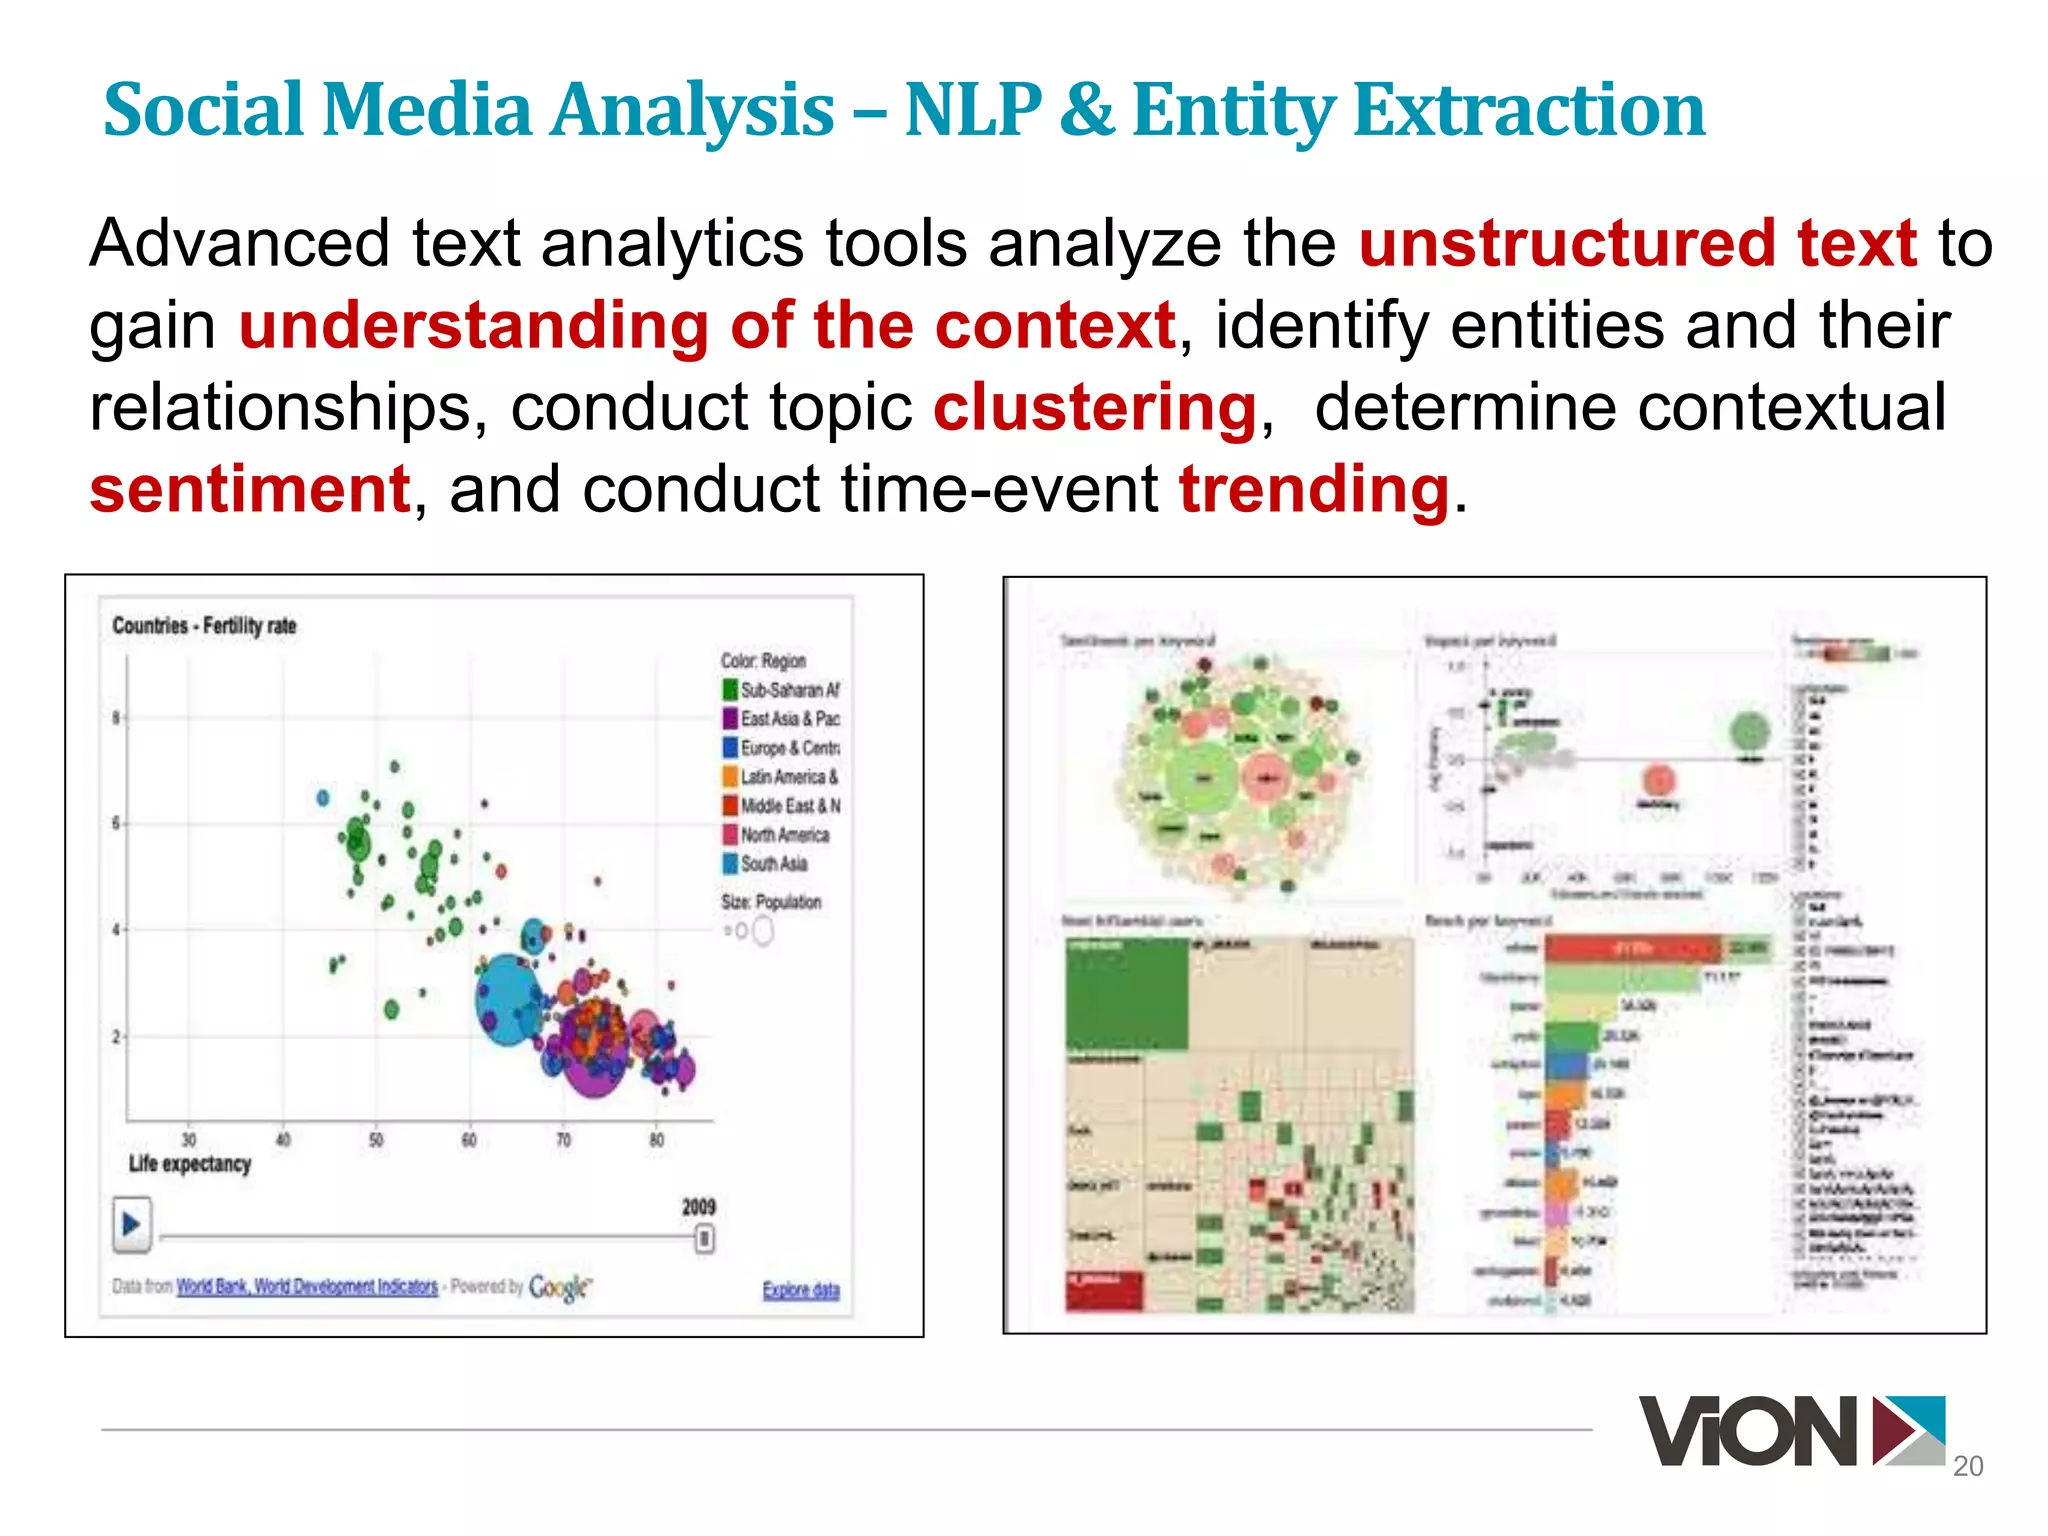
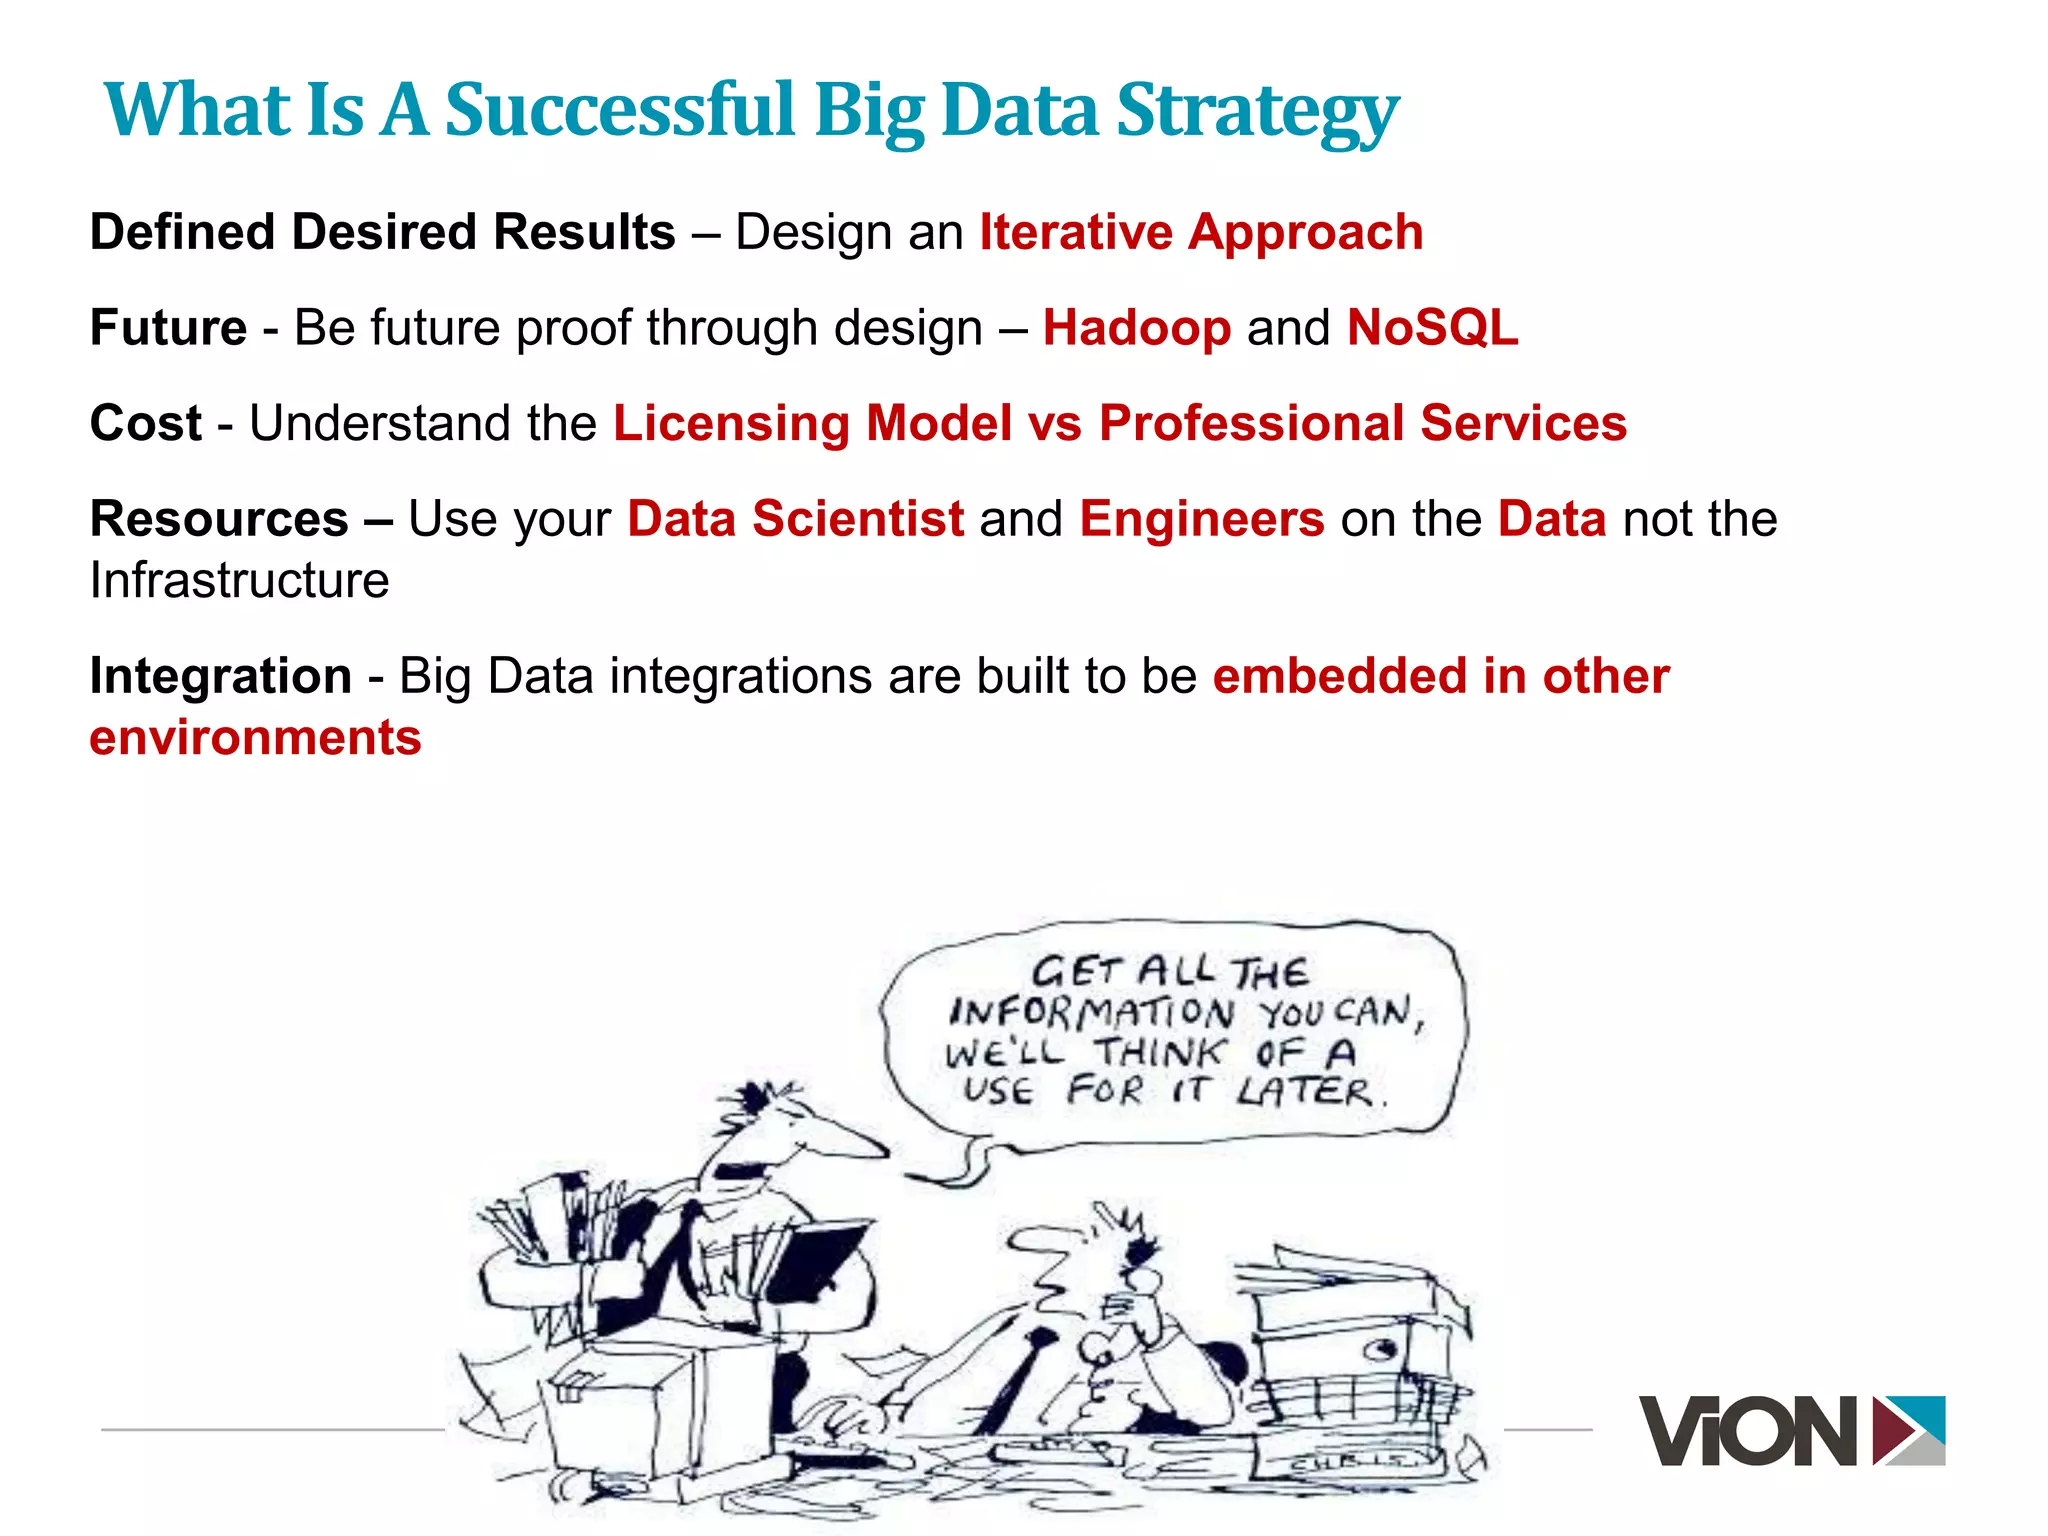
Rodney Hite
Lightning Round
Product Manager,
Big Data Solutions,
ViON
Analytics in the Age of Big Data
Big Data #1
“Most Ambiguous Terms”
Global Language Monitor
Big Data Is Not New
4
1976 – physical disk formats:
hard-sectored 90 KB and soft-
sectored 110 KB
1983 - single-sided media, with
formatted capacities of 360 KB
1984 – double-sided media,
with formatted capacities of
720 KB
1986 - What became the most
common format, the double-
sided, high-density (HD) 1.44
MB disk drive.
The New “Big Data”
5
Gartner. In 2001, a Meta (now Gartner) report noted the increasing size of
data, the increasing rate at which it is produced and the increasing range
of formats and representations employed.
This report predated the term “Big Data” but proposed a three-fold
definition encompassing the “three V’s”: Volume, Velocity and Variety.
2008 - Apache Hadoop is an open-source software framework for storage
and large-scale processing of data-sets on clusters of commodity hardware.
6
Semantic Extraction
Sentiment Analysis
Entity Extraction
Link Analysis
Temporal Analysis
Geospatial Analysis
Time Event Matrices
Predictive Pattern Analysis
Video/Imagery Analytics
Machine Created - logs
Email
Video – Predator Surveillance
Audio – Phone recordings
Sensor - Weather
Social Media - Twitter
Databases – Structured Text
Reports – Semi-Structured Text
Documents – Unstructured Text
Graphs – Graph Dbs
Data Analytics
A new world of analytical possibilities is opened.
Data and Complexity
7
It’s All About the Data
Getting Value
8
Visualization Is A Critical Accelerator For Data Exploration
The Best Big Data integration technology allow visual exploration of data
independent of the type of data or the source from which it came
9
Gartner Hype Curve
10
What’s really new is the technology available that allows us to
make sense of the data.
Visualization versus Analytics
11
Data Visualization - data that is
available to those who know how to
get it and make it presentation
friendly and easier to digest by
your average audience member.
Data Analytics - is a multi-
dimensional discipline using
mathematics and statistics to
gain valuable knowledge from
data - data analysis.
Top 100 NFL Players of All Time
12
NFL Graphs
13
• Predictive Analytics used to determine probability of success based on
Down and Distance.
• Correlation Analytics conducted on Tom Brady’s individual statistics and
his affect on game outcome.
MLB Pitching Analysis
14
Analyze multiple data sources to include video analytics to maximize the
usage of the data providing valuable insight.
TruMedia's MLB analytics platform
Pitch Frequency Strikeout Pitches
Geospatial Analysis – Data Fusion
15
Data integration with mapping features allows interactive visualization of
data fusion with Geospatial and Temporal references.
Cyber Security Analysis
16
• Analysis to identify tactics, techniques and processes to identify,
isolate and eliminate risks to the environment.
• Discover actionable, often unforeseen, insight because the Semantic
Analysis highlights interdisciplinary relationships and unexpected data
combinations
Fraud Detection
Fraud involves cell phones, insurance claims, tax return claims, credit card
transactions etc
Combine historical and transactional data to detect fraudulent activity,
identify transactional behavior that indicates a high likelihood of illegal
activities.
17
Predictive Pattern Analytics
Analytical tool for predicting the location of future incidents
This analytic provides an awareness of the general situation, and additionally
it provides a series of tools for decision support
18
Investigations - Pattern of Life
19
• Pattern-of-life analysis is a method of surveillance specifically used for
documenting or understanding a subject’s habits.
• This information can then be used to predict future actions by the
subject(s) being observed.
Social Media Analysis – NLP & Entity Extraction
Advanced text analytics tools analyze the unstructured text to
gain understanding of the context, identify entities and their
relationships, conduct topic clustering, determine contextual
sentiment, and conduct time-event trending.
20
What Is A Successful Big Data Strategy
Defined Desired Results – Design an Iterative Approach
Future - Be future proof through design – Hadoop and NoSQL
Cost - Understand the Licensing Model vs Professional Services
Resources – Use your Data Scientist and Engineers on the Data not the
Infrastructure
Integration - Big Data integrations are built to be embedded in other
environments
Thank You!
Rodney Hite
Product Manager – Big Data
Rhite@vion.com
O: 571-353-6097/c: 919-604-0809

Internet of Things: Lightning Round, Hite

  • 1.
    Rodney Hite Lightning Round ProductManager, Big Data Solutions, ViON
  • 2.
    Analytics in theAge of Big Data
  • 3.
    Big Data #1 “MostAmbiguous Terms” Global Language Monitor
  • 4.
    Big Data IsNot New 4 1976 – physical disk formats: hard-sectored 90 KB and soft- sectored 110 KB 1983 - single-sided media, with formatted capacities of 360 KB 1984 – double-sided media, with formatted capacities of 720 KB 1986 - What became the most common format, the double- sided, high-density (HD) 1.44 MB disk drive.
  • 5.
    The New “BigData” 5 Gartner. In 2001, a Meta (now Gartner) report noted the increasing size of data, the increasing rate at which it is produced and the increasing range of formats and representations employed. This report predated the term “Big Data” but proposed a three-fold definition encompassing the “three V’s”: Volume, Velocity and Variety. 2008 - Apache Hadoop is an open-source software framework for storage and large-scale processing of data-sets on clusters of commodity hardware.
  • 6.
    6 Semantic Extraction Sentiment Analysis EntityExtraction Link Analysis Temporal Analysis Geospatial Analysis Time Event Matrices Predictive Pattern Analysis Video/Imagery Analytics Machine Created - logs Email Video – Predator Surveillance Audio – Phone recordings Sensor - Weather Social Media - Twitter Databases – Structured Text Reports – Semi-Structured Text Documents – Unstructured Text Graphs – Graph Dbs Data Analytics A new world of analytical possibilities is opened. Data and Complexity
  • 7.
  • 8.
    Getting Value 8 Visualization IsA Critical Accelerator For Data Exploration The Best Big Data integration technology allow visual exploration of data independent of the type of data or the source from which it came
  • 9.
  • 10.
    Gartner Hype Curve 10 What’sreally new is the technology available that allows us to make sense of the data.
  • 11.
    Visualization versus Analytics 11 DataVisualization - data that is available to those who know how to get it and make it presentation friendly and easier to digest by your average audience member. Data Analytics - is a multi- dimensional discipline using mathematics and statistics to gain valuable knowledge from data - data analysis.
  • 12.
    Top 100 NFLPlayers of All Time 12
  • 13.
    NFL Graphs 13 • PredictiveAnalytics used to determine probability of success based on Down and Distance. • Correlation Analytics conducted on Tom Brady’s individual statistics and his affect on game outcome.
  • 14.
    MLB Pitching Analysis 14 Analyzemultiple data sources to include video analytics to maximize the usage of the data providing valuable insight. TruMedia's MLB analytics platform Pitch Frequency Strikeout Pitches
  • 15.
    Geospatial Analysis –Data Fusion 15 Data integration with mapping features allows interactive visualization of data fusion with Geospatial and Temporal references.
  • 16.
    Cyber Security Analysis 16 •Analysis to identify tactics, techniques and processes to identify, isolate and eliminate risks to the environment. • Discover actionable, often unforeseen, insight because the Semantic Analysis highlights interdisciplinary relationships and unexpected data combinations
  • 17.
    Fraud Detection Fraud involvescell phones, insurance claims, tax return claims, credit card transactions etc Combine historical and transactional data to detect fraudulent activity, identify transactional behavior that indicates a high likelihood of illegal activities. 17
  • 18.
    Predictive Pattern Analytics Analyticaltool for predicting the location of future incidents This analytic provides an awareness of the general situation, and additionally it provides a series of tools for decision support 18
  • 19.
    Investigations - Patternof Life 19 • Pattern-of-life analysis is a method of surveillance specifically used for documenting or understanding a subject’s habits. • This information can then be used to predict future actions by the subject(s) being observed.
  • 20.
    Social Media Analysis– NLP & Entity Extraction Advanced text analytics tools analyze the unstructured text to gain understanding of the context, identify entities and their relationships, conduct topic clustering, determine contextual sentiment, and conduct time-event trending. 20
  • 21.
    What Is ASuccessful Big Data Strategy Defined Desired Results – Design an Iterative Approach Future - Be future proof through design – Hadoop and NoSQL Cost - Understand the Licensing Model vs Professional Services Resources – Use your Data Scientist and Engineers on the Data not the Infrastructure Integration - Big Data integrations are built to be embedded in other environments
  • 22.
    Thank You! Rodney Hite ProductManager – Big Data Rhite@vion.com O: 571-353-6097/c: 919-604-0809