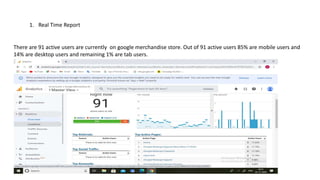
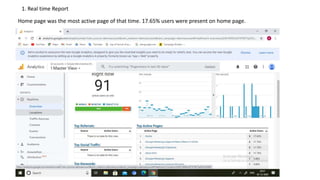
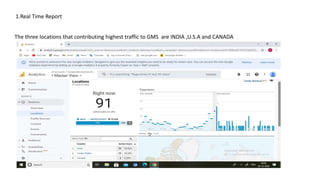
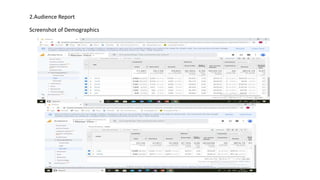
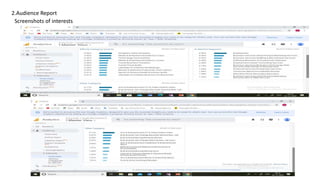
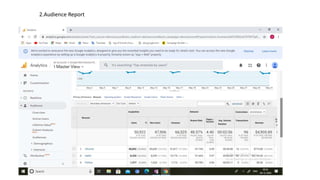
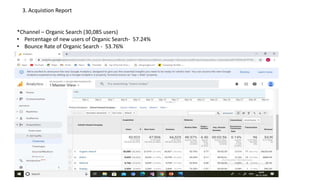
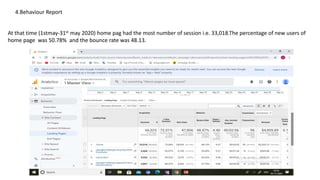
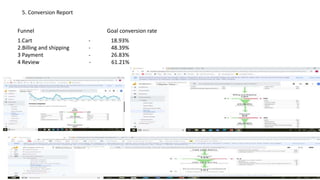
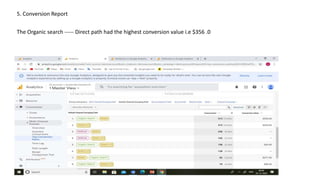
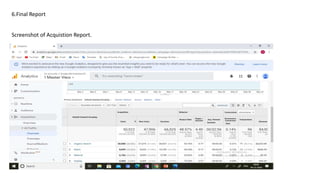
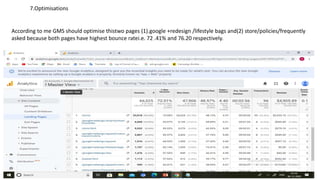
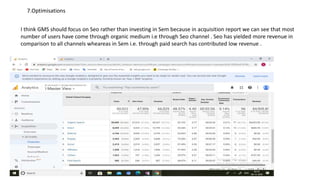
WEB ANALYTICS
Submitted by: Aman Bandhu
LIVE PROJECT
PART 1
1. Real Time Report
There are 91 active users are currently on google merchandise store. Out of 91 active users 85% are mobile users and
14% are desktop users and remaining 1% are tab users.
1. Real time Report
Home page was the most active page of that time. 17.65% users were present on home page.
1.Real Time Report
The three locations that contributing highest traffic to GMS are INDIA ,U.S.A and CANADA
2.Audience Report
Screenshot of Demographics
2.Audience Report
Screenshots of interests
2.Audience Report
User Persona
Name – John Doe
Occupation – Software developer
Age - 28
Income - $20k per month
Gender - Male
Location- New York , U.S.A
Interest: Loves to do shopping via online, watch movie online, Gadgets and Technology.
Device: Android mobile user
Personality traits : Passionate , Optimistic , Motivated.
Bio
John Doe is a single guy who is a software developer by profession. He lives in new York. He loves to do shopping and he is
also movie lover. He has interest in gadgets and always eager to buy new gadgets.
2. Audience Report
The number of users that were present on these three web browsers are
1. Chrome – 38,892
2. Firefox - 1,377
3. Safari - 8,320
• Revenue
1. Chrome - $715.80
2. Safari - $4190.09
3. Firefox - $0.0
• Bounce Rate
1 Chrome - 47.10%
2 Safari - 51.66%
3 Firefox - 55.78%
2.Audience Report
3. Acquistion Report
*Channel – Organic Search (30,085 users)
• Percentage of new users of Organic Search- 57.24%
• Bounce Rate of Organic Search - 53.76%
4.Behaviour Report
At that time (1stmay-31st may 2020) home pag had the most number of session i.e. 33,018.The percentage of new users of
home page was 50.78% and the bounce rate was 48.13.
5. Conversion Report
Funnel Goal conversion rate
1.Cart - 18.93%
2.Billing and shipping - 48.39%
3 Payment - 26.83%
4 Review - 61.21%
5. Conversion Report
The Organic search ----- Direct path had the highest conversion value i.e $356 .0
6.Final Report
In this demo account of Google merchandise store I have collected the data of may 2020(1st may-31st 2020). I have generated
different reports like audience report, acquisition report , behaviour report and conversion report with the help of google
analytics . With the help of google analytics I got to know about location of the users , people of which age group came to the
gms store mostly, which channel performed better, which page had the most users , which page was irrelevant to the users. I
also got to know about the interest of the users what they are looking for. Google analytics had helped me to find that most
numbers of users came from which country from 1st may to 31 may 2020. Google analytics helped to know about that users of
gms store were mostly male.
* Here are different reports of Google merchandise store from 1st may-31st may 2020
*Audience report – In this report we have seen the demographic of user. It has shown that during 1st-31st may users of gms
were mostly aged between 25-34 and they were mostly male. It has also shown that during that time most numbers of users
were from U.S.A.
*Behaviour Report – With the help of this report we got to know about which page’s content was most engaging. Users
found this page - /google+redesign/apparel more relevant to them because it has low bounce rate in comparision to the
pages.
6. Final Report
*Acquistion Report – Acquistion report has shown that most numbers of visitors came to GMS during 1st may -31st may 2020
through organic channel. i.e while searching on google.
* Conversion report –With the help of conversion report we have got to know that during 1st may -31st may 2020 organic
channel had the better conversion rate. With the help of conversion we also got to know about the funnel conversion value
of each funnel.
6.Final report
Screenshot of Audience Report
6. Final Report
Screenshot of Behaviour Report
6.Final Report
Screenshot of Acquistion Report.
6.Final Report
Screenshot of Conversion Report
7.Optimisations
According to me GMS should optimise thistwo pages (1).google +redesign /lifestyle bags and(2) store/policies/frequently
asked because both pages have highest bounce ratei.e. 72 .41% and 76.20 respectively.
7.Optimisations
I think GMS should focus on Seo rather than investing in Sem because in acquisition report we can see that most
number of users have come through organic medium i.e through Seo channel . Seo has yielded more revenue in
comparison to all channels wheareas in Sem i.e. through paid search has contributed low revenue .
7.Optimisations
If GMS want to target a particular demographic through email campaign to get new email users, they should focus on
people who are aged between 25-34 and they should target male rather than female because if we see the audience report
we will get to know that most new users are people who are aged between 25-34 and they are male.

Google Analytics - live Project.

  • 1.
    WEB ANALYTICS Submitted by:Aman Bandhu LIVE PROJECT
  • 2.
  • 3.
    1. Real TimeReport There are 91 active users are currently on google merchandise store. Out of 91 active users 85% are mobile users and 14% are desktop users and remaining 1% are tab users.
  • 4.
    1. Real timeReport Home page was the most active page of that time. 17.65% users were present on home page.
  • 5.
    1.Real Time Report Thethree locations that contributing highest traffic to GMS are INDIA ,U.S.A and CANADA
  • 6.
  • 7.
  • 8.
    2.Audience Report User Persona Name– John Doe Occupation – Software developer Age - 28 Income - $20k per month Gender - Male Location- New York , U.S.A Interest: Loves to do shopping via online, watch movie online, Gadgets and Technology. Device: Android mobile user Personality traits : Passionate , Optimistic , Motivated. Bio John Doe is a single guy who is a software developer by profession. He lives in new York. He loves to do shopping and he is also movie lover. He has interest in gadgets and always eager to buy new gadgets.
  • 9.
    2. Audience Report Thenumber of users that were present on these three web browsers are 1. Chrome – 38,892 2. Firefox - 1,377 3. Safari - 8,320 • Revenue 1. Chrome - $715.80 2. Safari - $4190.09 3. Firefox - $0.0 • Bounce Rate 1 Chrome - 47.10% 2 Safari - 51.66% 3 Firefox - 55.78%
  • 10.
  • 11.
    3. Acquistion Report *Channel– Organic Search (30,085 users) • Percentage of new users of Organic Search- 57.24% • Bounce Rate of Organic Search - 53.76%
  • 12.
    4.Behaviour Report At thattime (1stmay-31st may 2020) home pag had the most number of session i.e. 33,018.The percentage of new users of home page was 50.78% and the bounce rate was 48.13.
  • 13.
    5. Conversion Report FunnelGoal conversion rate 1.Cart - 18.93% 2.Billing and shipping - 48.39% 3 Payment - 26.83% 4 Review - 61.21%
  • 14.
    5. Conversion Report TheOrganic search ----- Direct path had the highest conversion value i.e $356 .0
  • 15.
    6.Final Report In thisdemo account of Google merchandise store I have collected the data of may 2020(1st may-31st 2020). I have generated different reports like audience report, acquisition report , behaviour report and conversion report with the help of google analytics . With the help of google analytics I got to know about location of the users , people of which age group came to the gms store mostly, which channel performed better, which page had the most users , which page was irrelevant to the users. I also got to know about the interest of the users what they are looking for. Google analytics had helped me to find that most numbers of users came from which country from 1st may to 31 may 2020. Google analytics helped to know about that users of gms store were mostly male. * Here are different reports of Google merchandise store from 1st may-31st may 2020 *Audience report – In this report we have seen the demographic of user. It has shown that during 1st-31st may users of gms were mostly aged between 25-34 and they were mostly male. It has also shown that during that time most numbers of users were from U.S.A. *Behaviour Report – With the help of this report we got to know about which page’s content was most engaging. Users found this page - /google+redesign/apparel more relevant to them because it has low bounce rate in comparision to the pages.
  • 16.
    6. Final Report *AcquistionReport – Acquistion report has shown that most numbers of visitors came to GMS during 1st may -31st may 2020 through organic channel. i.e while searching on google. * Conversion report –With the help of conversion report we have got to know that during 1st may -31st may 2020 organic channel had the better conversion rate. With the help of conversion we also got to know about the funnel conversion value of each funnel.
  • 17.
  • 18.
    6. Final Report Screenshotof Behaviour Report
  • 19.
    6.Final Report Screenshot ofAcquistion Report.
  • 20.
  • 21.
    7.Optimisations According to meGMS should optimise thistwo pages (1).google +redesign /lifestyle bags and(2) store/policies/frequently asked because both pages have highest bounce ratei.e. 72 .41% and 76.20 respectively.
  • 22.
    7.Optimisations I think GMSshould focus on Seo rather than investing in Sem because in acquisition report we can see that most number of users have come through organic medium i.e through Seo channel . Seo has yielded more revenue in comparison to all channels wheareas in Sem i.e. through paid search has contributed low revenue .
  • 23.
    7.Optimisations If GMS wantto target a particular demographic through email campaign to get new email users, they should focus on people who are aged between 25-34 and they should target male rather than female because if we see the audience report we will get to know that most new users are people who are aged between 25-34 and they are male.