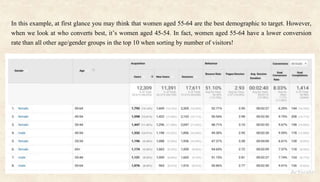
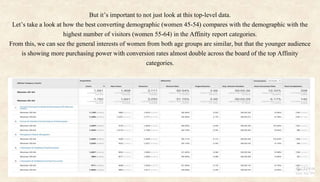
National Engineering College,
K.R.Nagar,Kovilpatti.
(An Autonomous Institution, Affiliated to Anna University, Chennai)
Department of Computer Science and Engineering
19CT08E WEB ANALYTICS AND DEVELOPMENT
Unit IV- Google Analytics
S.Kausalya,
ME CSE II Yr.
Tracking Unique Visitors
How to Understand Unique Visitors in Google Analytics
Users in Google Analytics, also known as unique visitors, is an invaluable tool for
measuring, tracking and understanding a site’s audience.
The official Google Analytics definition of this Web metric is: “Unique Visitors is the
number of unduplicated (counted only once) visitors to your website over the course of a
specified time period.”
The new user definition is: “Users that have had at least one session within the selected date
range. Includes both new and returning users.”
Tracking this number monthly is an industry standard for understanding if a site’s audience
is increasing, decreasing or staying even.
How to Start Tracking User Demographics?
This kind of information is not actually tracked automatically in an out-of-the box Google Analytics configuration. In
order to start collecting this information in Google Analytics, you need to:
1. Enable Advertising Reporting Features for your property
2. Enable the Demographics and Interests reports for the view
1. Enabling Advertising Reporting Features for Your Property
To enable Advertising Reporting Features for a web property, you need to have Edit permission for that property.
You can enable Advertising Reporting Features for a web property by using one of the following methods:
a) Modifying your property settings
b) Modifying your tracking code
a) Modifying your property settings
 Simply sign into your Analytics account, click Admin and navigate to the property for which you want to enable
the features.
 In the Property column, click Tracking Info, then Data Collection
 Set the Advertising Reporting Features toggle to ON
 Click Save.
b) Modifying your tracking code:
Modifying your property settings is the preferred, and most straightforward way to enable Advertising
Reporting Features, but if for whatever reason that option isn’t available to you, an alternative method is to
simply add a single line of code to your Universal Analytics code snippet. Between the ‘create’ and ‘send’
commands, add ga (‘require’, ‘display features’) ; similar to the example below:
2. Enabling the Demographics and Interests Reports for Your View
After enabling Advertising Reporting Features for your property, you still won’t see
Demographics data in your Google Analytics report. You also need to enable Demographics
and Interests reports. The easiest way to do this is as follows:
 Simply sign into your Analytics account, click Admin and navigate to the property for which
you want to use Demographic and Interests data.
 In the Property column, click Property Settings.
 Under Advertising Features, set Enable Demographics and Interests Reports to ON.
 Click Save.
How does Google Analytics know user Age and Gender (and other Demographic
info)?
By default, if a user is logged into their Google account, Google Analytics can access profile information like age
and gender. This info is available to Google Analytics when the user is logged into Google services including,
but not limited to:
• Google Chrome Browser
• YouTube
• Gmail
• Chromebook Laptop Devices
• Android Mobile Devices
Along with Google Account information, once you update Analytics to support Advertising Reporting Features,
Analytics collects Demographics and Interests data from the following sources:
1) Third-party Double Click cookie
2) Android Advertising ID
3) iOS Identifier for Advertisers (IDFA)
1) Third-party Double Click cookie
When this cookie is present on the users browser, analytics will collect any demographic and interests
information available in that cookie.
2) Android Advertising ID
On Android apps, when the Google Analytics tracking code is set to collect the Advertising ID, Google
Analytics generates an identifier based on that ID that includes demographics and interests
information associated with that users activity.
3) iOS Identifier for Advertisers (IDFA)
On iOS apps, when the Google Analytics tracking code is set to collect the IDFA, Google Analytics
generates an identifier based on the IDFA that includes demographic (and interests) information
associated with that users activity.
Age and Gender data is only available for a subset of your users
• If the DoubleClick cookie is not present on the users’ browser, they are not logged into a Google
Account and neither Advertising ID is present, Google Analytics can’t collect demographics and
interests information.
• Therefore demographics data (like age and gender) and interests data is generally only available for a
subset of your users – so adding Male users + Female users will not necessarily be equal to the total
Users figure in your reports.
• Example: Of a sample of 30 of clients, on average only 32% of user demographics are known by
Google Analytics.(In next page)
In this example, at first glance you may think that women aged 55-64 are the best demographic to target. However,
when we look at who converts best, it’s women aged 45-54. In fact, women aged 55-64 have a lower conversion
rate than all other age/gender groups in the top 10 when sorting by number of visitors!
What can we learn from this?
While the majority of visitors are from women aged 55-64 group, we may need to refine the marketing strategy to
drive more traffic from demographics that are more likely to convert.
This means:
 Looking at the websites targeted to better converting gender/age groups, and using display
advertising/editorial/advertorial to reach them (you can do this by creating an advanced segment in Google
Analytics that includes only the target gender/age groups, and looking at the referral traffic report to find the
sites already sending traffic, and use this information to look for similar sites).
 Using the same advanced segments to look at user behaviour by gender/age groups across your site and seeing
which pages drive the most engagement/conversions (these top performing pages can then be used as landing
pages for paid search, especially remarketing).
 Using Google Ads/social media ads to run campaigns to increase brand awareness among better converting
gender/age groups.
 Reducing paid media spend on women aged 55-64 (i.e through reduced bid modifiers in Google Ads)
Attending or running events that will appeal to better converting gender/age groups – if you’re contacted by a
company wanting you to exhibit, make sure your key demographics will be in attendance.
Interests reports
The Interests report can be used to build a picture of what else the people who are
interested in your products and services do online. This report is broken down into
three reports, which can be located in Audience > Interests.
• Affinity Categories: This report shows general interests of users who have visited
your site (i.e. hobbies and activities they enjoy), is very high in the funnel (the start
of the purchase process), and is, therefore, best used for raising brand awareness
• In-Market Segments: This is the next level of interest categories. This includes users
who are showing purchase intent and so can be utilized to reach those who are in the
consideration phase (for example, they may be narrowing down who they are ready
to buy from).
• Other Categories: This groups users based on what else they are browsing.
Again, on its own, this data is far too broad to glean much useful. You may assume that the best interests to target are
those looking at the in-market segment ‘Travel/Hotels & Accommodations’ and tailor your strategy to advertise on
travel sites, and create a category on your blog covering popular holiday destinations. However, once we start
applying demographic segments, that can all change.
What can we learn from this?
Using the advanced segment for the best converting demographic, ‘Women 45-54’ we can compare this to
all users, and other demographics.
We can now see this demographic is more heavily weighted toward home decor and home improvements
than all users, which may explain why they convert better than other demographics for this particular
business.
But it’s important to not just look at this top-level data.
Let’s take a look at how the best converting demographic (women 45-54) compares with the demographic with the
highest number of visitors (women 55-64) in the Affinity report categories.
From this, we can see the general interests of women from both age groups are similar, but that the younger audience
is showing more purchasing power with conversion rates almost double across the board of the top Affinity
categories.
• So, while it’s worthwhile still investing in women aged 55-64, marketing spend could be adjusted
accordingly (i.e. test pushing 25% more Google Ads budget toward women aged 45-54, and reducing by
25% for women aged 55-64) who show an interest in the top five shared Affinity categories to see how
this impacts conversions.
• This same principle can be applied to the other reports (In-market segments and Other categories), too.
• Knowing this, you can begin to build a better understanding of the customers who are likely to purchase
from your business, target them with more relevant content, and increase ROI.
Google analytics

Google analytics

  • 1.
    National Engineering College, K.R.Nagar,Kovilpatti. (AnAutonomous Institution, Affiliated to Anna University, Chennai) Department of Computer Science and Engineering 19CT08E WEB ANALYTICS AND DEVELOPMENT Unit IV- Google Analytics S.Kausalya, ME CSE II Yr.
  • 2.
    Tracking Unique Visitors Howto Understand Unique Visitors in Google Analytics Users in Google Analytics, also known as unique visitors, is an invaluable tool for measuring, tracking and understanding a site’s audience. The official Google Analytics definition of this Web metric is: “Unique Visitors is the number of unduplicated (counted only once) visitors to your website over the course of a specified time period.” The new user definition is: “Users that have had at least one session within the selected date range. Includes both new and returning users.” Tracking this number monthly is an industry standard for understanding if a site’s audience is increasing, decreasing or staying even.
  • 3.
    How to StartTracking User Demographics? This kind of information is not actually tracked automatically in an out-of-the box Google Analytics configuration. In order to start collecting this information in Google Analytics, you need to: 1. Enable Advertising Reporting Features for your property 2. Enable the Demographics and Interests reports for the view 1. Enabling Advertising Reporting Features for Your Property To enable Advertising Reporting Features for a web property, you need to have Edit permission for that property. You can enable Advertising Reporting Features for a web property by using one of the following methods: a) Modifying your property settings b) Modifying your tracking code a) Modifying your property settings  Simply sign into your Analytics account, click Admin and navigate to the property for which you want to enable the features.  In the Property column, click Tracking Info, then Data Collection  Set the Advertising Reporting Features toggle to ON  Click Save.
  • 5.
    b) Modifying yourtracking code: Modifying your property settings is the preferred, and most straightforward way to enable Advertising Reporting Features, but if for whatever reason that option isn’t available to you, an alternative method is to simply add a single line of code to your Universal Analytics code snippet. Between the ‘create’ and ‘send’ commands, add ga (‘require’, ‘display features’) ; similar to the example below:
  • 6.
    2. Enabling theDemographics and Interests Reports for Your View After enabling Advertising Reporting Features for your property, you still won’t see Demographics data in your Google Analytics report. You also need to enable Demographics and Interests reports. The easiest way to do this is as follows:  Simply sign into your Analytics account, click Admin and navigate to the property for which you want to use Demographic and Interests data.  In the Property column, click Property Settings.  Under Advertising Features, set Enable Demographics and Interests Reports to ON.  Click Save.
  • 8.
    How does GoogleAnalytics know user Age and Gender (and other Demographic info)? By default, if a user is logged into their Google account, Google Analytics can access profile information like age and gender. This info is available to Google Analytics when the user is logged into Google services including, but not limited to: • Google Chrome Browser • YouTube • Gmail • Chromebook Laptop Devices • Android Mobile Devices Along with Google Account information, once you update Analytics to support Advertising Reporting Features, Analytics collects Demographics and Interests data from the following sources: 1) Third-party Double Click cookie 2) Android Advertising ID 3) iOS Identifier for Advertisers (IDFA)
  • 9.
    1) Third-party DoubleClick cookie When this cookie is present on the users browser, analytics will collect any demographic and interests information available in that cookie. 2) Android Advertising ID On Android apps, when the Google Analytics tracking code is set to collect the Advertising ID, Google Analytics generates an identifier based on that ID that includes demographics and interests information associated with that users activity. 3) iOS Identifier for Advertisers (IDFA) On iOS apps, when the Google Analytics tracking code is set to collect the IDFA, Google Analytics generates an identifier based on the IDFA that includes demographic (and interests) information associated with that users activity.
  • 10.
    Age and Genderdata is only available for a subset of your users • If the DoubleClick cookie is not present on the users’ browser, they are not logged into a Google Account and neither Advertising ID is present, Google Analytics can’t collect demographics and interests information. • Therefore demographics data (like age and gender) and interests data is generally only available for a subset of your users – so adding Male users + Female users will not necessarily be equal to the total Users figure in your reports. • Example: Of a sample of 30 of clients, on average only 32% of user demographics are known by Google Analytics.(In next page)
  • 12.
    In this example,at first glance you may think that women aged 55-64 are the best demographic to target. However, when we look at who converts best, it’s women aged 45-54. In fact, women aged 55-64 have a lower conversion rate than all other age/gender groups in the top 10 when sorting by number of visitors!
  • 13.
    What can welearn from this? While the majority of visitors are from women aged 55-64 group, we may need to refine the marketing strategy to drive more traffic from demographics that are more likely to convert. This means:  Looking at the websites targeted to better converting gender/age groups, and using display advertising/editorial/advertorial to reach them (you can do this by creating an advanced segment in Google Analytics that includes only the target gender/age groups, and looking at the referral traffic report to find the sites already sending traffic, and use this information to look for similar sites).  Using the same advanced segments to look at user behaviour by gender/age groups across your site and seeing which pages drive the most engagement/conversions (these top performing pages can then be used as landing pages for paid search, especially remarketing).  Using Google Ads/social media ads to run campaigns to increase brand awareness among better converting gender/age groups.  Reducing paid media spend on women aged 55-64 (i.e through reduced bid modifiers in Google Ads) Attending or running events that will appeal to better converting gender/age groups – if you’re contacted by a company wanting you to exhibit, make sure your key demographics will be in attendance.
  • 14.
    Interests reports The Interestsreport can be used to build a picture of what else the people who are interested in your products and services do online. This report is broken down into three reports, which can be located in Audience > Interests. • Affinity Categories: This report shows general interests of users who have visited your site (i.e. hobbies and activities they enjoy), is very high in the funnel (the start of the purchase process), and is, therefore, best used for raising brand awareness • In-Market Segments: This is the next level of interest categories. This includes users who are showing purchase intent and so can be utilized to reach those who are in the consideration phase (for example, they may be narrowing down who they are ready to buy from). • Other Categories: This groups users based on what else they are browsing.
  • 15.
    Again, on itsown, this data is far too broad to glean much useful. You may assume that the best interests to target are those looking at the in-market segment ‘Travel/Hotels & Accommodations’ and tailor your strategy to advertise on travel sites, and create a category on your blog covering popular holiday destinations. However, once we start applying demographic segments, that can all change.
  • 16.
    What can welearn from this? Using the advanced segment for the best converting demographic, ‘Women 45-54’ we can compare this to all users, and other demographics. We can now see this demographic is more heavily weighted toward home decor and home improvements than all users, which may explain why they convert better than other demographics for this particular business.
  • 17.
    But it’s importantto not just look at this top-level data. Let’s take a look at how the best converting demographic (women 45-54) compares with the demographic with the highest number of visitors (women 55-64) in the Affinity report categories. From this, we can see the general interests of women from both age groups are similar, but that the younger audience is showing more purchasing power with conversion rates almost double across the board of the top Affinity categories.
  • 18.
    • So, whileit’s worthwhile still investing in women aged 55-64, marketing spend could be adjusted accordingly (i.e. test pushing 25% more Google Ads budget toward women aged 45-54, and reducing by 25% for women aged 55-64) who show an interest in the top five shared Affinity categories to see how this impacts conversions. • This same principle can be applied to the other reports (In-market segments and Other categories), too. • Knowing this, you can begin to build a better understanding of the customers who are likely to purchase from your business, target them with more relevant content, and increase ROI.