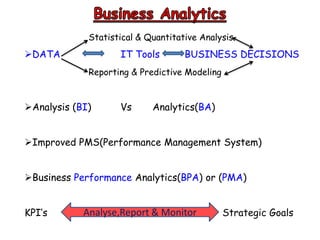
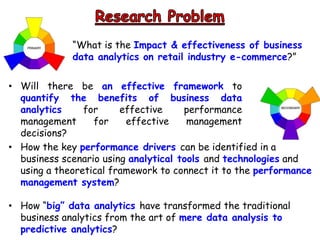
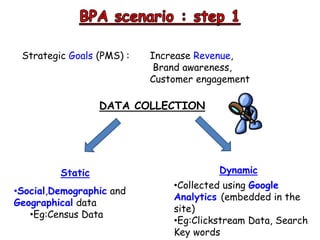
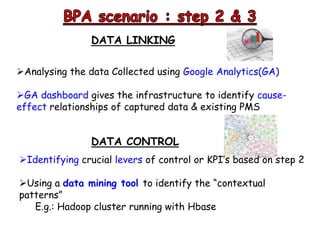
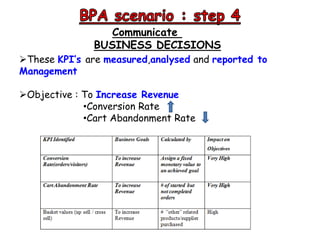
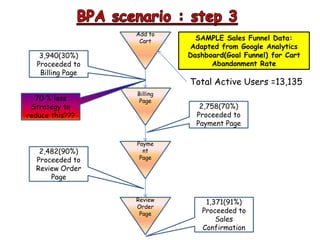
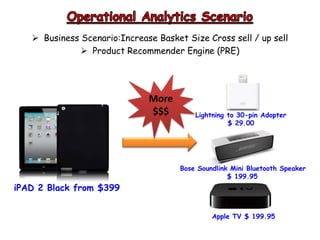
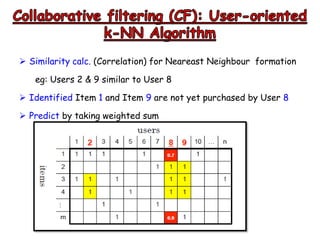
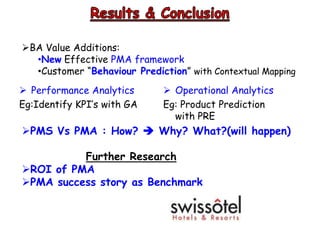
Introduction
Research Problem Identification, Framing and Methodology
Case study Company ,Data and Tools Used
Data Analytics: Case Study – 2 Scenarios
• Business Performance Analytics(BPA)
• Operational Analytics
Results and Conclusion
Further Research
Statistical & Quantitative Analysis
DATA IT Tools BUSINESS DECISIONS
Reporting & Predictive Modeling
Analysis (BI) Vs Analytics(BA)
Improved PMS(Performance Management System)
Business Performance Analytics(BPA) or (PMA)
KPI’s Strategic GoalsAnalyse,Report & Monitor
• Will there be an effective framework to
quantify the benefits of business data
analytics for effective performance
management for effective management
decisions?
“What is the Impact & effectiveness of business
data analytics on retail industry e-commerce?”
• How the key performance drivers can be identified in a
business scenario using analytical tools and technologies and
using a theoretical framework to connect it to the performance
management system?
• How “big” data analytics have transformed the traditional
business analytics from the art of mere data analysis to
predictive analytics?
Startup company based in Basel , Switzerland
http://www.cloudfeet.net/
Consultancy for B2B - IT/Supply Chain/Retail Sector
Current E-Commerce Value Chain
Manufacturer=>Supplier=>Distributor=>Retailer=>Customer
New Disrupted Value Chain
Manufacturer/Supplier=>Cloudfeet.net=>Retailer/Customer
Detailed Business Model is proprietary
Value Chain :Retailer  E –
commerce Website  Customer
Simon’s 4 levers of
control(systems) : Belief ,
Boundary, Diagnostic Control , ???
Simon’s 4th levers of control(systems) :Interactive Control
DATA COLLECTION
•Collected using Google
Analytics (embedded in the
site)
•Eg:Clickstream Data, Search
Key words
Static Dynamic
•Social,Demographic and
Geographical data
•Eg:Census Data
Strategic Goals (PMS) : Increase Revenue,
Brand awareness,
Customer engagement
Analysing the data Collected using Google Analytics(GA)
GA dashboard gives the infrastructure to identify cause-
effect relationships of captured data & existing PMS
DATA LINKING
DATA CONTROL
Identifying crucial levers of control or KPI’s based on step 2
Using a data mining tool to identify the “contextual
patterns”
E.g.: Hadoop cluster running with Hbase
These KPI’s are measured,analysed and reported to
Management
Objective : To Increase Revenue
•Conversion Rate
•Cart Abandonment Rate
Communicate
BUSINESS DECISIONS
Add to
Cart
Billing
Page
Payme
nt
Page
Review
Order
Page
3,940(30%)
Proceeded to
Billing Page
2,758(70%)
Proceeded to
Payment Page
2,482(90%)
Proceeded to
Review Order
Page
1,371(91%)
Proceeded to
Sales
Confirmation
Total Active Users =13,135
SAMPLE Sales Funnel Data:
Adapted from Google Analytics
Dashboard(Goal Funnel) for Cart
Abandonment Rate
70 % loss
Strategy to
reduce this???
 Business Scenario:Increase Basket Size Cross sell / up sell
 Product Recommender Engine (PRE)
iPAD 2 Black from $399
More
$$$ Lightning to 30-pin Adopter
$ 29.00
Bose Soundlink Mini Bluetooth Speaker
$ 199.95
Apple TV $ 199.95
 Similarity calc. (Correlation) for Neareast Neighbour formation
eg: Users 2 & 9 similar to User 8
 Identified Item 1 and Item 9 are not yet purchased by User 8
 Predict by taking weighted sum
 Performance Analytics
Eg:Identify KPI’s with GA
 Operational Analytics
Eg: Product Prediction
with PRE
BA Value Additions:
•New Effective PMA framework
•Customer “Behaviour Prediction” with Contextual Mapping
PMS Vs PMA : How?  Why? What?(will happen)
Further Research
ROI of PMA
PMA success story as Benchmark
•Bibilioteche Unibo
•Thesis “Impact and effectiveness of business performance
analytics on the retail industry”
•Google Scholar

Business Analytics in Retail E-Commerce

  • 2.
    Introduction Research Problem Identification,Framing and Methodology Case study Company ,Data and Tools Used Data Analytics: Case Study – 2 Scenarios • Business Performance Analytics(BPA) • Operational Analytics Results and Conclusion Further Research
  • 3.
    Statistical & QuantitativeAnalysis DATA IT Tools BUSINESS DECISIONS Reporting & Predictive Modeling Analysis (BI) Vs Analytics(BA) Improved PMS(Performance Management System) Business Performance Analytics(BPA) or (PMA) KPI’s Strategic GoalsAnalyse,Report & Monitor
  • 5.
    • Will therebe an effective framework to quantify the benefits of business data analytics for effective performance management for effective management decisions? “What is the Impact & effectiveness of business data analytics on retail industry e-commerce?” • How the key performance drivers can be identified in a business scenario using analytical tools and technologies and using a theoretical framework to connect it to the performance management system? • How “big” data analytics have transformed the traditional business analytics from the art of mere data analysis to predictive analytics?
  • 6.
    Startup company basedin Basel , Switzerland http://www.cloudfeet.net/ Consultancy for B2B - IT/Supply Chain/Retail Sector Current E-Commerce Value Chain Manufacturer=>Supplier=>Distributor=>Retailer=>Customer New Disrupted Value Chain Manufacturer/Supplier=>Cloudfeet.net=>Retailer/Customer Detailed Business Model is proprietary
  • 7.
    Value Chain :Retailer E – commerce Website  Customer Simon’s 4 levers of control(systems) : Belief , Boundary, Diagnostic Control , ???
  • 8.
    Simon’s 4th leversof control(systems) :Interactive Control
  • 9.
    DATA COLLECTION •Collected usingGoogle Analytics (embedded in the site) •Eg:Clickstream Data, Search Key words Static Dynamic •Social,Demographic and Geographical data •Eg:Census Data Strategic Goals (PMS) : Increase Revenue, Brand awareness, Customer engagement
  • 10.
    Analysing the dataCollected using Google Analytics(GA) GA dashboard gives the infrastructure to identify cause- effect relationships of captured data & existing PMS DATA LINKING DATA CONTROL Identifying crucial levers of control or KPI’s based on step 2 Using a data mining tool to identify the “contextual patterns” E.g.: Hadoop cluster running with Hbase
  • 11.
    These KPI’s aremeasured,analysed and reported to Management Objective : To Increase Revenue •Conversion Rate •Cart Abandonment Rate Communicate BUSINESS DECISIONS
  • 12.
    Add to Cart Billing Page Payme nt Page Review Order Page 3,940(30%) Proceeded to BillingPage 2,758(70%) Proceeded to Payment Page 2,482(90%) Proceeded to Review Order Page 1,371(91%) Proceeded to Sales Confirmation Total Active Users =13,135 SAMPLE Sales Funnel Data: Adapted from Google Analytics Dashboard(Goal Funnel) for Cart Abandonment Rate 70 % loss Strategy to reduce this???
  • 13.
     Business Scenario:IncreaseBasket Size Cross sell / up sell  Product Recommender Engine (PRE) iPAD 2 Black from $399 More $$$ Lightning to 30-pin Adopter $ 29.00 Bose Soundlink Mini Bluetooth Speaker $ 199.95 Apple TV $ 199.95
  • 14.
     Similarity calc.(Correlation) for Neareast Neighbour formation eg: Users 2 & 9 similar to User 8  Identified Item 1 and Item 9 are not yet purchased by User 8  Predict by taking weighted sum
  • 15.
     Performance Analytics Eg:IdentifyKPI’s with GA  Operational Analytics Eg: Product Prediction with PRE BA Value Additions: •New Effective PMA framework •Customer “Behaviour Prediction” with Contextual Mapping PMS Vs PMA : How?  Why? What?(will happen) Further Research ROI of PMA PMA success story as Benchmark
  • 16.
    •Bibilioteche Unibo •Thesis “Impactand effectiveness of business performance analytics on the retail industry” •Google Scholar