
Recommended
More Related Content
Similar to global warming: consequences, control measures, el nino & la nina, environmental monitoring, bioindicators
Similar to global warming: consequences, control measures, el nino & la nina, environmental monitoring, bioindicators (20)
More from Silpa Selvaraj
More from Silpa Selvaraj (14)
Recently uploaded
Recently uploaded (20)
global warming: consequences, control measures, el nino & la nina, environmental monitoring, bioindicators
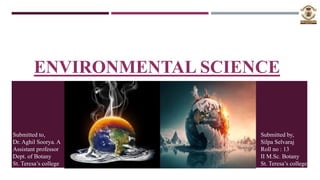
- 1. GLOBAL WARMING ENVIRONMENTAL SCIENCE Submitted to, Dr. Aghil Soorya. A Assistant professor Dept. of Botany St. Teresa’s college Submitted by, Silpa Selvaraj Roll no : 13 II M.Sc. Botany St. Teresa’s college
- 2. OVERVIEW Global warming and its consequences. El-Nino phenomenon. La-Nina phenomenon. Environmental monitoring. Bioindicators. 2
- 3. GREENHOUSE EFFECT Short wave radiation (0.2-4nm) from the sun reaches the earth’s surface unhindered. It is radiated from the earth as long wave radiation and the atmosphere absorbs a substantial portion of it and radiates energy back to it. This downward flux of the long wave radiation is called as greenhouse flux and it keeps the earth warm. Naturally occurring greenhouse gases in the atmosphere absorb these longer wave radiations, forming a blanket over the earth and controlling the escape of heat from the earth’s surface to outer space and keep our planet warm and hospitable. Thus the phenomenon of trapping the reradiating heat by greenhouse gases in the atmosphere is called as greenhouse effect. 3
- 4. In the absence of greenhouse gases in the atmosphere, temperatures on our planet would be much lower. The capacity of the atmosphere to keep the earth warm depend upon the concentration of greenhouse gases. The excessive concentration of greenhouse gases in the atmosphere will retain more IR, resulting in enhanced greenhouse effect. The consequent increase in the global mean temperature is called as global warming. 4
- 5. Behind the name… Greenhouse is a glass enclosed structure that is transparent to incoming radiations, but retains some of the outgoing longer wavelength radiation; allowing suitable temperatures for the growth of plants inside the greenhouse. 5
- 6. GREENHOUSE GASES Water vapour and CO2 are the most important naturally occurring greenhouse gases in the atmosphere. Methane, nitrous oxide, chlorofluorocarbons, ozone etc are other greenhouse gases, of these CFCs are solely man made. Among the different agents of climate change, water vapour, anthropogenic greenhouse gases and aerosols have larger roles. The abundance of greenhouse gases in the atmosphere is increasing due to industrial development, destruction of forests, land use, intensification of agriculture etc. 6
- 7. CARBON DIOXIDE The increase in CO2 concentration in the atmosphere has been largely the result of fossil fuel burning, deforestation and changes in the land use. Principal cause of increase in atmospheric CO2 has been the combustion of fossil fuels which releases about 21 billion tons of CO2 in the atmosphere. Other major source of CO2 emission is deforestation. Every year about 0.8% of total global forest area is cleared for other use. Forest clearing releases 0.3 – 2.6 Gt of carbon annually as CO2. In the northern hemisphere, CO2 conc. peaks in summer just before plant growth begins and falls off when the growing season is at its peak. This results from the net uptake of CO2 by vegetation during the growing season and its net release during the less favorable season. For the first time in human history, the conc. Of climate warming CO2 passed the milestone level of 400 parts per million on 9th may 2013. 7
- 8. METHANE Methane is the most abundant non CO2 GHG in the atmosphere today. Its conccentration has continued to increase since 2011 to an average global conc. 1911.8+_0.6 ppb as of 2022. It is very effective in causing global warming as it absorbs IR of different wavelengths than CO2. It is 21 times more powerful than CO2 in trapping heat in the atmosphere. Emission sources of CH4 ; landfills, livestock management, anaerobic respiration in soil of wetlands, rice agriculture, biomass burning etc. Fresh water wetlands produce methane due to incomplete decomposition of organic matter. Termites produce methane during digestion of cellulose. It also leaks from oil and gas exploration, released during coal mining. Anaerobic activity of methanogens in flooded rice fields, bogs, tundra, wetlands and lakes also release methane. 8
- 9. CHLOROFLUOROCARBONS CFCs (CFC-11,CFC-12,CFC-13) are highly stable and man made gaseous compounds of carbon and halogens. They make up four parts per billion of the atmosphere. Hydrochlorofluorocarbons and hydrofluorocarbons etc are potent GHGs which are increasing at rapid rates. CFC sources : air conditioners, fridges, cleaning of electronic components, production of plastic foams, propellants in aerosol spray cans etc. CFCs has a long residence time of 12 – 100 years in the atmosphere. They are 12000-15000 times more effective than CO2 at trapping IR. 9
- 10. NITROUS OXIDE It is a significant anthropogenic greenhouse gas. In 2022, its level rose by 1.24ppb to 335.7ppb. Main sources of this gas are agricultural activities, biomass burning, industrial activities, nylon production, burning of nitrogen rich fuels, nitrate contaminated ground water, deforestation etc. It is 310 times more powerful than CO2 at trapping heat in the atmosphere. 10
- 11. BLACK CARBON & OZONE Black carbon and ozone in the lower atmosphere are harmful air pollutants that have regional and global climate impacts. They disturb tropical rainfall and regional circulation patterns such as the Asian monsoon, affecting livelihoods of millions of people. Black carbon causes darkening of snow and ice surfaces, which increases their absorption of sunlight which along with atmospheric heating, exacerbates melting of snow and ice around the world including the Arctic and the Himalayas. 11
- 12. GLOBAL WARMING Global warming is the gradual increase in the earth’s temperature generally due to the greenhouse effect caused by increased levels of carbon dioxide, CFCs, and other pollutants. Global warming 12
- 13. CAUSES OF GLOBAL WARMING 1. DEFORESTATION Forests are being depleted for many domestic and commercial purposes. This had led to an environmental imbalance, thereby giving rise to global warming. 2. USE OF VEHICLES The use of vehicles even for a very short distance results in various gaseous emissions. Vehicles burn fossil fuels which emit large amount of CO2 and other toxins into the atmosphere resulting in temperature increase. 3. CHLOROFLUOROCARBON Excessive use of air conditioners and refrigerators emit CFCs into the atmosphere which mainly affects the ozone layer. Ozone layer protects the earth surface from the harmful UV rays emitted by the sun. CFCs have led to the ozone layer depletion making way for the UV rays thereby increasing the temperature of the earth. Global warming 13
- 14. 4. FOSSIL FUELS Massive use of fossil fuels is obviously the first source of global warming, as burning coal, oil and gas produces carbon dioxide - the most important greenhouse gas in the atmosphere - as well as nitrous oxide. 5. INDUSTRIAL DEVELOPMENT With the advent of industrialization, the temperature of the earth has been increasing rapidly. The harmful emissions from the factories add to the increasing temperature of the earth. In 2013, the intergovernmental panel for climate change reported that the increase in the global temperature between 1880 and 2012 has been 0.9 degree Celsius. The increase is 1.1 degree Celsius when compared to the pre industrial mean temperature. 6. AGRICULTURE Various farming activities produce CO2 and methane gas. These add to the greenhouse gases in the atmosphere and increase the temperature of the earth. Global warming 14
- 15. 7. INTENSIVE FARMING Another cause of global warming is intensive farming, not only with the ever-increasing livestock, but also with plant protection products and fertilizers. Cattle and sheep produce large amounts of methane when digesting their food, while fertilizers produce nitrous oxide emissions. 8. OVERPOPULATION An increase in population means more people breathing. This leads to an increase in the level of CO2, the primary gas causing global warming in the atmosphere. Global warming 15
- 16. 8. WASTE DISPOSAL Waste management methods like landfills and incineration emit greenhouse and toxic gases - including methane - that are released into the atmosphere, soil and waterways, contributing to the increase of the greenhouse effect. 9. MINING Modern life is highly dependent on the mining and metallurgical industry. Metals and minerals are the raw materials used in the construction, transportation and manufacturing of goods. From extraction to delivery, this market accounts for 5% of all greenhouse gas emissions. 16 Global warming
- 17. CONSEQUENCES OF GLOBAL WARMING 1. Increase in global temperature Global warming may directly increase the average global temperature. During the last hundred years, there was an increase of about 0.6 degree Celsius. It is predicted that if then input of greenhouse gases into the atmosphere continues at the present rate, their atmospheric concentration may get doubled by 2050. According to an ongoing temperature analysis led by the scientists at NASA’s Goddard Institute for Space Studies (GISS), the average global temperature on earth has increased by at least 1.1 degree celsius since 1880. Rise in global temperature may increase the incidence of many infectious diseases. Global warming 17
- 18. 2. Warmer oceans With an increase in average global temperature, oceans will become warmer, this will have a devastating effect on marine biodiversity and the lives and livelihoods of coastal communities. Fishing will be badly affected posing severe threat of food insecurity to mankind. Marine heat waves have doubled in frequency and have become more intense. The majority of the heatwaves took place between 2006 and 2015, causing widespread coral bleaching and reef degradation. In 2021, nearly 60% of world’s ocean surface experienced at least one spell of marine heatwaves. The UN Environment programme says that the world’s coral reefs could bleach by the end of the century if water continues to warm. Global warming 18
- 19. 3. Loss of biodiversity Rising temperatures increase the risk of irreversible loss of marine and coastal ecosystem. Today, widespread changes have been observed, including damage to coral reefs and mangroves that support ocean life, and migration of species to higher latitudes and altitudes where the water could be cooler. Latest estimates from the UN Educational, Scientific and Cultural Organization warn that more than half of the world’s marine species may stand on the brink of extinction by 2100. At a 1.1°C increase in temperature today, an estimated 60 percent of the world’s marine ecosystems have already been degraded.. A warming of 1.5°C threatens to destroy 70 to 90 percent of coral reefs, and a 2°C increase means a nearly 100 percent loss - a point of no return. Global warming 19
- 20. 4. Sea level rise Sea-level rise has accelerated in recent decades due to increasing ice loss in the world’s polar regions Latest data from the World Meteorological Organization shows that global mean sea-level reached a new record high in 2021, rising an average of 4.5 millimeter per year over the period 2013 to 2021. Together with intensifying tropical cyclones, sea-level rise has caused extreme events such as deadly storm surges, flooding, erosion and landslides, which are now projected to occur at least once a year in many locations. Such events occurred once per century historically. Moreover, the Intergovernmental Panel on Climate Change (IPCC) says that several regions, such as the western Tropical Pacific, the South-west Pacific, the North Pacific, the South-west Indian Ocean and the South Atlantic, face substantially faster sea-level rise. 20 Global warming
- 21. 5. Melting of glaciers and polar ice caps and rise in sea level Antarctica is losing ice mass (melting) at an average rate of about 150 billion tons per year, and Greenland is losing about 270 billion tons per year, adding to sea level rise. Data from NASA's GRACE and GRACE Follow-On satellites show that the land ice sheets in both Antarctica and Greenland have been losing mass since 2002. The ice sheets of Greenland and Antarctica store about two-thirds of all the fresh water on Earth. They are losing ice due to the ongoing warming of Earth’s surface and ocean. Meltwater coming from these ice sheets is responsible for about one-third of the global average rise in sea level since 1993. It can also cause abnormal changes in the pattern of oceanic water circulation and deep ocean currents. There will be release of huge amounts of trapped methane to the atmosphere in the polar region. 21 Global warming
- 22. 6. Thermal expansion of ocean water and sea level rise The warming of Earth is primarily due to accumulation of heat-trapping greenhouse gases, and more than 90 percent of this trapped heat is absorbed by the oceans. As this heat is absorbed, ocean temperatures rise and water expands. This thermal expansion contributes to an increase in global sea level. Temperature measurements of the sea surface, taken by ships, satellites and drifting sensors, along with subsurface measurements and observations of global sea-level rise, have shown that the warming of the upper ocean caused sea level to rise due to thermal expansion in the 20th century. 22 Global warming
- 23. 7. On humans Climate change is affecting the global economy. It is already shaking up social, health and geopolitical balances in many parts of the world. The scarcity of resources like food and energy gives rise to new conflicts. Rising sea levels and floods are causing population migration. Small island states are in the front line. The estimated number of climate refugees by 2050 is 250 million people. 23 Global warming
- 24. GREENHOUSE EFFECT AND GLOBAL WARMING Global warming is the considerable increase in earth's climatic temperature over a relatively short spell of time due to anthropogenic activities and greenhouse effect. Greenhouse effect has both positive and negative impacts. Its positive impact is that it maintains the heat balance and the average surface temperature of the earth within optimal limits. This, in turn, keeps the earth warm and thereby ensures a favourable climate for supporting and sustaining life. In the absence of greenhouse effect, earth may become ice-covered, with an abnormally low temperature. Its negative impacts are mainly due human activities, such as large scale burning of fossil fuels, world- wide deforestation, extensive mineral mining, intensive industrial and agricultural activities, etc. These activities contribute to an abnormal concentration of atmospheric greenhouse gases and thereby leads to intense greenhouse effect, termed enhanced greenhouse effect. This in turn, accelerates global warming. 24 Global warming
- 25. GLOBAL WARMING AND CLIMATE CHANGE The terms “global warming” and “climate change” are sometimes used interchangeably, but "global warming" is only one aspect of climate change. Global warming refers to the long-term warming of the planet. Global temperature shows a well-documented rise since the early 20th century and most notably since the late 1970s. Worldwide since 1880, the average surface temperature has risen about 1°C (about 2°F), relative to the mid-20th century baseline (of 1951-1980). This is on top of about an additional 0.15°C of warming from between 1750 and 1880. Climate change encompasses global warming, but refers to the broader range of changes that are happening to our planet. These include rising sea levels; shrinking mountain glaciers; accelerating ice melt in Greenland, Antarctica and the Arctic; and shifts in flower/plant blooming times. These are all consequences of warming, which is caused mainly by people burning fossil fuels and putting out heat-trapping gases into the air. 25 Global warming
- 26. CURRENT STATUS OF GLOBAL WARMING Global temperatures are likely to surge to record levels in the next five years, fuelled by heat-trapping greenhouse gases and a naturally occurring El Niño event, according to a new report issued by the World Meteorological Organization (WMO). There is a 66% likelihood that the annual average near-surface global temperature between 2023 and 2027 will be more than 1.5°C above pre-industrial levels for at least one year. There is a 98% likelihood that at least one of the next five years, and the five-year period as a whole, will be the warmest on record. A warming El Niño is expected to develop in the coming months and this will combine with human-induced climate change to push global temperatures into uncharted territory. Global mean temperatures are predicted to continue increasing, moving us away further and further away from the climate we are used to,” said Dr Leon Hermanson, a Met Office expert scientist who led the report. 26 Global warming
- 27. The WMO State of the Global Climate report 2022 focuses on key climate indicators – greenhouse gases, temperatures, sea level rise, ocean heat and acidification, sea ice and glaciers. It also highlights the impacts of climate change and extreme weather. Keypoints Drought, floods and heatwaves affect large parts of the world and the costs are rising. Global mean temperatures for the past 8 years have been the highest on record. Sea level and ocean heat are at record levels – and this trend will continue for many centuries. Antarctic sea ice falls to lowest extent on record. Europe shatters records for glacier melting. 27 World Meteorological Organization STATE OF GLOBAL CLIMATE CHANGE Global warming
- 28. From mountain peaks to ocean depths, climate change continued its advance in 2022. Droughts, floods and heatwaves affected communities on every continent and cost many billions of dollars. Antarctic sea ice fell to its lowest extent on record and the melting of some European glaciers was, literally, off the charts. The State of the Global Climate 2022 shows the planetary scale changes on land, in the ocean and in the atmosphere caused by record levels of heat-trapping greenhouse gases. For global temperature, 2015-2022 were the eight warmest on record despite the cooling impact of a La Niña event for the past three years. Melting of glaciers and sea level rise - which again reached record levels in 2022 - will continue for up to thousands of years. 28 Global warming
- 29. CONTROL MEASURES AGAINST GLOBAL WARMING Recycle more The aim is to cut down the amount of carbon dioxide released in the environment. If you even recycle half of the waste produced at home, you can save up to 2000 pounds of CO2 every year. Drive less Air pollution is one of the major factors that lead to an increase in greenhouse gases. Minimise the use of cars and make use of public transportation. Try walking, biking or carpooling whenever possible. If you reduce the driving hours, you will end up saving one pound of CO2 for every mile. Plant trees Deforestation plays an important role in global warming and climatic changes. Planting trees is helpful as they absorb carbon dioxide from the atmosphere and regulate the climate. Hence, there is a dire need to plant more trees because a single tree can absorb one ton of CO2 in its lifetime. 29 Global warming
- 30. Switch to renewable energy One of the most effective ways to prevent global warming is to start using renewable energy sources such as solar, geothermal, wind and biomass, and stop using fossil fuels. Use renewable energy resources to supply power to your home. Use energy-efficient devices By investing in energy-efficient devices such as bulbs, LED lights or solar-powered shower system, you can reduce the energy consumption and help in the production of clean energy. It is not only the cheapest way to reduce greenhouse gas emissions but it also reduces the amount of carbon dioxide released in the atmosphere. Use less hot water You can save 500 pounds of CO2 per year if you switch to cold showers and stop using hot water to wash clothes. Try installing energy-efficient geysers that consume less energy. 30 Global warming
- 31. Turn off electronic devices Ensure turning off your electronic devices such as television, computer, stereo, music player when not in use. This can help in saving fuel that is used to generate electricity which in turn can reduce thousand tons of carbon dioxide released in the atmosphere. Spread awareness Speak up about global warming, its consequences, causes and what steps we can take to prevent global warming with your friends, family and colleagues. Use the power of social media to voice out your concerns about climate change. 31 Global warming
- 32. EL-NINO & LA-NINA El Nino can be understood as a natural phenomenon wherein the ocean temperatures rise especially in parts of the Pacific Ocean. El Nino(the child) is a Spanish word. This is due to the fact that this current starts to flow around during Christmas and hence the name referring to baby Christ. Another natural phenomenon, similar to El Nino is La Nina(little girl). It is termed as opposite of the phenomenon of El Nino as it results in the ‘cooling’ of the ocean water in parts of the Pacific Ocean. Both of them also result in changes in atmospheric conditions along with oceanic changes. 32
- 33. HISTORY During the 17th century, some fishermen living in the South America noticed that in the month of December, the temperature of the ocean rose significantly. The heat increases every 5-6 years. During this period, the quantity of fish caught would be low. This phenomenon is called El-Nino in Spanish, which means little boy as this phenomenon happens around Christmas. Around the beginning of the 20th century scientists found that this phenomenon affects the climate of the entire world. El-Nino is a phenomenon that lasts for 9-12 months, that recurs between 2-7 years. This phenomenon starts at the south side of the Pacific ocean, just below the equator. El-Nino & La-Nina 33
- 34. DURING NORMAL CONDITIONS… Equatorial climes get a lot of sunlight and are very hot places. There are certain types of constant winds in that area called trade winds. Since the pacific ocean gets good sunlight near the equator, the water there is very warm. Here, the trade winds are constantly blowing from east to west. Hence the hot ocean water also move similarly from east to west that is, from Southern America to Australia and Asia. This warm water gets concentrated near Australia and Asia and this is called as Western Pacific pool. Due to western pacific pool, the warm water vaporizes and cause plenty of rain in Australian and Asian regions. 34 El-Nino & La-Nina
- 35. While the warm water moves from S. America to Australia and Asia, the cold water from the ocean bed flows to the surface. It is called upwelling. Along with this cold water, phytoplankton comes up and as a result a lot of fishes start to come to that region. This is very beneficial for the fishing industry in S. America The warm water that flows away from the S. American region lowers the temperature at the coast and makes it cold. This creates a high pressure in that region, making it arid and dry during the normal times. 35 El-Nino & La-Nina
- 36. DURING EL-NINO During El-Nino, there is a disruption happening in the direction of the trade winds. When El-Nino kicks in, the trade winds become weak. As a result, less amount of warm water flows away from the coast of S. America towards Australia and Asia and also the water in this coast gets warmer than usual. The western pacific pool is not formed in the western region. The warm waters caused rains in Australia and Asia. But as El-Nino stops or decreases the flow of water, it causes significant reduction in the availability of rains in Australia and Asia. This creates a dry climate and drought conditions in this areas. During normal climate, India gets monsoon rains. When El-Nino happens, monsoons in India get delayed and gets weaker, causing droughts and famine. 36 El-Nino & La-Nina
- 37. In S. America, more amount of warm water gets accumulated, this results in heavy rainfall. It results in floods and damages there. Example; During 1997-98, El-Nino was very powerful and countries like Peru were badly affected by floods. As there is no movement of the warm waters, upwelling does not occur- no phytoplankton in the surface water- which affected the availability of fish very badly. El-Nino causes disruption throughout the world. Some El-Ninos may be powerful, but some may be mild. 37 El-Nino & La-Nina
- 38. 38
- 39. LA-NINA It means ‘little girl’ and the mechanism is exactly opposite to El-Nino. Happens when the trade winds get stronger, more warm water flows from east to west. It results in huge floods in western regions. In S. America, usually dry weather is present, due to La-Nina, the weather gets much drier and can lead to drought. Upwelling increases resulting in plenty of fish. 39 El-Nino & La-Nina
- 40. LA-NINA 40
- 41. ENSO – EL-NINO SOUTHERN OSCILLATION Like the movement of a pendulum, El-Nino and La-Nina keep coming back and forth one after the other, creating a sequence of contrasting weather patterns. Hence it is called as El-Nino Southern Oscillation. 41 El-Nino & La-Nina
- 42. WHY ARE METEOROLOGISTS SAYING THAT EL-NINO IS LIKELY TO COME BY THE END OF THE YEAR? National Oceanic and Atmospheric Administration (NOAA) Have been studying the El-Nino phenomenon in the Pacific ocean, using precise observations at regular intervals. According to their studies, La-Nina has been around since 2022 and is waning in strength. At present the climate is close to normal. From here onwards there is high probability of EL-Nino making an entry as the climatic conditions are getting favorable for it. According to NOAA’s calculations, there is 60% chance of occurrence of El-Nino by the end of the year 2023. Yet another reason for this surmise is- in the history recorded so far, the maximum gap between two El-Ninos has been 4 years. The previous one was in 2018-19. In India, monsoon got delayed this year and there were heat waves sweeping across different parts of the country. This usually happens during El-Nino. 42 El-Nino & La-Nina
- 43. Impact on Indian Agriculture: Weak Monsoon for India: The formation of an El Nino in May or June 2023 resulted in weakening of the southwest monsoon season, which accounts for roughly 70% of total rainfall in India and on which most farmers still rely. Sporadic increase in rainfall: Sub-seasonal influences, such as the Madden-Julian Oscillation (MJO) and monsoon low-pressure systems, can temporarily increase rainfall in some areas, as shown in 2015. Drought: Typically, El Nino causes drought. El Nino has previously produced drought or a weak southwest monsoon in the country. A bad monsoon could have an impact on the growth of Kharif crops. Paddy, a water guzzler, groundnuts, and pulses are the crops most likely to suffer from a severe El Nino. Cotton and sugarcane crops may suffer as well. 43 El-Nino & La-Nina
- 44. ENVIRONMENTAL MONITORING Environmental monitoring uses tools that identify and analyze environmental conditions to assess the impact an activity has on the environment. 44 Environmental monitoring is used to observe a particular environment’s overall quality, environmental parameters, and the impact an activity may have. Eg ; building infrastructure or waste removal. The key objective of environmental monitoring is to manage and minimize the impact an activity has on an environment, following the laws and regulations in that area. It involves analyzing the environment with tools to obtain accurate results which are then published in risk and impact assessment reports.
- 45. WHY IS ENVIRONMENTAL MONITORING IMPORTANT? After the IPCC sixth assessment report stated that many countries are not prepared for climate impacts, environmental monitoring is now more important than ever. It is essential to understand the complexity of the environment, and highlight any risks or harmful effects an organization’s activity has on an environment and to human health. Environmental monitoring applications Water supplies Managing hazardous/radioactive waste. Understanding pollution sources. Protection of natural resources. Weather forecasting. Economic development. Protecting endangered species. Understanding global climate change. 45 Environmental monitoring
- 46. TYPES OF ENVIRONMENTAL MONITORING Air/Atmospheric monitoring Air pollutants harm the environment and human health. Some air pollutants are also known to degrade infrastructure including cultural buildings, therefore it is essential to monitor the air quality, following national and international air quality regulations. Can be monitored in real time by connecting software to sensors(temperature sensors, humidity sensors, CO2 sensors, oxygen sensors)located in an area of choice. These sensors measure levels and report main pollutants in the sir like particulate matter, nitrogen dioxide, carbon monoxide, sulfur dioxide etc. Air quality can also be measured manually with stations that collect air particles for a period of time before being measured. By gathering continuous data, governments and other authorities can make amendments to environmental policies. 46 Environmental monitoring If you are wanting to open a business operation, you will need to complete an environmental impact assessment to assess the impact your business may have on the environment. Depending on which sector you work in, will determine which environmental monitoring you will need to implement.
- 47. Water monitoring All bodies of water must be monitored, as water is essential to life on earth. It must be clean, drinkable, safe and sanitary. Water bodies must also be clean so that marine life and biodiversity can thrive. Water can be measured in real time by connecting softwares to sensors located in water bodies. These sensors can communicate when thresholds are reached for example; dissolved oxygen, turbidity, bioindicators, nitrates, pH, chemical contamination and water temperature. Water samples can also be collected manually and sent to a lab. Measuring the conductivity in water is also significant, as water quality can be indirectly measured using a conductivity probe. Conductivity determines how many contaminants exist in the water and have the ability to transmit electricity. 47 Environmental monitoring
- 48. Noise monitoring Noise can be monitored both for sea life and on land. In the sea, cetaceans use noises as we use our eyes. For example, if there is too much noise pollution, whales cannot communicate which puts them in danger. On land, noise can disrupt wildlife’s natural habitats and the quality of life for humans. Noise pollution can be monitored on land and sea using a sound level meter(SLM), integrated sound level meters (ISLM), Noise dosimeters etc. Softwares are connected to sensors that report real time noise levels. Noise level thresholds are set and determined beforehand so organizations know how much noise can be made in a certain area. Sinay is an agency currently in the process of developing underwater noise monitoring software and aerial noise monitoring software. 48 Environmental monitoring
- 49. BIOINDICATORS A bioindicator is a living organism that gives us an idea about the health of an ecosystem. Some organisms are very sensitive to pollution in their environment, so if pollutants are present, the organism may change its morphology, physiology or behavior or it could even die. Such organisms can be monitored for changes that may indicate a problem within their ecosystem. Bioindicators can be plants, animals or micro-organisms. Plant communities are more reliable indicators than individual plants. Large species(steno species) – better indicators than small species(eury species). 49
- 50. Characteristics of Bioindicators The identification of any organism, species or process as an ideal bioindicator requires possession of certain characteristics such as: It should be widely distributed. It should be highly abundant in a certain environment. It should be site specific and highly sensitive. 50 Bioindicators
- 51. It should accumulate and concentrate the toxin to measurable levels. It should possess a low genetic and ecological variability It should be cost effective and robust while handling. It’s sampling, sorting as well as storage should be simple. Itshould have an environmental significance and economic importance. 51 Bioindicators
- 52. Classification of Bioindicators Bioindicators can be classified into different categories on the basis of: Aim of bioindication. Application of bioindicators. On the basis of International Union of Biological Sciences (IUBS). 52 Bioindicators
- 53. 53 Bioindicators
- 54. Based on aim of bioindication i. Early warning indicators: The bioindicators which can show the first signs of disturbance in the environment are called early warning indicators. These reveal signs before most other species are affected since they have very quick and sensitive responses to any environmental change. For e.g ants. ii. Compliance indicators: The bioindicators which help in confirming the accomplishment of maintenance or restoration goals are known as compliance indicators. For example, measurement of fish characteristics is a bioindicator for the sustainability of the population or community as a whole. iii. Diagnostic indicators: The indicators which help in the examination of the detected environmental changes or disturbances are known as diagnostic indicators. These indicators are generally measured on the individual or sub organismal level. iv. Accumulation indicators: The bioindicators which help in studying the effects on different biological organization levels are known as accumulation indicators. For e.g. mosses, lichens, etc. 54 Bioindicators
- 55. Based on different applications of bioindicators i. Environmental bioindicators: these refer to the species which respond to any disturbance in the environment and thus reveal the signs of any environmental change or disturbance. They help in the diagnosis of the environmental status for making any environmental policy. For e.g. animals, macro-invertebrates, sentinels etc. ii. Ecological bioindicators: The species which are sensitive to fragmentation of the habitat, pollution or other disturbances or stresses in the environment are called ecological indicators. For e.g. lichens, plant indicators etc. iii. Biodiversity bioindicator: The species which are the indicators for measurable parameters of biodiversity such as genetic parameters, landscape parameters, etc. and represent the species richness of a community are known as biodiversity bioindicators. For e.g. animals, plants and microbial indicators. 55 Bioindicators
- 56. Classification of bioindicators on the basis of International Union of Biological Sciences (IUBS) The International Union of Biological Sciences (IUBS) has divided bioindicators into following six groups after recognizing the importance of bioindicators in monitoring environmental changes: Microbiology Botany Zoology Cell Biology and Genetics Comparative Physiology Hydrobiology 56 Bioindicators
- 57. BOTANY A. Lower plants Lower plants as bioindicators include a wide range of lichens, algae, fungi (leaf yeasts), etc. The tolerance level or resistance towards a substance in an environment varies with species. For example, lichens are considered ideal bioindicators or monitoring agents due to their vulnerability and resilience to different environmental effects. Some lichens can bloom only in the fresh or unpolluted air while some of their species are resistant even to much polluted air. The lichen Lechanora is good biological indicators of a wide spectrum of the environment. The lichen thalli indicate the presence of sulphur dioxide and fluorine in the atmosphere. The presence of some radionuclides such as cesium-137, strontium-30 released during nuclear explosions, in the environment can also be monitored using lichens. The lichen thalli are able to absorb fluorine and heavy metals including lead even when they are dead. 57 Bioindicators
- 58. Lichens generally thrive on rocks and trees surfaces or soil and do not have roots and cuticle. They attain all their nutrients directly from the atmosphere rather than from the soil. They are such ideal monitoring agents because of their extreme sensitivity to the toxins present in the air as well as due to their high surface area to volume ratio which further leads to the accumulation of toxins or contaminants from the air . The lichens are also considered because of being cost effective and inexpensive agents in the evaluation of air pollution when compared to most of the physical and chemical monitors. Various algae are too used in environmental monitoring such as Enteromorpha for monitoring the water quality of estuaries, Cladophora and Stigeoclonium for heavy metal contamination of water, Chlorella for monitoring the presence of toxic substances in water bodies. Skeletonema costatum, Pavlova lutheri etc. for the indication of oil pollution, etc. 58 Bioindicators
- 59. B. Higher plants Air pollution is monitored using some sensitive species whereas some tolerant (indicator) species are used for the determination of soil conditions. Plants also serve as indicators of presence of various heavy metals such as Al, Ca, Co, Cu, Zn, Cd, Pb, Hg, Mo, Mn, Ag, etc. and have also been used to detect and monitor gaseous pollutants such as sulphur dioxide(SO2), ozone(O3), nitrogen oxides, etc. Anthoxanthum spp is tolerant to zinc. Festuca is tolerant to lead. 59 Festuca Anthoxanthum Bioindicators
- 60. The plants serve as ideal monitoring agents due to various phenotypic, metabolic and anatomical changes in the plant system and the type of changes help in the determination of the nature of compounds to which the plants are exposed. The damage caused on exposure to ozone gas can be reflected by the weathered flakes of tobacco or chlorotic flakes of pine needle. The damage caused by peroxyacetyl nitrate can be indicated by the collapse, glazing and bronzing of leaf cells in plants. Some of the physiological and anatomical changes in plants include the effects on the nature of stomata, pigmentation, chlorosis and bleaching. For example, the inhibition of photosynthesis due to fluorine damage, bleaching of perianth and stamen injury by mercury poisoning, etc. 60 Bioindicators
- 61. TYPES OF BIOINDICATORS 1. Indicators of potential productivity of land Forests serve as good indicators of land productivity. Vegetative growth of trees of Quercus species (Quercus marilandica, Quercus stellata) is comparatively poor on low land or sterile sandy soil than the normal soil in which they grow under natural conditions. 2. Indicators of agriculture Native vegetation of a particular region is the safe criterion of agricultural possibilities. Thus plants growing under natural conditions provide information on capabilities of land for crop growth than those obtained through meteorological data or soil analysis. 61 Bioindicators
- 62. 3. Indicators of climate Plant communities characteristic of a particular region provide information on the climate of that area. Evergreen forests indicate high rainfall in winter and in summer. Sclerphyllous vegetation indicate heavy rainfall in winter and low rainfall during summer. Grasslands indicate heavy rainfall during summer and low rainfall during winter. Xerophytic vegetation indicate a very low or no rainfall in the year. 62 Bioindicators
- 63. 4. Indicators of soil type and other soil characteristic Luxuriant growth of some taller and deeply rooted grasses like Psoralea indicates a sandy loam type of soil. Presence of grasses Andropogon indicates sandy soil. Rumex acetosella indicates an acid grassland soil. Spermacoce stricta indicate iron rich soil. Heliotropium supinum grow better in low lying land. Shorea robusta, Cassia obtusifolia, Geranium species indicate proper aeration of soil. Grasses like Saccharum spontaneum grow in poorly drained soil. Capparis spinosa, Carissa spinaum indicates intense soil erosion. 63 Bioindicator s
- 64. 5. Indicators of fire Some plants like Agrostis hiemalis, Epilobium spicatum, Pinum contorta, Pteris, aquilina etc. dominate in area destructed by fires. Pteridium spp. in particular indicate burnt and highly disturbed coniferous forests. 6. Indicators of petroleum deposits Some protozoans as Fusilinds indicate petroleum deposits in the area. 7. Indicators of adequate oxygen in water Burrowing may fly (Hexagenia sp.) indicates proper oxygen regimes in water. 64 Bioindicators
- 65. 8. Indicators of pollution Plants like Utricularia, Chara, Wolffia etc prefer to grow in polluted waters. Bacteria like E.coli also indicate water pollution. Presence of diatoms in water indicate pollution by sewage. Movement of fish like Catla catla, Labeogoniu, L. bata, L. rohita etc. away from the water indicates industrial pollution of water. 9. Indicators of overgrazing Annual weeds and short lived perennials like Amaranthus, Chenopodium, Polygonum etc grow better in overgrazed areas. Frequent visits of the areas by animals like cattle, horses, sheeps, goats etc. also indicate that the area is under intense grazing. 65 Bioindicators
- 66. REFERENCES Mishra, D.D. (2008). Fundamental Concepts in Environmental Studies. S.Chand & Company Pvt Ltd. Sharma, P.D. (2009). Ecology and Environment. Rastogi Publications. Yadav, P.R., & Tyagi, R.(2006). Environmental Biotechnology. Discovery Publishing House. https://atlas-scientific.com/blog/types-of-environmental-monitoring. https://oceanservice.noaa.gov/facts/ninonina.html. https://public.wmo.int/en/media/press-release/global-temperatures-set-reach-new-records-next-five-years 66
- 67. THANK YOU 67