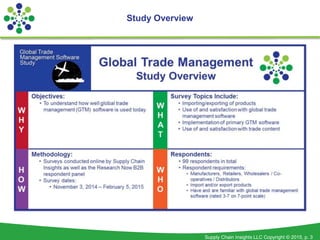
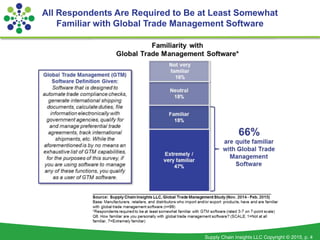
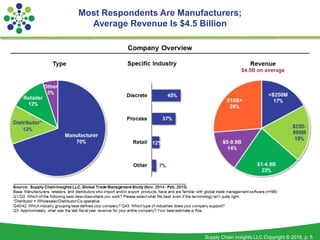
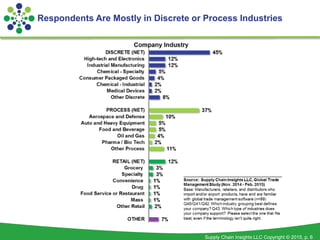
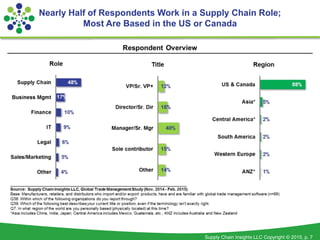
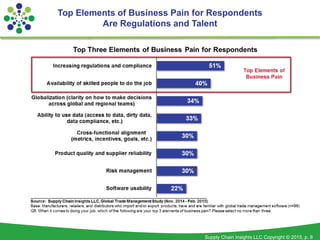
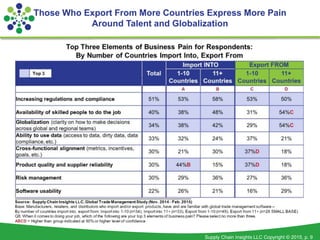
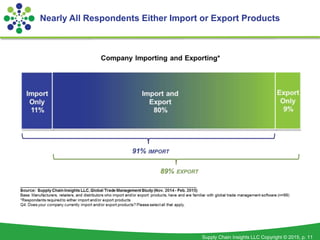
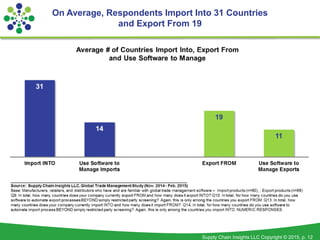
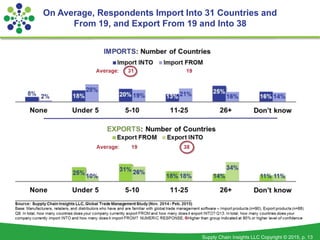
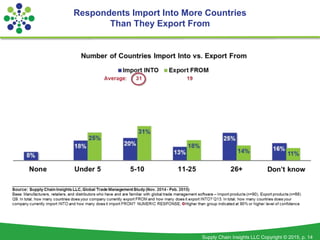
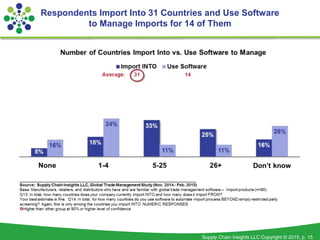
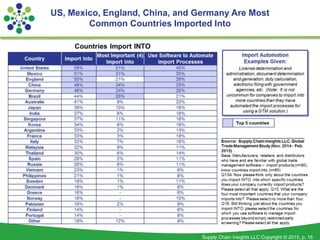
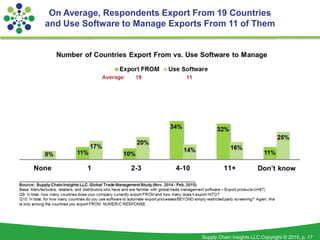
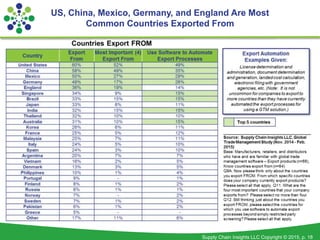
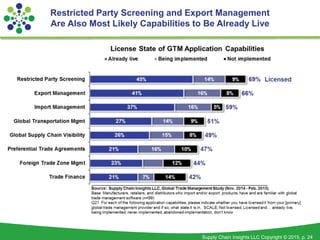
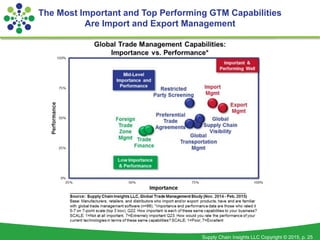
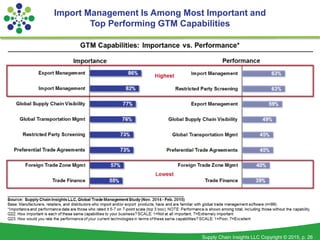
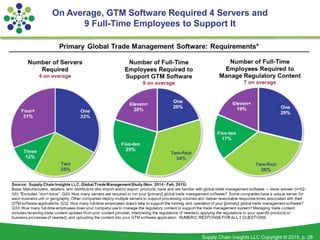
Executive Summary
Global trade is essential to growth, and it is growing more complex. Global Trade Management (GTM) software makes it easier to become a global shipper and ensures regulatory compliance. Success with GTM requires the careful selection and use of both the software and trade compliance content.
The average study respondent is a supply chain professional in North America working for a manufacturer with $4.5 billion in revenue. Over 90% of the respondents import and export goods; however, the software is only used to manage trade for 11 out of 19 of countries involved in exports. The top countries for the respondents to export and manage shipments from are the United States, China, Mexico, Germany, and England.
In the average company, there is not one solution; instead, the average company has solutions from three different providers. Unlike other software, there is a high satisfaction rate with GTM. In the study, 67% of users were satisfied with their GTM software, reporting a Return on Investment (ROI) of thirteen months with 70% of respondents stating that they had achieved a ROI.
In summary, GTM is a mature supply chain software with high satisfaction and a strong ROI. Here we share the results.
What Drives Inventory Effectiveness in a Market-Driven World? Summary ChartsLora Cecere
Survey Details: The research for this report was conducted from February 12 – October 8, 2015. Surveys were conducted among Manufacturers, Retailers, and Wholesalers/Distributors/Co-operatives with $250M+ in revenue and who use (and are familiar with) inventory optimization software (n=64). Respondents were evenly split between those using basic (ERP or ERP+APS) and advanced (software in addition to ERP/APS) software. All surveys were conducted by Supply Chain Insights.
Objective: To understand the impact of inventory optimization software on supply chain excellence. NOTE: inventory optimization software was defined as “any form of ERP (Enterprise Resource Planning), APS (Advanced Planned Software), or sophisticated inventory planning tools.”
Highlight: Companies who use advanced software are more likely to be satisfied with their software, to be effective at making inventory decisions and to drive a return on investment for their software.
Supply Chain Metrics That Matter: A Focus on the Chemical IndustryLora Cecere
Supply Chain Metrics That Matter is a series of reports published intermittently throughout the year by Supply Chain Insights LLC. Within the world of Supply Chain Management (SCM), each industry is unique. To help companies understand the differences, we share deep analysis in each report.
While we find it useful to understand the evolution of supply chain excellence by comparing industries, we feel the true stories of supply chain excellence can only be really understood by comparing what happened within a period by peer group. The goal of this series is to share these insights.
Imports & Exports Made Easier with Global Trade Management Software - 10 MAR ...Lora Cecere
Global trade is essential to growth, and it is growing more complex. Global Trade Management (GTM) software makes it easier to become a global shipper and ensures regulatory compliance. Success with GTM requires the careful selection and use of both the software and trade compliance content.
The average study respondent is a supply chain professional in North America working for a manufacturer with $4.5 billion in revenue. Over 90% of the respondents import and export goods; however, the software is only used to manage trade for 11 out of 19 of countries involved in exports. The top countries for the respondents to export and manage shipments from are the United States, China, Mexico, Germany, and England.
In the average company, there is not one solution; instead, the average company has solutions from three different providers. Unlike other software, there is a high satisfaction rate with GTM. In the study, 67% of users were satisfied with their GTM software, reporting a Return on Investment (ROI) of thirteen months with 70% of respondents stating that they had achieved a ROI.
In summary, GTM is a mature supply chain software with high satisfaction and a strong ROI. Here we share the results.
Supply Chain Metrics That Matter: A Focus on Medical Device Companies – 2016Lora Cecere
Executive Overview
Globalization. Compliance. Risk Management. Corporate Social Responsibility (CSR). Patient outcomes. Over the last decade the number and variety of supply chain initiatives exploded for the medical device leader. As a result, the supply chain group, and the related business imperatives, grew in importance.
Overall the medical device supply chain fared better through the decade than other industries, despite the fact that they are smaller, more focused companies trying to become global. (see Table C in the appendix for company size). On average the industry performance on operating margin and inventory turns was better in 2006 than 2015. The reason? The medical device supply chain entered the decade as a supply chain laggard. Through focused supply chain programs they were able to catch up to the level of other industries.
Table 6. Industry Snapshot of Performance
We hope this report can be a guide to help companies understand what is possible, and how supply chain metrics drive value. In the medical device industry we find most companies to be stuck. They have either regressed in supply chain performance or they are at the same point they were a decade ago. For many supply chain leaders that attend conferences, this may seem unfathomable. There is an industry belief that companies have implemented new technologies, and evolved processes, and driven improved balance sheet results. The goal of this report is to enable benchmarking and to spark a new conversation on the definition of supply chain excellence.
Supply Chain Metrics That Matter: A Focus on the High-Tech Industry - 2015Lora Cecere
Executive Summary: Current State of the High-Tech Industry
Globalization. Commodity inflation. Margin squeeze. Economic uncertainty. Warranty issues. Shortening product life cycles. Recalls. Labor arbitrage and outsourcing. The list of market pressures could go on and on, but one thing is clear: the high-tech industry was redefined over the course of the last decade. In Table 4 we show the progress of discrete industries for the periods of 2006-2014 and 2011- 2014. Notice there is more red (lack of progress) than green (progress) in the industry trends.
Table 4. Supply Chain Performance by Industry within the Discrete Industries
High-tech companies have the most advanced practices for inventory management, planning and analytics. They are just treading water (keeping slightly ahead of the market dynamics). The rate of change drives innovation. Within this industry there are more supply chain innovators taking a hard look and driving the adoption of prescriptive analytics and canonical value network infrastructures.
Taking a closer view at the value chain of the sub-industries within high-tech, i.e. consumer electronics, B2B Electronics, and semiconductor industries, the impact of the industry drivers and the importance of supply chain performance becomes clearer.
Table 5. Supply Chain Performance by Industry within the High-Tech Sector
The entire value chain is struggling to maintain margins and improve inventory turns. For consumer electronics and B2B electronics, growth is down, operating margins are degrading and inventory turns worsening. Supply chain matters more than ever.
Supply Chain Metrics That Matter: Semiconductors and Hard Disk Drives - 18 FE...Lora Cecere
Executive Overview
Supply chain leaders struggle to align corporate and supply chain strategy and drive improved performance. We term this difficult balancing act The Effective Frontier and explain it as the process of balancing growth, profitability, cycle and complexity within a company’s supply chain operations.
A supply chain is a complex system with increasing complexity. A major gap in many supply chain strategies is a nuanced understanding of supply chain potential when these elements are viewed together as a system.
The focus of this report is semiconductor and hard disk drive manufacturers. As seen in table 1, when it comes to supply chain performance, the industry is neither the best nor the worst. They fall squarely in the middle. While middle of the pack in operating margin, the industry has shown an increase in the cash-to-cash cycle and a decrease in inventory turns. With increasing complexity, the industry has struggled to maintain inventory turn performance over the period.
Companies further back in the supply chain have struggled to a higher degree to balance The Effective Frontier than those closer to usage. This is largely due to the bullwhip effect—the distortion of a demand signal as it gets passed downstream from trading partner to trading partner. The chemical industry manufacturers, like semiconductor & hard disk drive manufacturers, are three to five levels back in the supply chain. Comparing the results in table 1 for the two industries illustrates how much better the semiconductor & hard disk drive manufacturers have done in a similar orientation. Operating margin is comparable across the two, but the chemical industry has a higher cash-to-cash cycle level and almost a 50% lower inventory turns value.
Semiconductor and hard disk drive manufacturers have been successful in a challenging downstream position. Cost pressure from OEMS has not (as of yet) cut into margin, and growth levels have remained strong with the move to mobile. Inventory remains problematic with all six companies in this report, demonstrating increased DOI and decreased inventory turns, since the start of the century. Part of this is likely due to the lengthening of the global supply chain, while another part is partly due to rising product and process complexity, but it remains a concern.
Historically, the industry has made strong gains on productivity. An increasing move towards automation in the precision driven manufacturing environment is expected to continue the rise in revenue per employee performance.
In this report, we discuss the financial realities of the semiconductor and hard disk drive supply chain and offer recommendations for improvement.
State of Business Networks in Process Industries 2014 - Summary ChartsLora Cecere
Executive Summary
Today, the performance of an organization hinges more than ever on the effectiveness of flows between, and amongst, trading partners. It is not easy. The supply chain is not linear, and the relationships extend across geographic borders and industry sectors.
Outsourcing relationships have grown in the last decade; however, the automation of these networks has not kept pace. In the words of one respondent interviewed for this report in a facilitated workshop to review the data, “Today, we connect trading partners through spreadsheets, email, phone and fax. It is antiquated. I liken it to baling wire, chewing gum and duct tape. I need solutions that can synchronize and harmonize data across trading partners in real-time. My operating committee does not think that it is sexy to invest in B2B solutions, but it is needed. Today, it is almost impossible for us to understand the manufacturing status of purchase orders, and have accurate information readily on supply chain visibility of in-transit shipments. As a result, we make the wrong decisions, and have unnecessary wait times to get information.”
These comments echo the findings in this study. Respondents operate value networks, but they struggle to get to the data they need. The outsourcing of logistics is greater than manufacturing. Eighty-one percent of companies outsource logistics. The volume of outsourced logistics is 48% on average. In contrast, 66% of companies outsource manufacturing. The outsourced volume manufacturing volume varies, but averages 15%.
While the networks are complex, and the goals are many, progress is hard to track. This leads many supply chain leaders to ask, “What is the current state? What is the opportunity?” Answering these questions is the goal of this report.
Let’s start with the current state. As seen in Figure 2, the average respondent in this report believes that the supply chain today is more controlled and global than compared to two years ago. While they have made improvements in agility and proactivity, there is much more left to do. The largest challenges are in the use of outside-in data to improve channel sensing and reduce risk. While the supply chain today has made progress in transactional efficiency, companies are less competent at sensing opportunities and mitigating risks.
Improving Supplier Reliability -15 June 2016 - ReportLora Cecere
Executive Summary
Trust, but verify. During the recession of 2007, trust in the extended supply chain was broken. As companies throttled-back production to adjust to falling demand, many suppliers who thought that they were strategic were left “holding the bag.” Risk was pushed backwards in the supply chain violating the tenants of many strategic relationships.
As a result, shipments were refused and orders canceled. Payments were delayed and trust was violated. Many supplier companies never recovered, tightening the supply of materials in discrete value chains like automotive and high-tech.
As growth slowed over last five years, the supply chain focused on an agenda to reduce costs. Commodity price volatility increased and procurement pressures to reduce costs resulted in transactional buying (a focus to minimize price variance). In many companies, strategic sourcing and commodity management through category buying programs took a “back seat.” Supplier programs become more reactive.
In this environment, as shown in Figure 2, supplier viability—an environment for a supplier to manage a successful business—became a pressing risk issue. Sitting four and five levels back in the value network, suppliers experienced a double-whammy—pressure to reduce price along with the lengthening of Days of Payables.
Ironically, while technology in supply chain finance progressively improved to enable a quick transfer of funds across industries, Days of Payables increased 30 and 60 days. The second irony is the cost of capital. While brand owners have a lower cost of capital than their suppliers, few companies extend their brand capabilities in supply chain finance to their suppliers. While companies talk supply chain finance, squeezing suppliers is the market reality.
In parallel, economic uncertainty and demand volatility increased, also putting pressure on the supplier base. While the adoption of demand-driven processes could improve supplier alignment, demand-driven process adoption is slow. Few companies are taking ownership of demand signals to their supply base.
Traditional processes dominate. Companies are strongly wedded to supply-centric processes based on traditional forecasting processes using order patterns. With the lengthening of order latency, and the lengthening of the long tail of the supply chain, the synchronization of suppliers into the value network is out-of-step, creating waste and obsolescence.
Executive Summary
Supply chain management it is now three decades old. The processes are maturing. With the increase in complexity in markets and new product launch, supply chain excellence matters more than ever.
Manufacturing and distribution companies are looking for insights on how to parlay advances in supply chain management into balance sheet results. This is the goal of this report.
This report is a summary of research conducted during 2015. It provides a short summary of the major insights gathered from six quantitative and four qualitative studies. For more in-depth analysis reference the full reports outlined in the appendix.
Supply Chain Metrics That Matter: A Focus on Brick & Mortar Retail-18 FEB 2013Lora Cecere
The bricks and mortar retailer is being squeezed. Growth is slowing and margin is under pressure. With the rise of e-commerce, the role of the store is being redefined. It is about service and the customer experience. As a result, it is time to rethink the metrics that matter and focus outside-in on the shopper experience.
In this report, we share insights on the current state of bricks and mortar retail and offer our suggestions.
Brick & mortar retailers have weathered an intense decade with the persistent rise of e-commerce. The shopper has changed and recovery from the Great Recession is ongoing, but slow. Our previous Supply Chain Metrics That Matter: A Focus on Retail report focused on the broader industry trends affecting five different divisions of retailers and the challenges of multi-channel retail. This report narrows the focus to three segments of brick & mortar retailers struggling to adapt to the new world.
A retailer is not a retailer. We believe that retailers should be compared by business model. We do not believe that one can throw all retailers together and identify the “most improved” or “best” supply chain. There are too many variables and circumstances affecting the retail landscape to make valid comparisons. In our research, we find that small and well-defined peer groups offer the best way forward for understanding both segment and industry specific trends.
The industry segments analyzed in this report are grocery, mass and specialty. Grocery retailers are involved in the sale of perishable and non-perishable food stuffs. Mass retailers are larger companies focused on providing a comprehensive retail experience to their customers. Finally, specialty retailers are dedicated to specific customers, activities and goods. The companies in this analysis represent both American and global retailers.
Our grocery peer group consists of Carrefour, Delhaize Group, Safeway and The Kroger Co. The mass retailer peer group includes Costco, Metro, Target and Walmart. The choice of specialty retailers was by far the most difficult because there are so many dedicated stores in this category. For this publication, our peer group includes Bed Bath & Beyond, Dick’s Sporting Goods, Foot Locker and Ross Stores. Additional information about all of these companies is presented in the Appendix.
Integrated Demand Management-When Will We Start Using Downstream Data-7 Nov 2012Lora Cecere
For the purposes of this report, downstream data is defined as data that originates downstream on the demand side of the value chain. It can include point-of-sale data, T-log data, distributor data, social and unstructured data sources, retail withdrawal data and retail forecasts. Integrated demand signal management is the use of this data in a more holistic and integrated demand management process.
The use of channel data is evolving and this report is designed to give the industry an update on progress. Data for this report is based on two inputs: quantitative survey data from twenty-nine respondents (manufacturers) that use downstream data for integrated demand signal management, and qualitative input from attendees at an Integrated Demand Signal Management event that was attended by eleven manufacturers and four retailers. Data was collected in the fall of 2012.
While the study demographic is a small number, the respondents represent an experienced panel group. In the study, 90% of the respondents were using downstream data. The average time of usage is four years.
The Global Supply Chain Ups the Ante for Risk ManagementLora Cecere
Executive Summary
Unfortunately, supply chain disruptions are a fact of life for today’s global multinational company. The reasons are many. A risk management event can be triggered by natural events, geopolitical shifts, economic uncertainty and demand/supply volatility.
Historically, the roots and genesis of risk management programs were based on attempts to reduce insurance costs. Today it is much, much more. The focus is on prevention, early sensing, and the execution of well-orchestrated plans to mitigate the impact of a disruption. Global supply chain leaders understand that designing and implementing a robust risk management practice is essential and fundamental to running a global business. The size of the bubble in Figure 2 indicates the relative level of risk today, and the colors correspond to the level of risk.
Figure 2. Comparison of Risk Drivers for the Past Five Years and Future Five Years
While product quality and supply chain visibility are declining but still important, the areas of operations complexity and the definition of globalization infrastructure is increasing. The areas of economic uncertainty, supplier reliability, along with demand volatility, are continued risk factors.
Over time, as supply chains morphed from regional to global multinational organizations, globalization and regulatory compliance increased. As a result, procurement has shifted from traditional programs focused solely on contract management, price and term negotiations, and supplier scorecards to include the evolution of supplier development, to manage product quality and multi-tier supplier relationships, in and across value chain relationships.
Today is a less certain world than a decade ago. Geopolitical shifts, economic uncertainty and demand/supply volatility are rising. In addition, to spur growth companies are quick to add products to the item master, but slow to rationalize the portfolio. The rising complexity of items sold decreases the organization’s ability to forecast, and the longer lead times across multiple tiers of sourcing and supply increases the Bullwhip Effect’s impact (distortion of the demand signal across multiple tiers of the value network). As a result, there is a greater need for supplier development and supplier sensing to reduce supply risk. Inventory management and supplier financial sensing grow in importance with the increase in uncertainty.
Risk management is no longer narrowly focused: a technology, a response to a natural disaster, or improving supply chain visibility. Instead, it is more holistic with a focus on managing demand and supply variability cross-functionally and improving outcomes in an uncertain world.
In this report, we share insights on the current state of risk management programs while providing recommendations on what defines excellence.
The Supply Chain Index: Evaluating the Industrial Value Network - 18 AUG 2014Lora Cecere
Executive Overview
Supply chain performance matters. It can make or break corporate performance. Now 30-years old, the practice of supply chain management is still evolving. While companies speak of best practices, and boast about improvements in operating margin, inventory levels and asset management in conference after conference, we do not see it in our analysis of balance sheet information for any industry.
By their nature, supply chain leaders are competitive. They want to drive performance improvements and increase corporate value. Their goal is to outpace competitors. The rate of business change is intense and the personal stakes are high. Day after day, leaders must answer questions like, “Which path should I to take? What are the best technologies to use? What is an acceptable rate of performance? How am I doing against my peer group? And, what can I learn from others that I can use to improve the performance of my own operation?” Until the development of the Supply Chain Index by Supply Chain Insights, there was no independent and objective data-driven methodology that could answer these questions. With the development of this methodology, there now is a way to gauge improvement.
While it is easy to say the term supply chain excellence, it is difficult to define. Many people think that they know the definition, but there is no agreed-upon standard. The lack of a clear definition, and a methodology to measure improvement, makes progress hard to quantify and track.
The Supply Chain Index is designed to help. It is an objective measurement of supply chain improvement. It enables the comparison of companies’ progress within a peer group for a given time period. The Index is based upon financial performance of companies on four metrics integral to supply chain operations: Year-over-Year Revenue Growth, Return on Invested Capital, Inventory Turns, and Operating Margin. In building the Supply Chain Index, we had three goals:
1. Quantify Levels of Supply Chain Improvement. The Index is a composite metric based on the calculation of balance, strength and resiliency factors for a given time period. Each factor is measuring the pattern of performance over time. In the analysis, there is an underlying assumption that the companies that can sustain the best improvement in these three areas are driving the highest rates of supply chain improvement. The input metrics of Year-over-Year Revenue Growth, Return on Invested Capital, Inventory Turns, and Operating Margin were selected in part due to their high correlation to market capitalization.
2. Bridge the Gap between Finance and Supply Chain. Our second goal is to bridge the gap between the supply chain organization and the financial team...
Market-driven S&OP Report - 16 July 2012Lora Cecere
A Guidebook on How to Build a Market-driven S&OP Process
For manufacturers and retailers, supply chain is business. The Sales and Operations Planning (S&OP) process aligns the organization to the business strategy. As companies have become more global and face rising complexity, volatility and uncertainty, the importance of S&OP has increased. However, business complexity has created a gap between what companies have and what is needed. From our research, here we cite examples of these gaps:
Is Mobile the New Answer to Propel Growth?
A new battle wages to redesign the shopping experience. All retailers are turning to mobility, and the use of digital technologies, to capture market share. While mobile strategies offer great opportunities for the extended supply chain, from the shopper through supplier’s supplier, the current focus is on demand generation. It is early. The efforts are in test mode, but excitement abounds.
Supplier Development Study - Feb-May 2016 - Summary ChartsLora Cecere
Executive Summary
Trust, but verify. During the recession of 2007, trust in the extended supply chain was broken. As companies throttled-back production to adjust to falling demand, many suppliers who thought that they were strategic were left “holding the bag.” Risk was pushed backwards in the supply chain violating the tenants of many strategic relationships.
As a result, shipments were refused and orders canceled. Payments were delayed and trust was violated. Many supplier companies never recovered, tightening the supply of materials in discrete value chains like automotive and high-tech.
As growth slowed over last five years, the supply chain focused on an agenda to reduce costs. Commodity price volatility increased and procurement pressures to reduce costs resulted in transactional buying (a focus to minimize price variance). In many companies, strategic sourcing and commodity management through category buying programs took a “back seat.” Supplier programs become more reactive.
In this environment, as shown in Figure 2, supplier viability—an environment for a supplier to manage a successful business—became a pressing risk issue. Sitting four and five levels back in the value network, suppliers experienced a double-whammy—pressure to reduce price along with the lengthening of Days of Payables.
Ironically, while technology in supply chain finance progressively improved to enable a quick transfer of funds across industries, Days of Payables increased 30 and 60 days. The second irony is the cost of capital. While brand owners have a lower cost of capital than their suppliers, few companies extend their brand capabilities in supply chain finance to their suppliers. While companies talk supply chain finance, squeezing suppliers is the market reality.
In parallel, economic uncertainty and demand volatility increased, also putting pressure on the supplier base. While the adoption of demand-driven processes could improve supplier alignment, demand-driven process adoption is slow. Few companies are taking ownership of demand signals to their supply base.
Traditional processes dominate. Companies are strongly wedded to supply-centric processes based on traditional forecasting processes using order patterns. With the lengthening of order latency, and the lengthening of the long tail of the supply chain, the synchronization of suppliers into the value network is out-of-step, creating waste and obsolescence.
Supply Chain Metrics That Matter: Driving Reliability in Margins - 6 JAN 2013Lora Cecere
Supply chain management practices are thirty years old. Over the last decade, companies have invested in technology projects to improve financial outcomes (Technology investments over this period have averaged 1.7% of revenue). The ultimate goal was to reduce costs and improve inventory management. While many supply chain leaders believe that they delivered on these metrics, we find a less persuasive story. Through analysis of publically available balance sheet and income statement data, we find that 75% of companies in process industries lost ground on margins and only 5% of companies improved their positions on the number of days of inventory. The goal of this report is to answer the question “Why?” (For more on inventory and the Cash-to-Cash Cycle, see Supply Chain Metrics That Matter: The Cash-to-Cash Cycle.)
To begin our analysis, we wanted to understand the general trends. In table 1, we share the differences in average values for the companies profiled in this report by industry for the period of 2000-2011. In general, we see a decline in operating margins (OM). There is an increase in selling, general & administrative Costs (SG&A) and revenue per employee performance. The industries have mixed results on return on assets (ROA).
Executive Summary
No two supply chains are alike, but supply chain leaders across all industries face common challenges. The supply chain is becoming more strategic—an engine of growth and the driver of new business models—to drive new opportunities. For supply chain leaders, it is no longer just a discussion of cost and inventory management.
However, frustration abounds. Companies struggle to improve balance sheet results in the face of rising complexity and slowing growth. While all companies have improved revenue per employee, this efficiency improvement has not translated into operating margin improvements; and while cash-to-cash cycles have improved, it is not due to improvements in inventory positions. Most companies feel stuck, as if they are being held hostage by traditional supply chain practices.
Table 1. Industry Progress Across the Last Decade
In this report, we highlight the current state of supply chains—the supply chain organization, technologies, and process evolution—to enable supply chain leaders to take the next step in their strategy development. This report reflects the current state of supply chains, and is designed as a foundational document for supply chain leaders to build their 2015 strategies.
Understanding the Supply Chain Organization
Improving corporate performance is the driver of today’s supply chain organization. Increasingly, supply chain leaders are adopting new business models—ecommerce, digital business, and growth in new economies—to drive the top line.
Today, for the leader, it is about more than cost management. Instead, it is about the management of a portfolio of metrics to drive corporate performance. The supply chain is a complex system, with increasing complexity, and an increasing importance of driving balance sheet results. It is not easy. Improvement is hard work, and many are stuck. When we analyze financial balance sheet performance for the period of 2000-2013, we find that nine out of ten companies are stuck at the intersection of the two critical metrics of operating margin and inventory turns. Cash flow has been improved through elongating payables, and most companies are struggling to improve inventory in the face of complexity. This is an area of frustration and disappointment for business leaders who want to leverage supply chain technologies and processes to deliver both growth opportunities along with cash and cost savings to the organization.
The reason why? Today, the supply chain organization is traditional, tactical and cautious (see Figure 2). Most leaders would like to have a supply chain that is more agile and proactive. This is not possible with the current state of technologies and processes. To make the shift, companies need to reinvent the supply chain. The processes need to be redesigned outside-in with open sharing through business networks. These new forms of business networks, with many-to-many data models supported by canonical infrastructure, a
What Drives Supply Chain Excellence? A Look Back and a Look ForwardLora Cecere
This report is based on analysis of financial balance sheet and income statement data for the period of 2000-2012, quantitative survey research results, and interactions with clients in various industries in supply chain strategy sessions. We examine the performance of companies in a cross-section of industries on various metrics. We find that most companies and most industries are stuck in an environment of low results, with the exception of the hi-tech & electronics industry. Finally, we offer our perspective and advice on advancing supply chain excellence and moving the needle for better supply chain performance across company and industry lines.
Highlights
• A project-based approach has failed. Our gains are much lower than we believed in inventory management and a long-term perspective is needed to drive permanent and sustainable improvements.
• The hi-tech industry is the only of the six industries profiled to drive sustained gains across most metrics considered during the time period.
• The definition of supply chain excellence is still evolving as companies move through different maturity stages. Industrial and pharmaceutical companies are mainly stuck at low levels of maturity and could benefit greatly from applying lessons learned in other industries to their own supply chains.
Research Results
Full report
At one time, the physical store defined the retailer. It was the brand. Today, this has changed. Now the store is a part of a cross-channel experience. It is a combination of goods and services. The impact of the change is different by retail sector, but it is pervasive.
While changes in other industries have happened incrementally through continuous improvement and process innovation, retail has been transformed by new business models. The pace is faster and the customer demands higher.
Redefining the role of the store is critical. It requires partnerships of both retailers and manufacturers. It is for this reason that we wrote this report.
Supply Chain Metrics That Matter: Third Party Logistics Providers-10 DEC 2013Lora Cecere
Executive Overview
Third party logistics (3PL) providers fill a critical role in today’s global supply chains. With the rise in e-commerce, the growth of global markets, and the reshaping of the retail market, dependency on 3PLs is rising. It is an industry with fierce competition. Despite the promises of technology-driven differentiation, as of yet, no 3PL has successfully been able to differentiate and create significant brand loyalty. This is the market opportunity moving forward.
Today, companies on average send 30% of goods through third party logistics (3PL) providers. The 3PL market is now $148 billion in size with single-digit annual growth. Hit hard by the Great Recession, the industry is still in recovery. The 3PL industry has matured over the last 50 years; but it operates at a low margin, struggling to balance what we term The Effective Frontier.
The ongoing inability to drive resiliency on The Effective Frontier by managing tradeoffs of growth, profitability, cycle and complexity should be a concern for those working in, or working with, the 3PL industry. Comparable results from ten industries are shown in Table 1, ranked by average operating margin. 3PLs not only occupy the second lowest ranking, they have also seen the most significant drop in operating margin as a percentage since 2000. In this report, we look more closely at the current state of the industry.
Driving a Customer-Centric Supply Chain - 7 NOV 2016Lora Cecere
Report Details: The research for this report was conducted via an online survey from August 12 - October 14, 2016. Surveys were conducted among Manufacturers, Wholesalers/Distributors/Co-operatives and Third-Party Logistics Providers (n=56).
Objective: To determine how companies build a customer-centric supply chain and how well it is working for them.
Highlight: In this study, 80% of companies have a customer-centric strategy; yet the majority (54%) state that there is room for improvement to drive performance changes in their supply chain. Companies struggle to drive alignment and build constancy of purpose.
Putting Together the Pieces: Supply Chain Analytics - 2 SEP 2017Lora Cecere
RESEARCH OVERVIEW:
Report Details: This report is the result of six months of studying the emerging supply chain analytics technology market. This report is based on qualitative research completed in the period of January-July 2016. In this research effort, we interviewed thirty-five technology analytics providers to understand their solutions. This was followed by interviews with thirty innovative supply chain leaders. To support this research and take it one step further, we augment these qualitative insights with quantitative survey analysis collected in preparation for the Supply Chain Insights Global Summit. In this research, we share insights on the importance of supply chain analytics in Supply Chain 2030 strategies. Here we share these findings.
Objective: To understand the changing role of supply chain analytics in supply chain strategy.
Highlight: With the changing face of supply chain analytics companies have greater opportunities to drive insights and gain competitive advantage. This report is designed to help companies bridge traditional thinking on supply chain analytics while embracing emerging technologies.
Executive Summary
Supply chains are drowning in data, but are low on insights. While the cost of computing memory was once a barrier to executing an analytics strategy, this is no longer the case. The largest barrier is the understanding of new forms of analytics.
Historically, the term supply chain analytics was used to describe reporting. This is no longer the case. Today there are more options and capabilities for supply chain analytics. There is a proliferation of new technologies flooding the market.
Ironically, despite the explosion of options as shown in Figure 1, the supply chain operating team is more conservative. It is a skewed distribution. When it comes to decision support, the number of late adopters outnumber the early adopters three to one. The lack of early adopters, the rapid rate of change, and the conventional architectural definitions (primarily focused on Enterprise Resource Planning or ERP-based architectures) are barriers to the adoption of new forms of supply chain analytics.
S&OP Study Prelim Summary Charts used in the Why Is S&OP So Hard? report
Executive Overview
Sales and Operations Planning (S&OP), the cross-functional process to align the commercial processes of sales and marketing with the operational processes of supply and manufacturing, is having a renaissance. It is not a new process. Companies have worked on these processes for over 35 years; but today, only one out of two companies believes that their processes are effective.
Why is it so hard? Answering this question is the goal of this report.
Figure 3. Sales & Operations Planning Process Overview
A mature S&OP process improves organizational agility and alignment; but, this requires focus and clear leadership over a period of at least three to five years. A higher level of success happens when the S&OP processes report to a profit center manager and decision making is aligned to the commercial processes. With one in two companies aligning S&OP to product line production, not to commercial processes, it is difficult to drive maturity. Ideally, the leader of the S&OP process understands both the commercial drivers, and the supply constraints, and can make the pivot; but this is seldom the reality.
Today, due to popularity, companies have more than one S&OP process. In this research, a multinational company will have four to six separate and distinct S&OP processes with different maturity levels. While many will try to drive improvements with big technology initiatives, based on a decade of research on the topic, we recommend starting by tackling the change management issues. In this report, we share five barriers, and four misconceptions while giving supporting research to challenge change in the organization.
What Is the Value Proposition of Sales and Operations Planning? Summary ChartsLora Cecere
Survey Details: The research for this report was conducted online from January 6 - September 14, 2015 by Supply Chain Insights. Surveys were conducted among Manufacturers and Wholesalers/Distributors/Co-operatives with $250M+ in revenue and who have at least one S&OP process (n=73). For the purpose of analysis, respondents were split between those with a self-reported "effective" S&OP (n=31) and those without (n=42).
Objective: To understand the value proposition of an effective S&OP (Sales and Operations Planning) process. NOTE: An S&OP process was defined as a "tactical planning process to forecast sales and plan operations."
Highlight: Companies with a more effective S&OP process are more aligned, agile and balanced, which leads to greater control and improved response.
Executive Summary
Supply chain management it is now three decades old. The processes are maturing. With the increase in complexity in markets and new product launch, supply chain excellence matters more than ever.
Manufacturing and distribution companies are looking for insights on how to parlay advances in supply chain management into balance sheet results. This is the goal of this report.
This report is a summary of research conducted during 2015. It provides a short summary of the major insights gathered from six quantitative and four qualitative studies. For more in-depth analysis reference the full reports outlined in the appendix.
Supply Chain Metrics That Matter: A Focus on Brick & Mortar Retail-18 FEB 2013Lora Cecere
The bricks and mortar retailer is being squeezed. Growth is slowing and margin is under pressure. With the rise of e-commerce, the role of the store is being redefined. It is about service and the customer experience. As a result, it is time to rethink the metrics that matter and focus outside-in on the shopper experience.
In this report, we share insights on the current state of bricks and mortar retail and offer our suggestions.
Brick & mortar retailers have weathered an intense decade with the persistent rise of e-commerce. The shopper has changed and recovery from the Great Recession is ongoing, but slow. Our previous Supply Chain Metrics That Matter: A Focus on Retail report focused on the broader industry trends affecting five different divisions of retailers and the challenges of multi-channel retail. This report narrows the focus to three segments of brick & mortar retailers struggling to adapt to the new world.
A retailer is not a retailer. We believe that retailers should be compared by business model. We do not believe that one can throw all retailers together and identify the “most improved” or “best” supply chain. There are too many variables and circumstances affecting the retail landscape to make valid comparisons. In our research, we find that small and well-defined peer groups offer the best way forward for understanding both segment and industry specific trends.
The industry segments analyzed in this report are grocery, mass and specialty. Grocery retailers are involved in the sale of perishable and non-perishable food stuffs. Mass retailers are larger companies focused on providing a comprehensive retail experience to their customers. Finally, specialty retailers are dedicated to specific customers, activities and goods. The companies in this analysis represent both American and global retailers.
Our grocery peer group consists of Carrefour, Delhaize Group, Safeway and The Kroger Co. The mass retailer peer group includes Costco, Metro, Target and Walmart. The choice of specialty retailers was by far the most difficult because there are so many dedicated stores in this category. For this publication, our peer group includes Bed Bath & Beyond, Dick’s Sporting Goods, Foot Locker and Ross Stores. Additional information about all of these companies is presented in the Appendix.
Integrated Demand Management-When Will We Start Using Downstream Data-7 Nov 2012Lora Cecere
For the purposes of this report, downstream data is defined as data that originates downstream on the demand side of the value chain. It can include point-of-sale data, T-log data, distributor data, social and unstructured data sources, retail withdrawal data and retail forecasts. Integrated demand signal management is the use of this data in a more holistic and integrated demand management process.
The use of channel data is evolving and this report is designed to give the industry an update on progress. Data for this report is based on two inputs: quantitative survey data from twenty-nine respondents (manufacturers) that use downstream data for integrated demand signal management, and qualitative input from attendees at an Integrated Demand Signal Management event that was attended by eleven manufacturers and four retailers. Data was collected in the fall of 2012.
While the study demographic is a small number, the respondents represent an experienced panel group. In the study, 90% of the respondents were using downstream data. The average time of usage is four years.
The Global Supply Chain Ups the Ante for Risk ManagementLora Cecere
Executive Summary
Unfortunately, supply chain disruptions are a fact of life for today’s global multinational company. The reasons are many. A risk management event can be triggered by natural events, geopolitical shifts, economic uncertainty and demand/supply volatility.
Historically, the roots and genesis of risk management programs were based on attempts to reduce insurance costs. Today it is much, much more. The focus is on prevention, early sensing, and the execution of well-orchestrated plans to mitigate the impact of a disruption. Global supply chain leaders understand that designing and implementing a robust risk management practice is essential and fundamental to running a global business. The size of the bubble in Figure 2 indicates the relative level of risk today, and the colors correspond to the level of risk.
Figure 2. Comparison of Risk Drivers for the Past Five Years and Future Five Years
While product quality and supply chain visibility are declining but still important, the areas of operations complexity and the definition of globalization infrastructure is increasing. The areas of economic uncertainty, supplier reliability, along with demand volatility, are continued risk factors.
Over time, as supply chains morphed from regional to global multinational organizations, globalization and regulatory compliance increased. As a result, procurement has shifted from traditional programs focused solely on contract management, price and term negotiations, and supplier scorecards to include the evolution of supplier development, to manage product quality and multi-tier supplier relationships, in and across value chain relationships.
Today is a less certain world than a decade ago. Geopolitical shifts, economic uncertainty and demand/supply volatility are rising. In addition, to spur growth companies are quick to add products to the item master, but slow to rationalize the portfolio. The rising complexity of items sold decreases the organization’s ability to forecast, and the longer lead times across multiple tiers of sourcing and supply increases the Bullwhip Effect’s impact (distortion of the demand signal across multiple tiers of the value network). As a result, there is a greater need for supplier development and supplier sensing to reduce supply risk. Inventory management and supplier financial sensing grow in importance with the increase in uncertainty.
Risk management is no longer narrowly focused: a technology, a response to a natural disaster, or improving supply chain visibility. Instead, it is more holistic with a focus on managing demand and supply variability cross-functionally and improving outcomes in an uncertain world.
In this report, we share insights on the current state of risk management programs while providing recommendations on what defines excellence.
The Supply Chain Index: Evaluating the Industrial Value Network - 18 AUG 2014Lora Cecere
Executive Overview
Supply chain performance matters. It can make or break corporate performance. Now 30-years old, the practice of supply chain management is still evolving. While companies speak of best practices, and boast about improvements in operating margin, inventory levels and asset management in conference after conference, we do not see it in our analysis of balance sheet information for any industry.
By their nature, supply chain leaders are competitive. They want to drive performance improvements and increase corporate value. Their goal is to outpace competitors. The rate of business change is intense and the personal stakes are high. Day after day, leaders must answer questions like, “Which path should I to take? What are the best technologies to use? What is an acceptable rate of performance? How am I doing against my peer group? And, what can I learn from others that I can use to improve the performance of my own operation?” Until the development of the Supply Chain Index by Supply Chain Insights, there was no independent and objective data-driven methodology that could answer these questions. With the development of this methodology, there now is a way to gauge improvement.
While it is easy to say the term supply chain excellence, it is difficult to define. Many people think that they know the definition, but there is no agreed-upon standard. The lack of a clear definition, and a methodology to measure improvement, makes progress hard to quantify and track.
The Supply Chain Index is designed to help. It is an objective measurement of supply chain improvement. It enables the comparison of companies’ progress within a peer group for a given time period. The Index is based upon financial performance of companies on four metrics integral to supply chain operations: Year-over-Year Revenue Growth, Return on Invested Capital, Inventory Turns, and Operating Margin. In building the Supply Chain Index, we had three goals:
1. Quantify Levels of Supply Chain Improvement. The Index is a composite metric based on the calculation of balance, strength and resiliency factors for a given time period. Each factor is measuring the pattern of performance over time. In the analysis, there is an underlying assumption that the companies that can sustain the best improvement in these three areas are driving the highest rates of supply chain improvement. The input metrics of Year-over-Year Revenue Growth, Return on Invested Capital, Inventory Turns, and Operating Margin were selected in part due to their high correlation to market capitalization.
2. Bridge the Gap between Finance and Supply Chain. Our second goal is to bridge the gap between the supply chain organization and the financial team...
Market-driven S&OP Report - 16 July 2012Lora Cecere
A Guidebook on How to Build a Market-driven S&OP Process
For manufacturers and retailers, supply chain is business. The Sales and Operations Planning (S&OP) process aligns the organization to the business strategy. As companies have become more global and face rising complexity, volatility and uncertainty, the importance of S&OP has increased. However, business complexity has created a gap between what companies have and what is needed. From our research, here we cite examples of these gaps:
Is Mobile the New Answer to Propel Growth?
A new battle wages to redesign the shopping experience. All retailers are turning to mobility, and the use of digital technologies, to capture market share. While mobile strategies offer great opportunities for the extended supply chain, from the shopper through supplier’s supplier, the current focus is on demand generation. It is early. The efforts are in test mode, but excitement abounds.
Supplier Development Study - Feb-May 2016 - Summary ChartsLora Cecere
Executive Summary
Trust, but verify. During the recession of 2007, trust in the extended supply chain was broken. As companies throttled-back production to adjust to falling demand, many suppliers who thought that they were strategic were left “holding the bag.” Risk was pushed backwards in the supply chain violating the tenants of many strategic relationships.
As a result, shipments were refused and orders canceled. Payments were delayed and trust was violated. Many supplier companies never recovered, tightening the supply of materials in discrete value chains like automotive and high-tech.
As growth slowed over last five years, the supply chain focused on an agenda to reduce costs. Commodity price volatility increased and procurement pressures to reduce costs resulted in transactional buying (a focus to minimize price variance). In many companies, strategic sourcing and commodity management through category buying programs took a “back seat.” Supplier programs become more reactive.
In this environment, as shown in Figure 2, supplier viability—an environment for a supplier to manage a successful business—became a pressing risk issue. Sitting four and five levels back in the value network, suppliers experienced a double-whammy—pressure to reduce price along with the lengthening of Days of Payables.
Ironically, while technology in supply chain finance progressively improved to enable a quick transfer of funds across industries, Days of Payables increased 30 and 60 days. The second irony is the cost of capital. While brand owners have a lower cost of capital than their suppliers, few companies extend their brand capabilities in supply chain finance to their suppliers. While companies talk supply chain finance, squeezing suppliers is the market reality.
In parallel, economic uncertainty and demand volatility increased, also putting pressure on the supplier base. While the adoption of demand-driven processes could improve supplier alignment, demand-driven process adoption is slow. Few companies are taking ownership of demand signals to their supply base.
Traditional processes dominate. Companies are strongly wedded to supply-centric processes based on traditional forecasting processes using order patterns. With the lengthening of order latency, and the lengthening of the long tail of the supply chain, the synchronization of suppliers into the value network is out-of-step, creating waste and obsolescence.
Supply Chain Metrics That Matter: Driving Reliability in Margins - 6 JAN 2013Lora Cecere
Supply chain management practices are thirty years old. Over the last decade, companies have invested in technology projects to improve financial outcomes (Technology investments over this period have averaged 1.7% of revenue). The ultimate goal was to reduce costs and improve inventory management. While many supply chain leaders believe that they delivered on these metrics, we find a less persuasive story. Through analysis of publically available balance sheet and income statement data, we find that 75% of companies in process industries lost ground on margins and only 5% of companies improved their positions on the number of days of inventory. The goal of this report is to answer the question “Why?” (For more on inventory and the Cash-to-Cash Cycle, see Supply Chain Metrics That Matter: The Cash-to-Cash Cycle.)
To begin our analysis, we wanted to understand the general trends. In table 1, we share the differences in average values for the companies profiled in this report by industry for the period of 2000-2011. In general, we see a decline in operating margins (OM). There is an increase in selling, general & administrative Costs (SG&A) and revenue per employee performance. The industries have mixed results on return on assets (ROA).
Executive Summary
No two supply chains are alike, but supply chain leaders across all industries face common challenges. The supply chain is becoming more strategic—an engine of growth and the driver of new business models—to drive new opportunities. For supply chain leaders, it is no longer just a discussion of cost and inventory management.
However, frustration abounds. Companies struggle to improve balance sheet results in the face of rising complexity and slowing growth. While all companies have improved revenue per employee, this efficiency improvement has not translated into operating margin improvements; and while cash-to-cash cycles have improved, it is not due to improvements in inventory positions. Most companies feel stuck, as if they are being held hostage by traditional supply chain practices.
Table 1. Industry Progress Across the Last Decade
In this report, we highlight the current state of supply chains—the supply chain organization, technologies, and process evolution—to enable supply chain leaders to take the next step in their strategy development. This report reflects the current state of supply chains, and is designed as a foundational document for supply chain leaders to build their 2015 strategies.
Understanding the Supply Chain Organization
Improving corporate performance is the driver of today’s supply chain organization. Increasingly, supply chain leaders are adopting new business models—ecommerce, digital business, and growth in new economies—to drive the top line.
Today, for the leader, it is about more than cost management. Instead, it is about the management of a portfolio of metrics to drive corporate performance. The supply chain is a complex system, with increasing complexity, and an increasing importance of driving balance sheet results. It is not easy. Improvement is hard work, and many are stuck. When we analyze financial balance sheet performance for the period of 2000-2013, we find that nine out of ten companies are stuck at the intersection of the two critical metrics of operating margin and inventory turns. Cash flow has been improved through elongating payables, and most companies are struggling to improve inventory in the face of complexity. This is an area of frustration and disappointment for business leaders who want to leverage supply chain technologies and processes to deliver both growth opportunities along with cash and cost savings to the organization.
The reason why? Today, the supply chain organization is traditional, tactical and cautious (see Figure 2). Most leaders would like to have a supply chain that is more agile and proactive. This is not possible with the current state of technologies and processes. To make the shift, companies need to reinvent the supply chain. The processes need to be redesigned outside-in with open sharing through business networks. These new forms of business networks, with many-to-many data models supported by canonical infrastructure, a
What Drives Supply Chain Excellence? A Look Back and a Look ForwardLora Cecere
This report is based on analysis of financial balance sheet and income statement data for the period of 2000-2012, quantitative survey research results, and interactions with clients in various industries in supply chain strategy sessions. We examine the performance of companies in a cross-section of industries on various metrics. We find that most companies and most industries are stuck in an environment of low results, with the exception of the hi-tech & electronics industry. Finally, we offer our perspective and advice on advancing supply chain excellence and moving the needle for better supply chain performance across company and industry lines.
Highlights
• A project-based approach has failed. Our gains are much lower than we believed in inventory management and a long-term perspective is needed to drive permanent and sustainable improvements.
• The hi-tech industry is the only of the six industries profiled to drive sustained gains across most metrics considered during the time period.
• The definition of supply chain excellence is still evolving as companies move through different maturity stages. Industrial and pharmaceutical companies are mainly stuck at low levels of maturity and could benefit greatly from applying lessons learned in other industries to their own supply chains.
Research Results
Full report
At one time, the physical store defined the retailer. It was the brand. Today, this has changed. Now the store is a part of a cross-channel experience. It is a combination of goods and services. The impact of the change is different by retail sector, but it is pervasive.
While changes in other industries have happened incrementally through continuous improvement and process innovation, retail has been transformed by new business models. The pace is faster and the customer demands higher.
Redefining the role of the store is critical. It requires partnerships of both retailers and manufacturers. It is for this reason that we wrote this report.
Supply Chain Metrics That Matter: Third Party Logistics Providers-10 DEC 2013Lora Cecere
Executive Overview
Third party logistics (3PL) providers fill a critical role in today’s global supply chains. With the rise in e-commerce, the growth of global markets, and the reshaping of the retail market, dependency on 3PLs is rising. It is an industry with fierce competition. Despite the promises of technology-driven differentiation, as of yet, no 3PL has successfully been able to differentiate and create significant brand loyalty. This is the market opportunity moving forward.
Today, companies on average send 30% of goods through third party logistics (3PL) providers. The 3PL market is now $148 billion in size with single-digit annual growth. Hit hard by the Great Recession, the industry is still in recovery. The 3PL industry has matured over the last 50 years; but it operates at a low margin, struggling to balance what we term The Effective Frontier.
The ongoing inability to drive resiliency on The Effective Frontier by managing tradeoffs of growth, profitability, cycle and complexity should be a concern for those working in, or working with, the 3PL industry. Comparable results from ten industries are shown in Table 1, ranked by average operating margin. 3PLs not only occupy the second lowest ranking, they have also seen the most significant drop in operating margin as a percentage since 2000. In this report, we look more closely at the current state of the industry.
Driving a Customer-Centric Supply Chain - 7 NOV 2016Lora Cecere
Report Details: The research for this report was conducted via an online survey from August 12 - October 14, 2016. Surveys were conducted among Manufacturers, Wholesalers/Distributors/Co-operatives and Third-Party Logistics Providers (n=56).
Objective: To determine how companies build a customer-centric supply chain and how well it is working for them.
Highlight: In this study, 80% of companies have a customer-centric strategy; yet the majority (54%) state that there is room for improvement to drive performance changes in their supply chain. Companies struggle to drive alignment and build constancy of purpose.
Putting Together the Pieces: Supply Chain Analytics - 2 SEP 2017Lora Cecere
RESEARCH OVERVIEW:
Report Details: This report is the result of six months of studying the emerging supply chain analytics technology market. This report is based on qualitative research completed in the period of January-July 2016. In this research effort, we interviewed thirty-five technology analytics providers to understand their solutions. This was followed by interviews with thirty innovative supply chain leaders. To support this research and take it one step further, we augment these qualitative insights with quantitative survey analysis collected in preparation for the Supply Chain Insights Global Summit. In this research, we share insights on the importance of supply chain analytics in Supply Chain 2030 strategies. Here we share these findings.
Objective: To understand the changing role of supply chain analytics in supply chain strategy.
Highlight: With the changing face of supply chain analytics companies have greater opportunities to drive insights and gain competitive advantage. This report is designed to help companies bridge traditional thinking on supply chain analytics while embracing emerging technologies.
Executive Summary
Supply chains are drowning in data, but are low on insights. While the cost of computing memory was once a barrier to executing an analytics strategy, this is no longer the case. The largest barrier is the understanding of new forms of analytics.
Historically, the term supply chain analytics was used to describe reporting. This is no longer the case. Today there are more options and capabilities for supply chain analytics. There is a proliferation of new technologies flooding the market.
Ironically, despite the explosion of options as shown in Figure 1, the supply chain operating team is more conservative. It is a skewed distribution. When it comes to decision support, the number of late adopters outnumber the early adopters three to one. The lack of early adopters, the rapid rate of change, and the conventional architectural definitions (primarily focused on Enterprise Resource Planning or ERP-based architectures) are barriers to the adoption of new forms of supply chain analytics.
S&OP Study Prelim Summary Charts used in the Why Is S&OP So Hard? report
Executive Overview
Sales and Operations Planning (S&OP), the cross-functional process to align the commercial processes of sales and marketing with the operational processes of supply and manufacturing, is having a renaissance. It is not a new process. Companies have worked on these processes for over 35 years; but today, only one out of two companies believes that their processes are effective.
Why is it so hard? Answering this question is the goal of this report.
Figure 3. Sales & Operations Planning Process Overview
A mature S&OP process improves organizational agility and alignment; but, this requires focus and clear leadership over a period of at least three to five years. A higher level of success happens when the S&OP processes report to a profit center manager and decision making is aligned to the commercial processes. With one in two companies aligning S&OP to product line production, not to commercial processes, it is difficult to drive maturity. Ideally, the leader of the S&OP process understands both the commercial drivers, and the supply constraints, and can make the pivot; but this is seldom the reality.
Today, due to popularity, companies have more than one S&OP process. In this research, a multinational company will have four to six separate and distinct S&OP processes with different maturity levels. While many will try to drive improvements with big technology initiatives, based on a decade of research on the topic, we recommend starting by tackling the change management issues. In this report, we share five barriers, and four misconceptions while giving supporting research to challenge change in the organization.
What Is the Value Proposition of Sales and Operations Planning? Summary ChartsLora Cecere
Survey Details: The research for this report was conducted online from January 6 - September 14, 2015 by Supply Chain Insights. Surveys were conducted among Manufacturers and Wholesalers/Distributors/Co-operatives with $250M+ in revenue and who have at least one S&OP process (n=73). For the purpose of analysis, respondents were split between those with a self-reported "effective" S&OP (n=31) and those without (n=42).
Objective: To understand the value proposition of an effective S&OP (Sales and Operations Planning) process. NOTE: An S&OP process was defined as a "tactical planning process to forecast sales and plan operations."
Highlight: Companies with a more effective S&OP process are more aligned, agile and balanced, which leads to greater control and improved response.
Tsunamis, terrorist attacks, hurricanes, and volcanic eruptions have impacted the global economy in the last 10 years. The effects of a “discontinuity event” such as a natural disaster, geopolitical shifts, economic uncertainty and demand/supply volatility to your business can be significant, impacting suppliers, vendors and customers. In our new report, Supply Chain Risk Management, we address the need for companies to proactively prepare for the worst to protect their business operations and weather the storm of unforeseen events.
Supply Chain Centers of Excellence Study - Summary Charts - 2014 - 2015Lora Cecere
Executive Overview
Growth is slowing and the complexity in today’s supply chain is unprecedented. No two centers of excellence are the same, and no two supply chains are alike. There are different drivers and obstacles to building and running a Center of Excellence. However, if done right, the organization rates itself as more aligned, proactive and agile. The high-level results from our study are shown in Figure 2.
Figure 2. Centers of Excellence Infographic
Based on our qualitative interviews with clients, we find that these seven drivers to build a Center of Excellence:
• Increase in the Importance of Supply Chain Management. As growth slows, and the global multinational organization matures, more and more companies are interested in driving supply chain excellence. The reasons are many; but, at the top of the list is improving reliability in the face of volatility. How so? Demand volatility is increasing and supplier viability is growing more fragile. Driving reliability in global operations in the face of these challenges is fundamental to defining and executing supply chain excellence.
• Building of Global Teams and the Development of Supply Chain Talent. With the shortage of students from academia, and the retirement of the first- and second-generation supply chain pioneers, more and more companies are developing and executing programs to build supply chain talent. There is a shortage of mid-management talent with pressure on planning job retention. There is a limited supply of supply chain knowledge workers: leaders that are technologically savvy, analytical problem solvers, and astute in business processes.
• Continuation of Work on Enterprise Resource Planning (ERP). When companies complete a large ERP project, there is a strong impetus to get the value from the investment and ensure technology usage. The focus of the Center of Excellence often becomes an extension of the global implementation team.
• Metrics and Implementation of Analytics. While the management of supply chain excellence sounds easy, it is not. The management of order-to-cash and procure-to-pay processes and the supply chain execution processes are easier because they are well-defined. Most companies struggle with the definition of planning and the use of new forms of analytics.
• Network Design and the Orchestration of Flows. Most companies start on their supply chain design journey to save costs in logistics. With the increasing cost of transportation, and the fragility of freight networks, network design for transportation and logistics networks is paramount. One client likened it to “minting money.”
• Testing of New Technologies. Cloud technologies. Supply chain operating networks. The Internet of Things. 3D Printing. New forms of analytics. The list of technology and process disruptors could go on and on. While most companies feel stuck in their existing, and more traditional, processes they want to understand and explore technology
5 major opportunities awaiting manufacturers and their CFOsGrant Thornton LLP
It’s an exciting time to be in manufacturing. Revenues are on the rise, employment is up, and with potential for increased profits, today’s manufacturing CFOs understand that their role goes beyond the bottom line. A fall 2014 Grant Thornton LLP survey of 350 CFOs explored some of these burgeoning possibilities. This infographic identifies C-level insights about how to make the most of them.
Find out more about our survey at grantthornton.com/valueaddCFO.
18th Annual Global CEO Survey - Technology industry key findingsPwC
Tech CEOs are optimistic about the global economy and both near term and future revenue growth. They view strategic alliances, including partnering with competitors, as a primary means to grow their businesses. We invite you to explore the analysis and contact us to discuss how we can help your business capitalise on the new - but challenging - opportunities for growth. Learn more http://pwc.to/1DaolqY
Website: http://www.pwc.com/gx/en/ceo-survey/2015/industry/technology.jhtml
Capitalizing on analytics in finance: Creating trusted insights for the enter...Spencer Lin
A recent IBM study of 337 CFOs and senior finance executives found that about 90% are implementing analytics solutions. However, analytics adoption is happening in pockets and isn’t pervasive across finance activities. With investment in analytics poised to double in the near term, how can Finance better capitalize on these new capabilities? To answer that question, we looked at the most effective Finance organizations and learned three important lessons from their success.
Expense Management: Best Practices and Benchmarking for 2015 Ashley Emery
Travel and Entertainment (T&E) expenses—second only to payroll as the largest business expense—are becoming increasingly more difficult to control as companies expand across borders and grow through acquisitions. Therefore, effective budgeting, planning, and management of T&E expenses is critical for companies of all sizes in 2015 and beyond.
How does your company’s overall T&E spending, as well as spending within key categories, compare with other companies? How are companies leveraging automation to better understand and control how employees are spending the company dime? Join us for an hour-long discussion about the best practices to reduce T&E spending and simplify expense management processes in 2015.
A critical look at three years of supply chain disruption. Using quantitative and qualitative research, Lora Cecere, Founder of Supply Chain Insights, looks critically at the factors within companies that drove resilience and the factors less successful. Companies that won were aligned, used market signals, decreased process latency, used scenario planning, and implemented descriptive analytics. Those that fared worse, had tight integration of supply chain planning to ERP, were not aligned, and were focused on a digital transformation strategy.
River of Demand - ALL RIVERS with QR.pdfLora Cecere
Drawings of demand as a river depicting the issues with flow with the voice overlay of the planner. To hear the voice, scan the QR code at the bottom of the drawing.
Presentation was given at the Longbow presentation on the future of supply chain management and the value of changing processes to make decisions a the speed of business decisions
At the Supply Chain Insights Global Summit, we challenged the audience to think about "social tokens" using this presentation from Luke Layden of Coin Desk.
Today's supply chain processes are inside-out. Outside-in processes, using channel and market data, improve the time to respond. This presentation reflects two years of testing using machine learning to understand the impact on the bullwhip effect and Forecast Value Added.
Now in its ninth year, the Supply Chains to Admire analysis is a study of the progress of each industry sector on the balanced scorecard of growth, operating margin, inventory turns, and Return on Invested Capital (ROIC). Twenty-two companies outperform their peer group, defining and exemplifying supply chain excellence.
Supply Chains to Admire Analysis 2022_2022 presentation.pptxLora Cecere
Supply Chains to Admire is a data-driven analysis based on public reporting of manufacturing and retail companies. The research evaluates which public companies drove improvement while outperforming their peer groups on performance metrics and value for the ten-year period of 2012-2021. The 25 winners are a testimonial to supply chain resilience.
The Role of Analytics In Defining The Art Of The PossibleLora Cecere
Analytics capabilities are evolving faster than organizations can adopt them into their processes. Here we share the research of 92 respondents in their journey to use new forms of analytics in their digital transformation journey.
Kseniya Leshchenko: Shared development support service model as the way to ma...Lviv Startup Club
Kseniya Leshchenko: Shared development support service model as the way to make small projects with small budgets profitable for the company (UA)
Kyiv PMDay 2024 Summer
Website – www.pmday.org
Youtube – https://www.youtube.com/startuplviv
FB – https://www.facebook.com/pmdayconference
Cracking the Workplace Discipline Code Main.pptxWorkforce Group
Cultivating and maintaining discipline within teams is a critical differentiator for successful organisations.
Forward-thinking leaders and business managers understand the impact that discipline has on organisational success. A disciplined workforce operates with clarity, focus, and a shared understanding of expectations, ultimately driving better results, optimising productivity, and facilitating seamless collaboration.
Although discipline is not a one-size-fits-all approach, it can help create a work environment that encourages personal growth and accountability rather than solely relying on punitive measures.
In this deck, you will learn the significance of workplace discipline for organisational success. You’ll also learn
• Four (4) workplace discipline methods you should consider
• The best and most practical approach to implementing workplace discipline.
• Three (3) key tips to maintain a disciplined workplace.
Attending a job Interview for B1 and B2 Englsih learnersErika906060
It is a sample of an interview for a business english class for pre-intermediate and intermediate english students with emphasis on the speking ability.
Improving profitability for small businessBen Wann
In this comprehensive presentation, we will explore strategies and practical tips for enhancing profitability in small businesses. Tailored to meet the unique challenges faced by small enterprises, this session covers various aspects that directly impact the bottom line. Attendees will learn how to optimize operational efficiency, manage expenses, and increase revenue through innovative marketing and customer engagement techniques.
Discover the innovative and creative projects that highlight my journey throu...dylandmeas
Discover the innovative and creative projects that highlight my journey through Full Sail University. Below, you’ll find a collection of my work showcasing my skills and expertise in digital marketing, event planning, and media production.
Falcon stands out as a top-tier P2P Invoice Discounting platform in India, bridging esteemed blue-chip companies and eager investors. Our goal is to transform the investment landscape in India by establishing a comprehensive destination for borrowers and investors with diverse profiles and needs, all while minimizing risk. What sets Falcon apart is the elimination of intermediaries such as commercial banks and depository institutions, allowing investors to enjoy higher yields.
Digital Transformation and IT Strategy Toolkit and TemplatesAurelien Domont, MBA
This Digital Transformation and IT Strategy Toolkit was created by ex-McKinsey, Deloitte and BCG Management Consultants, after more than 5,000 hours of work. It is considered the world's best & most comprehensive Digital Transformation and IT Strategy Toolkit. It includes all the Frameworks, Best Practices & Templates required to successfully undertake the Digital Transformation of your organization and define a robust IT Strategy.
Editable Toolkit to help you reuse our content: 700 Powerpoint slides | 35 Excel sheets | 84 minutes of Video training
This PowerPoint presentation is only a small preview of our Toolkits. For more details, visit www.domontconsulting.com
Enterprise Excellence is Inclusive Excellence.pdfKaiNexus
Enterprise excellence and inclusive excellence are closely linked, and real-world challenges have shown that both are essential to the success of any organization. To achieve enterprise excellence, organizations must focus on improving their operations and processes while creating an inclusive environment that engages everyone. In this interactive session, the facilitator will highlight commonly established business practices and how they limit our ability to engage everyone every day. More importantly, though, participants will likely gain increased awareness of what we can do differently to maximize enterprise excellence through deliberate inclusion.
What is Enterprise Excellence?
Enterprise Excellence is a holistic approach that's aimed at achieving world-class performance across all aspects of the organization.
What might I learn?
A way to engage all in creating Inclusive Excellence. Lessons from the US military and their parallels to the story of Harry Potter. How belt systems and CI teams can destroy inclusive practices. How leadership language invites people to the party. There are three things leaders can do to engage everyone every day: maximizing psychological safety to create environments where folks learn, contribute, and challenge the status quo.
Who might benefit? Anyone and everyone leading folks from the shop floor to top floor.
Dr. William Harvey is a seasoned Operations Leader with extensive experience in chemical processing, manufacturing, and operations management. At Michelman, he currently oversees multiple sites, leading teams in strategic planning and coaching/practicing continuous improvement. William is set to start his eighth year of teaching at the University of Cincinnati where he teaches marketing, finance, and management. William holds various certifications in change management, quality, leadership, operational excellence, team building, and DiSC, among others.
RMD24 | Retail media: hoe zet je dit in als je geen AH of Unilever bent? Heid...BBPMedia1
Grote partijen zijn al een tijdje onderweg met retail media. Ondertussen worden in dit domein ook de kansen zichtbaar voor andere spelers in de markt. Maar met die kansen ontstaan ook vragen: Zelf retail media worden of erop adverteren? In welke fase van de funnel past het en hoe integreer je het in een mediaplan? Wat is nu precies het verschil met marketplaces en Programmatic ads? In dit half uur beslechten we de dilemma's en krijg je antwoorden op wanneer het voor jou tijd is om de volgende stap te zetten.
"𝑩𝑬𝑮𝑼𝑵 𝑾𝑰𝑻𝑯 𝑻𝑱 𝑰𝑺 𝑯𝑨𝑳𝑭 𝑫𝑶𝑵𝑬"
𝐓𝐉 𝐂𝐨𝐦𝐬 (𝐓𝐉 𝐂𝐨𝐦𝐦𝐮𝐧𝐢𝐜𝐚𝐭𝐢𝐨𝐧𝐬) is a professional event agency that includes experts in the event-organizing market in Vietnam, Korea, and ASEAN countries. We provide unlimited types of events from Music concerts, Fan meetings, and Culture festivals to Corporate events, Internal company events, Golf tournaments, MICE events, and Exhibitions.
𝐓𝐉 𝐂𝐨𝐦𝐬 provides unlimited package services including such as Event organizing, Event planning, Event production, Manpower, PR marketing, Design 2D/3D, VIP protocols, Interpreter agency, etc.
Sports events - Golf competitions/billiards competitions/company sports events: dynamic and challenging
⭐ 𝐅𝐞𝐚𝐭𝐮𝐫𝐞𝐝 𝐩𝐫𝐨𝐣𝐞𝐜𝐭𝐬:
➢ 2024 BAEKHYUN [Lonsdaleite] IN HO CHI MINH
➢ SUPER JUNIOR-L.S.S. THE SHOW : Th3ee Guys in HO CHI MINH
➢FreenBecky 1st Fan Meeting in Vietnam
➢CHILDREN ART EXHIBITION 2024: BEYOND BARRIERS
➢ WOW K-Music Festival 2023
➢ Winner [CROSS] Tour in HCM
➢ Super Show 9 in HCM with Super Junior
➢ HCMC - Gyeongsangbuk-do Culture and Tourism Festival
➢ Korean Vietnam Partnership - Fair with LG
➢ Korean President visits Samsung Electronics R&D Center
➢ Vietnam Food Expo with Lotte Wellfood
"𝐄𝐯𝐞𝐫𝐲 𝐞𝐯𝐞𝐧𝐭 𝐢𝐬 𝐚 𝐬𝐭𝐨𝐫𝐲, 𝐚 𝐬𝐩𝐞𝐜𝐢𝐚𝐥 𝐣𝐨𝐮𝐫𝐧𝐞𝐲. 𝐖𝐞 𝐚𝐥𝐰𝐚𝐲𝐬 𝐛𝐞𝐥𝐢𝐞𝐯𝐞 𝐭𝐡𝐚𝐭 𝐬𝐡𝐨𝐫𝐭𝐥𝐲 𝐲𝐨𝐮 𝐰𝐢𝐥𝐥 𝐛𝐞 𝐚 𝐩𝐚𝐫𝐭 𝐨𝐟 𝐨𝐮𝐫 𝐬𝐭𝐨𝐫𝐢𝐞𝐬."