Download to read offline
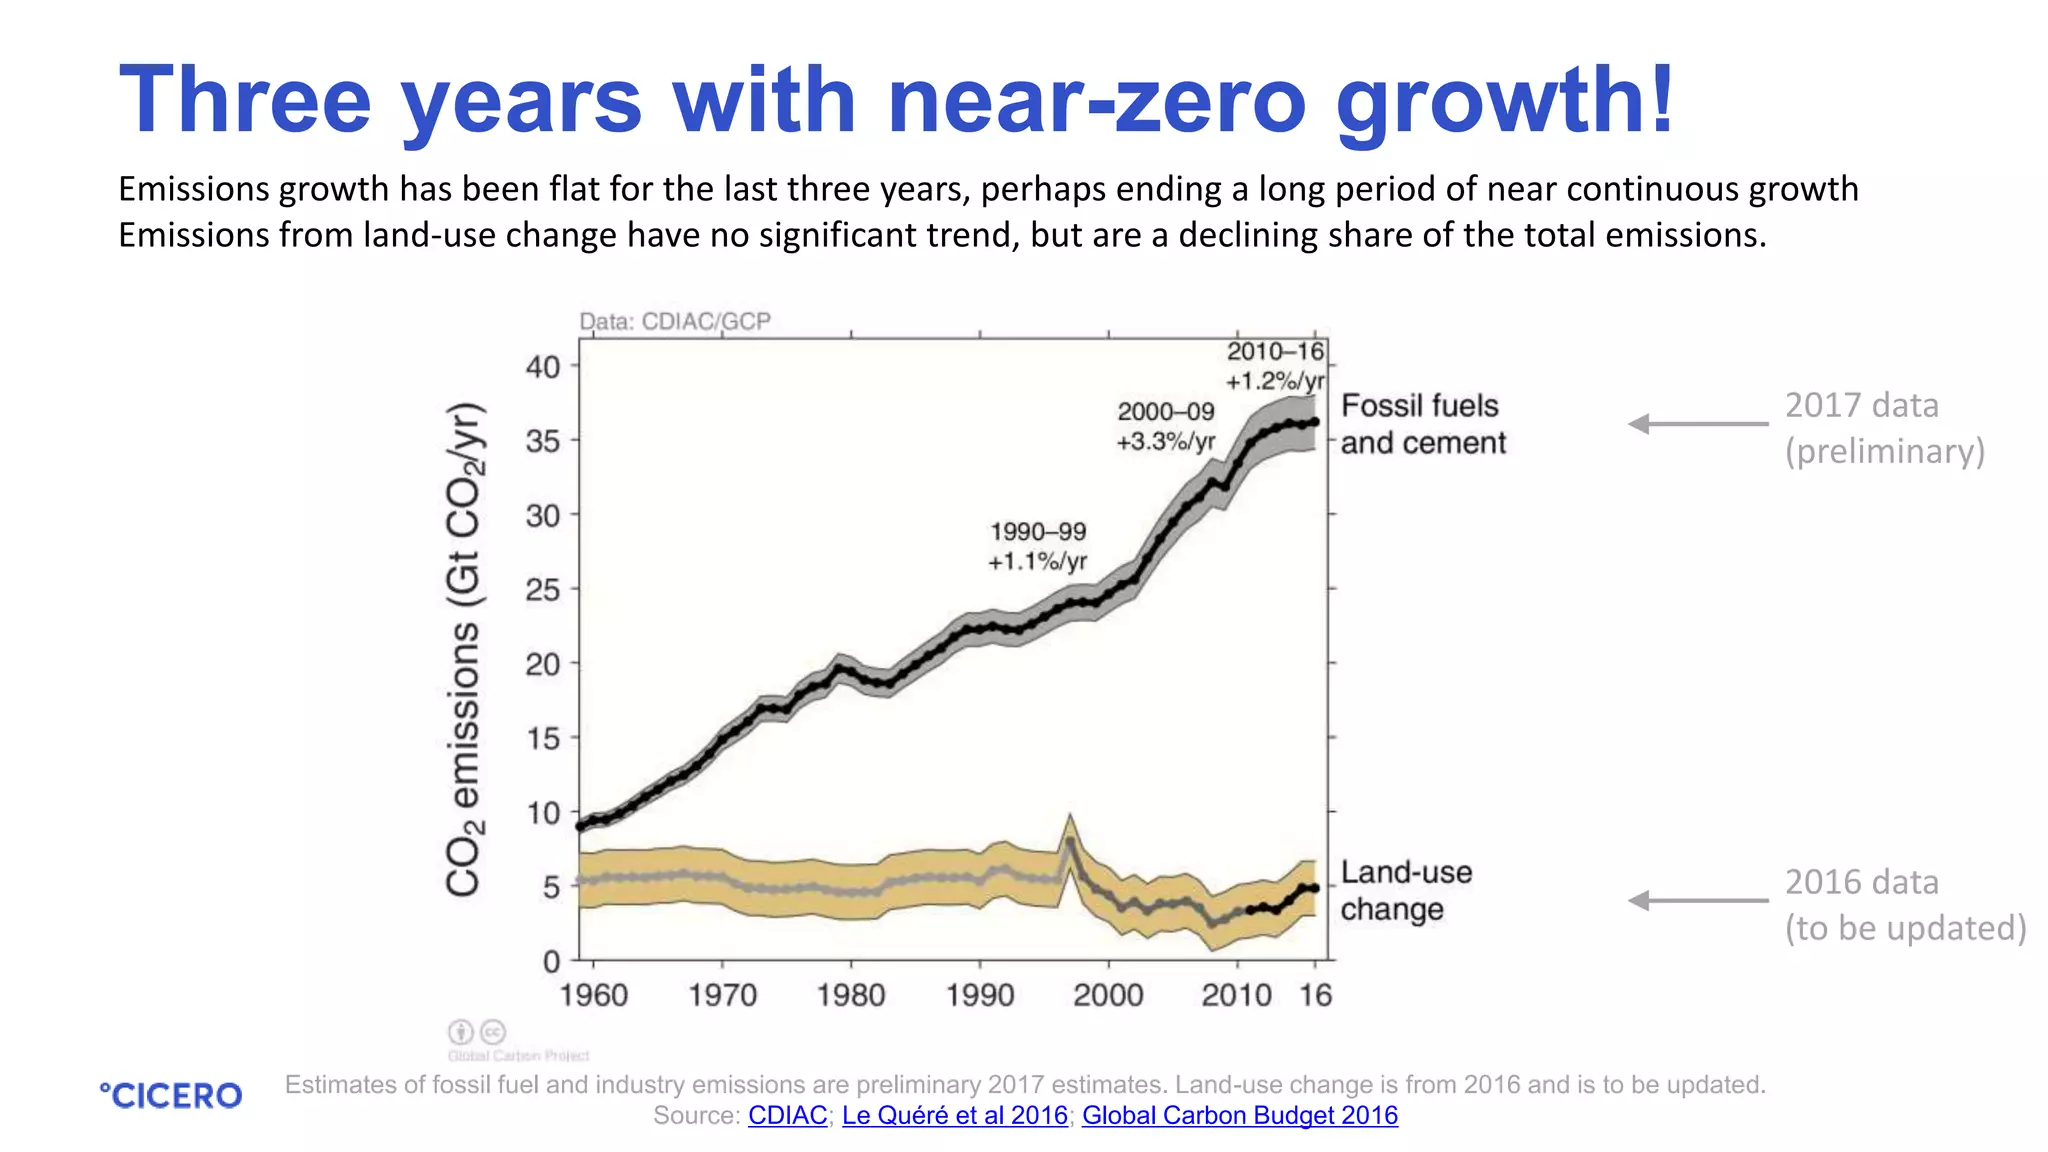

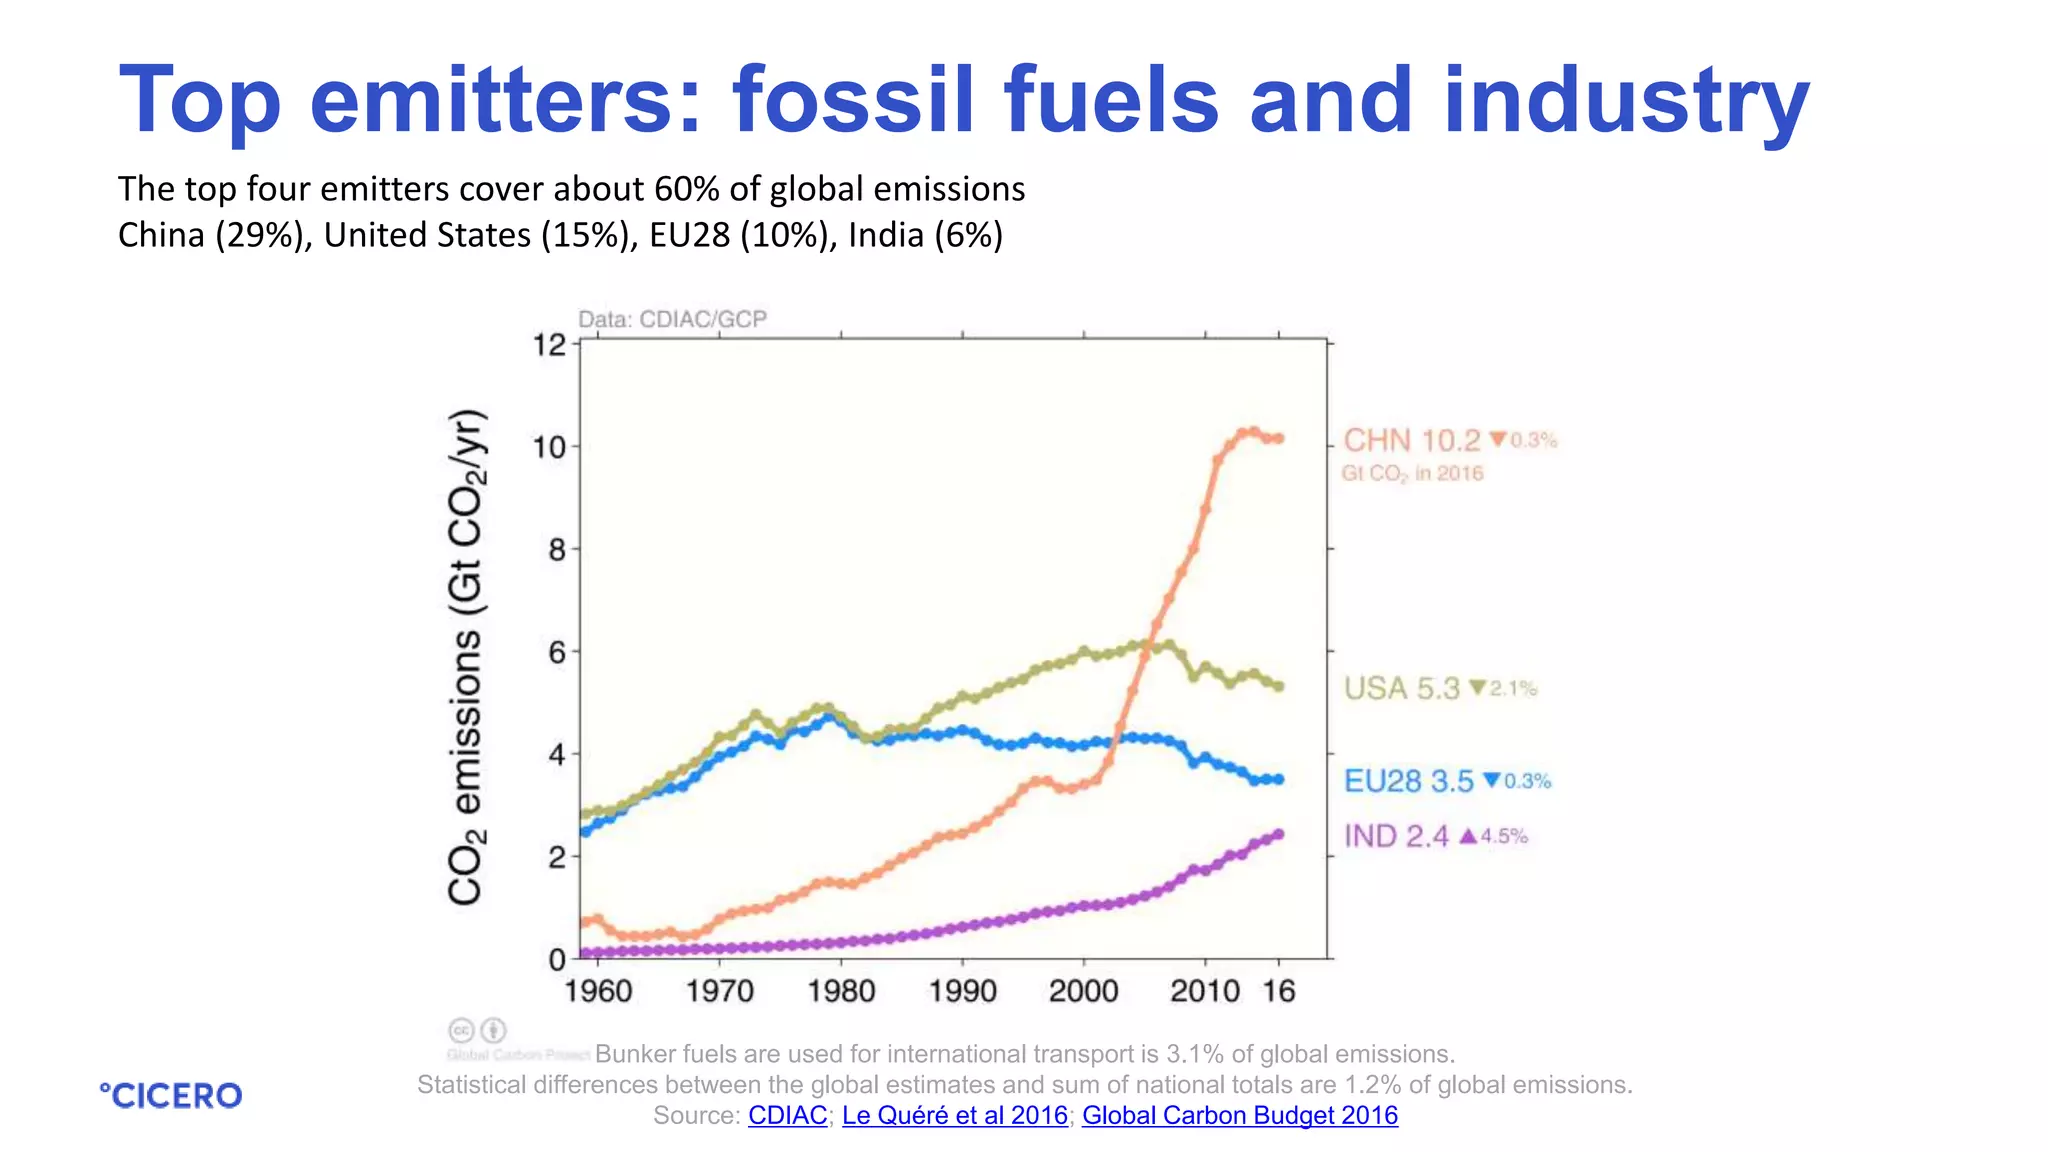
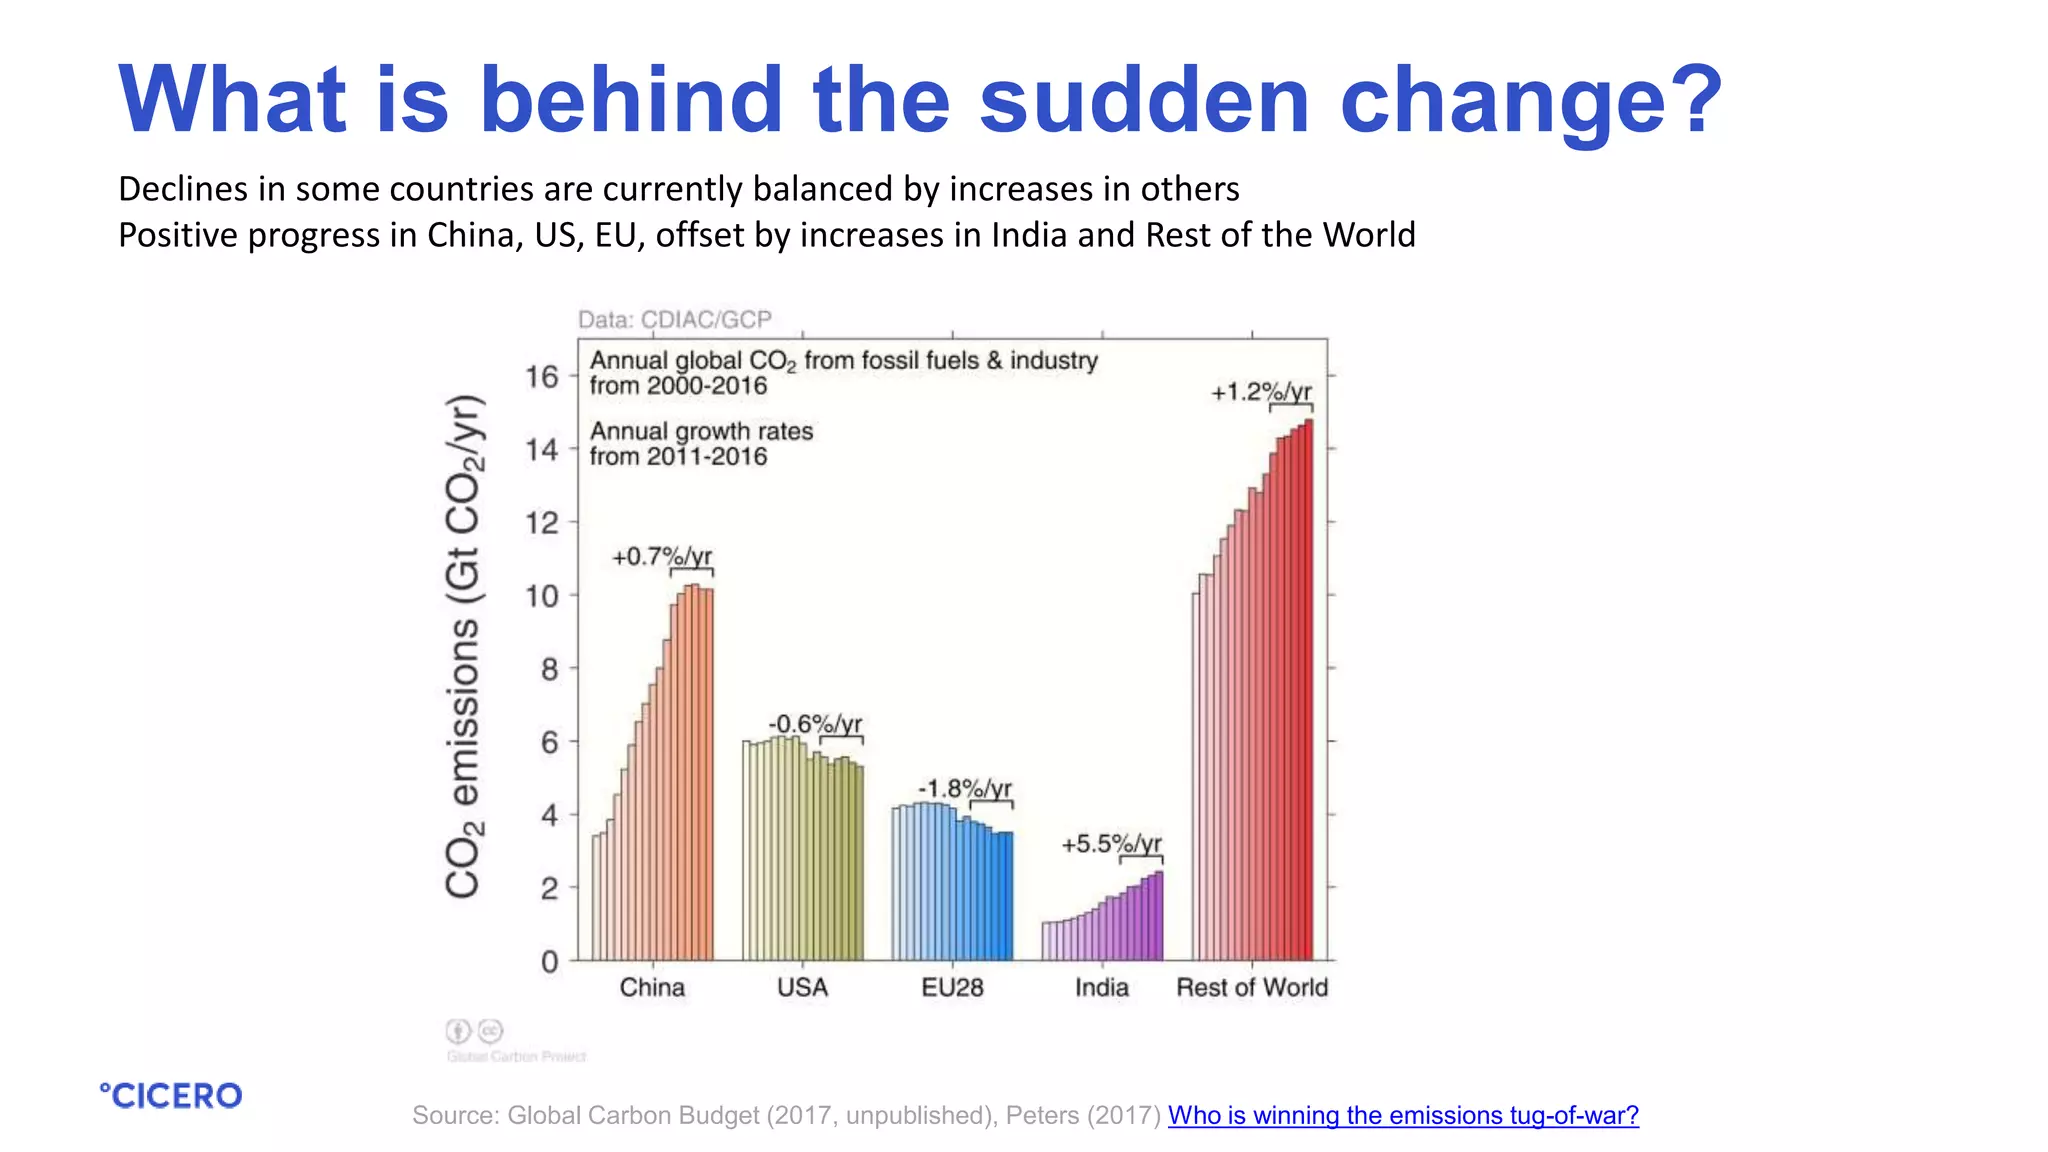
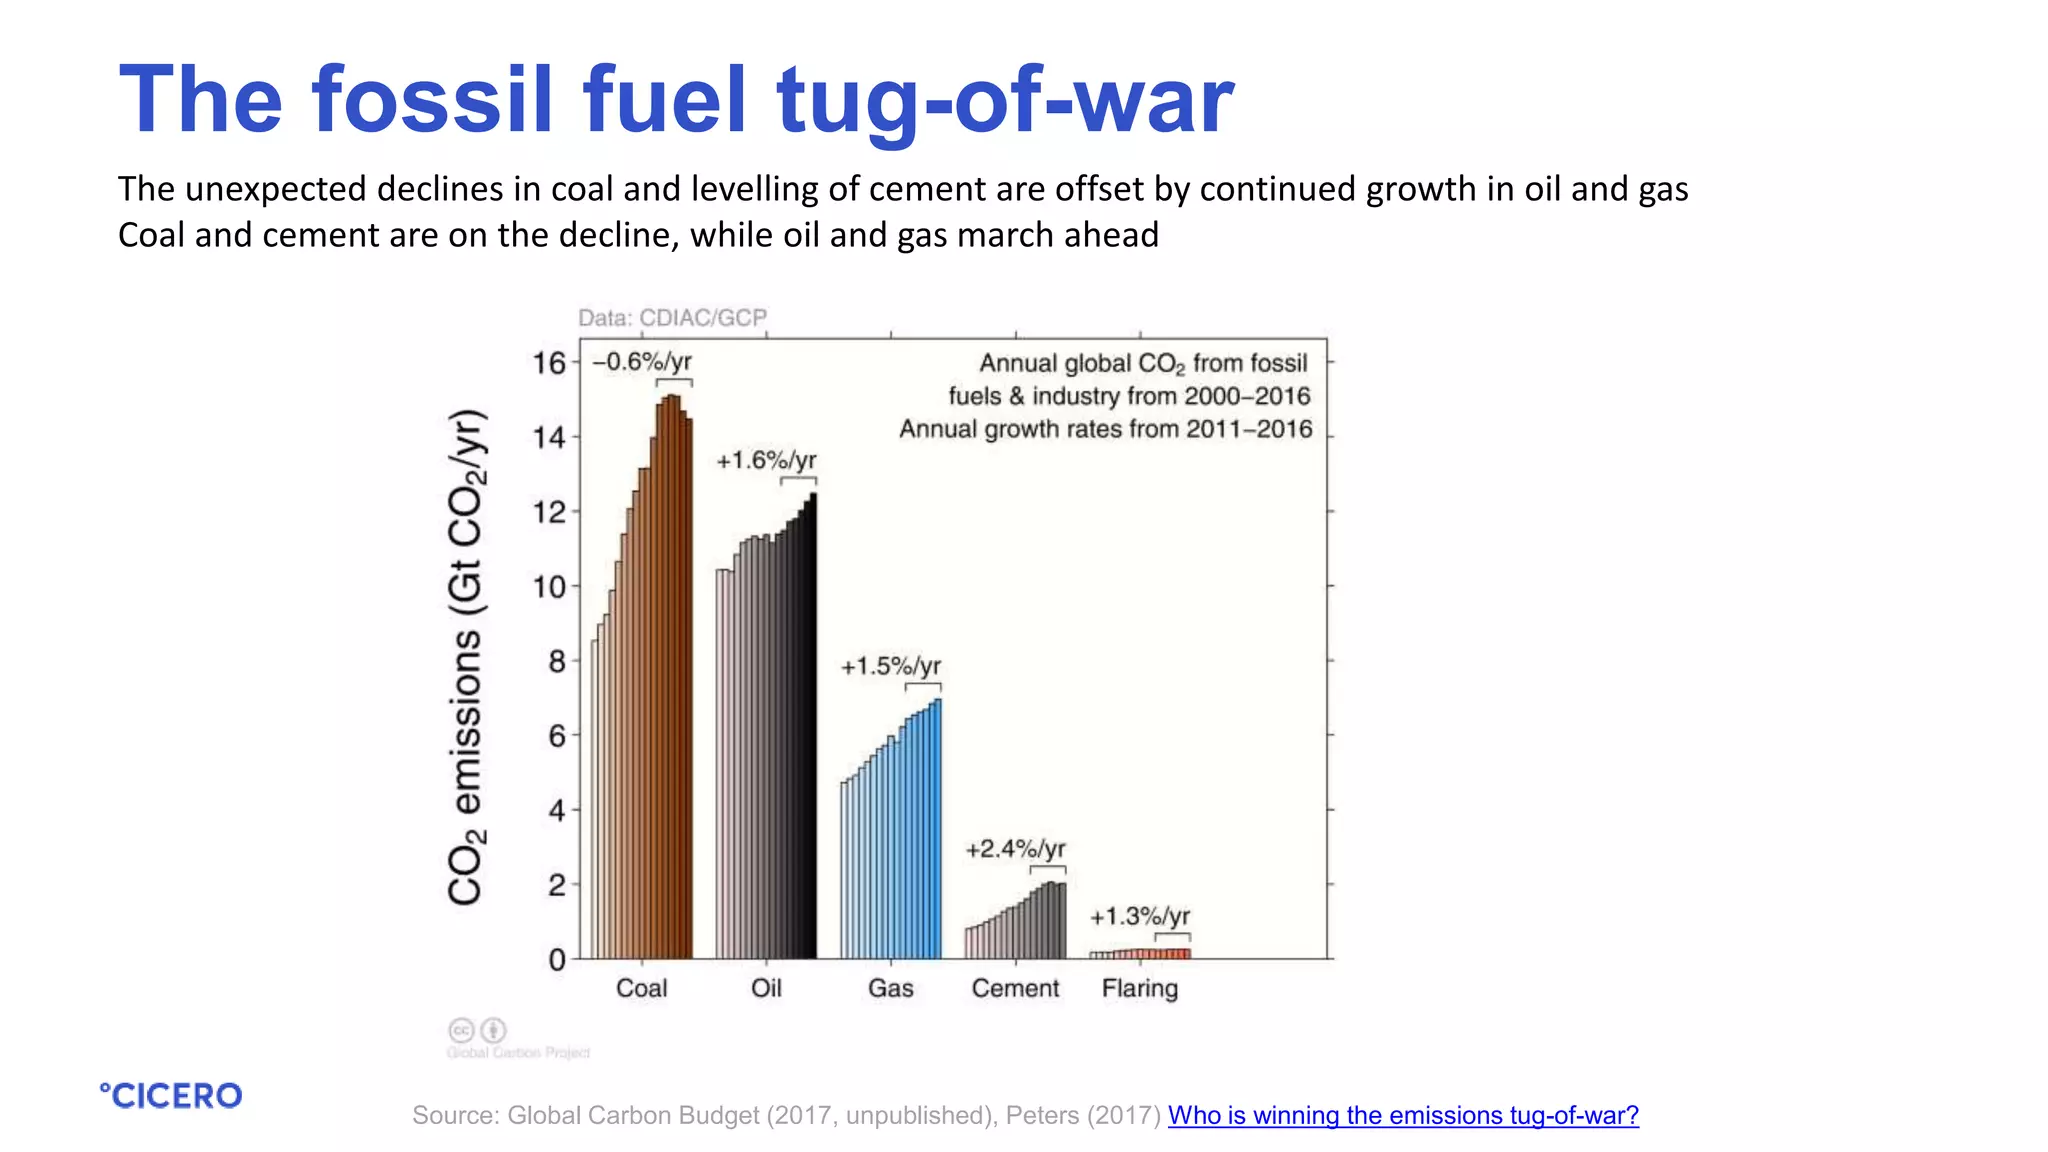

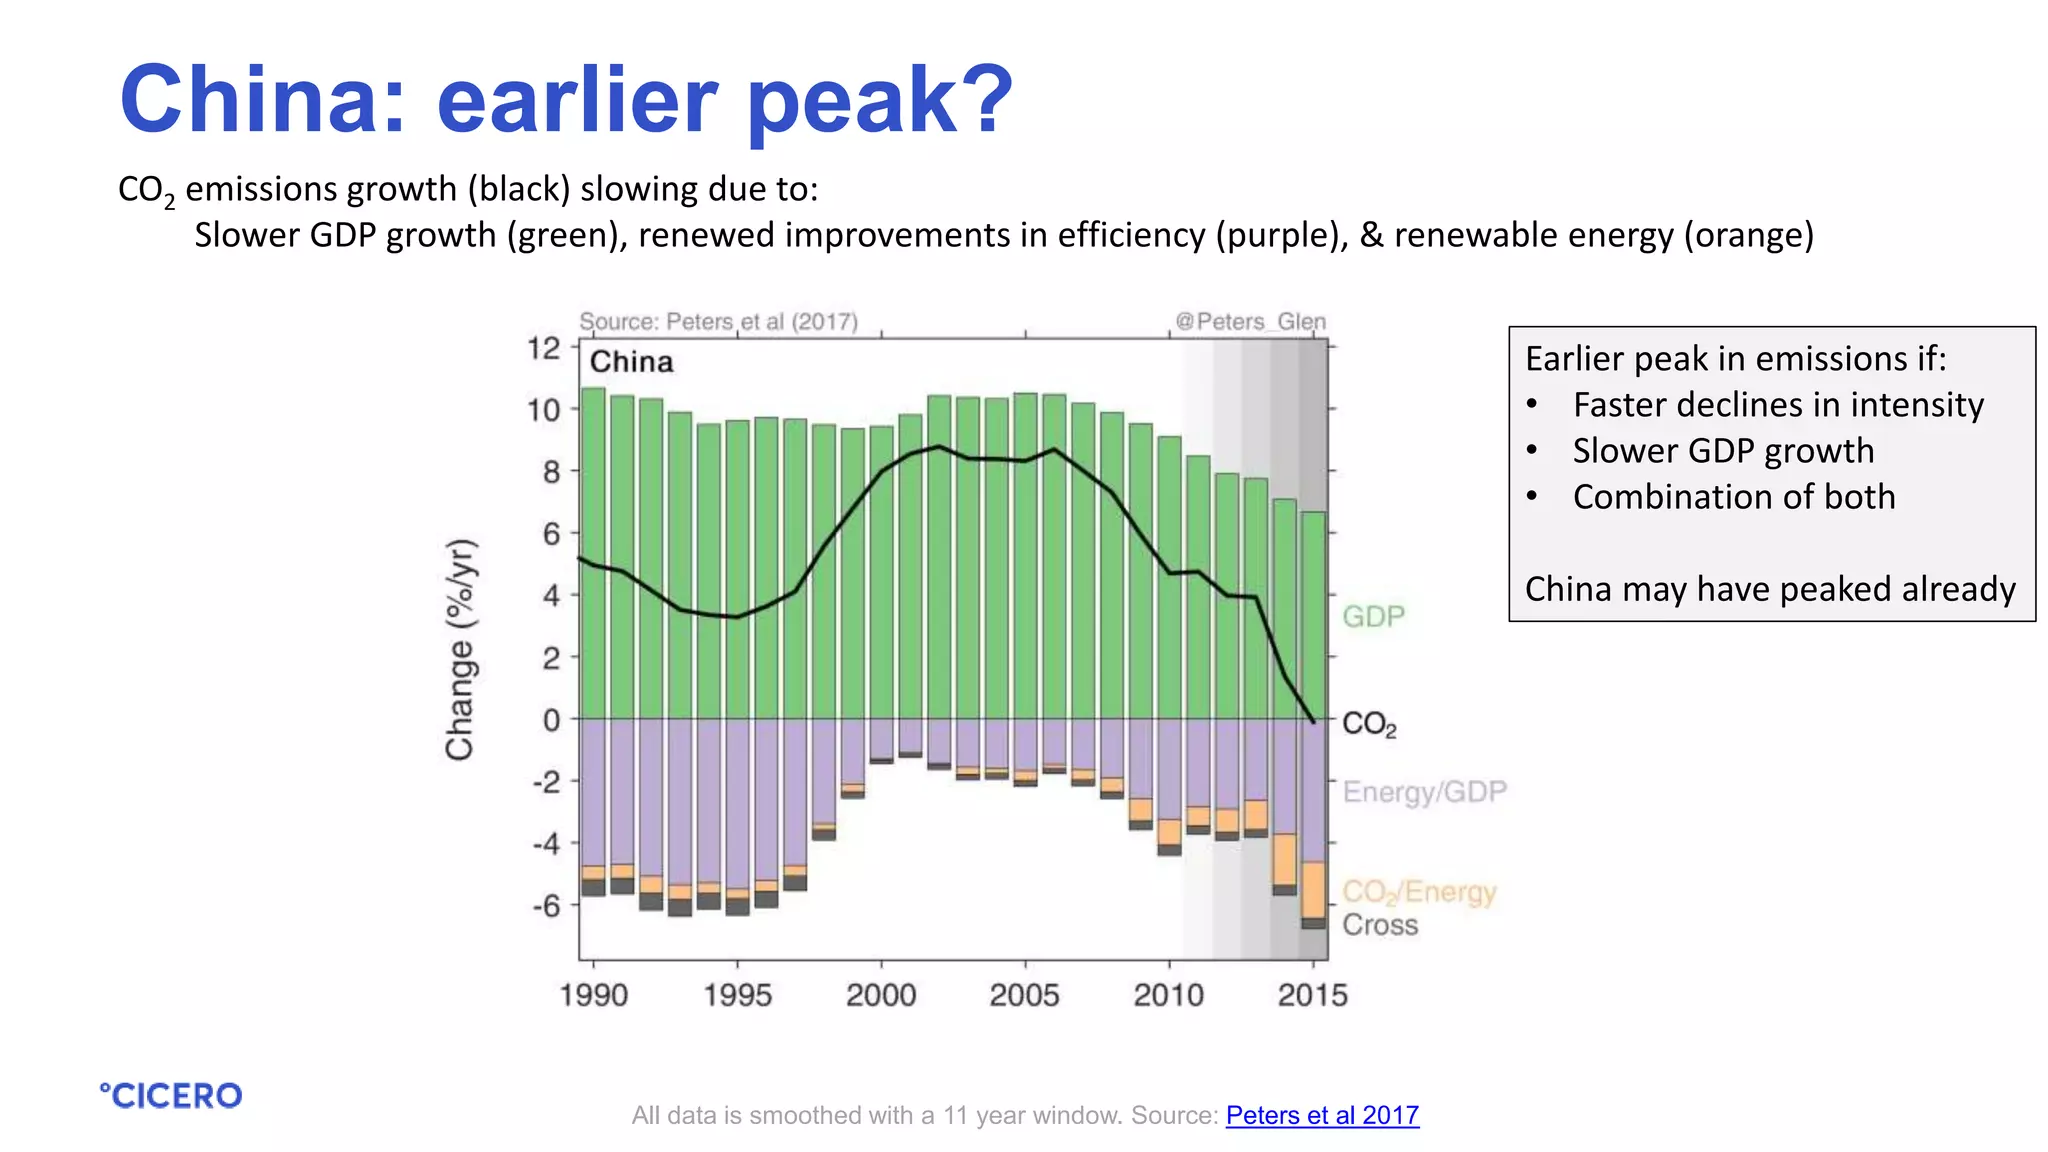
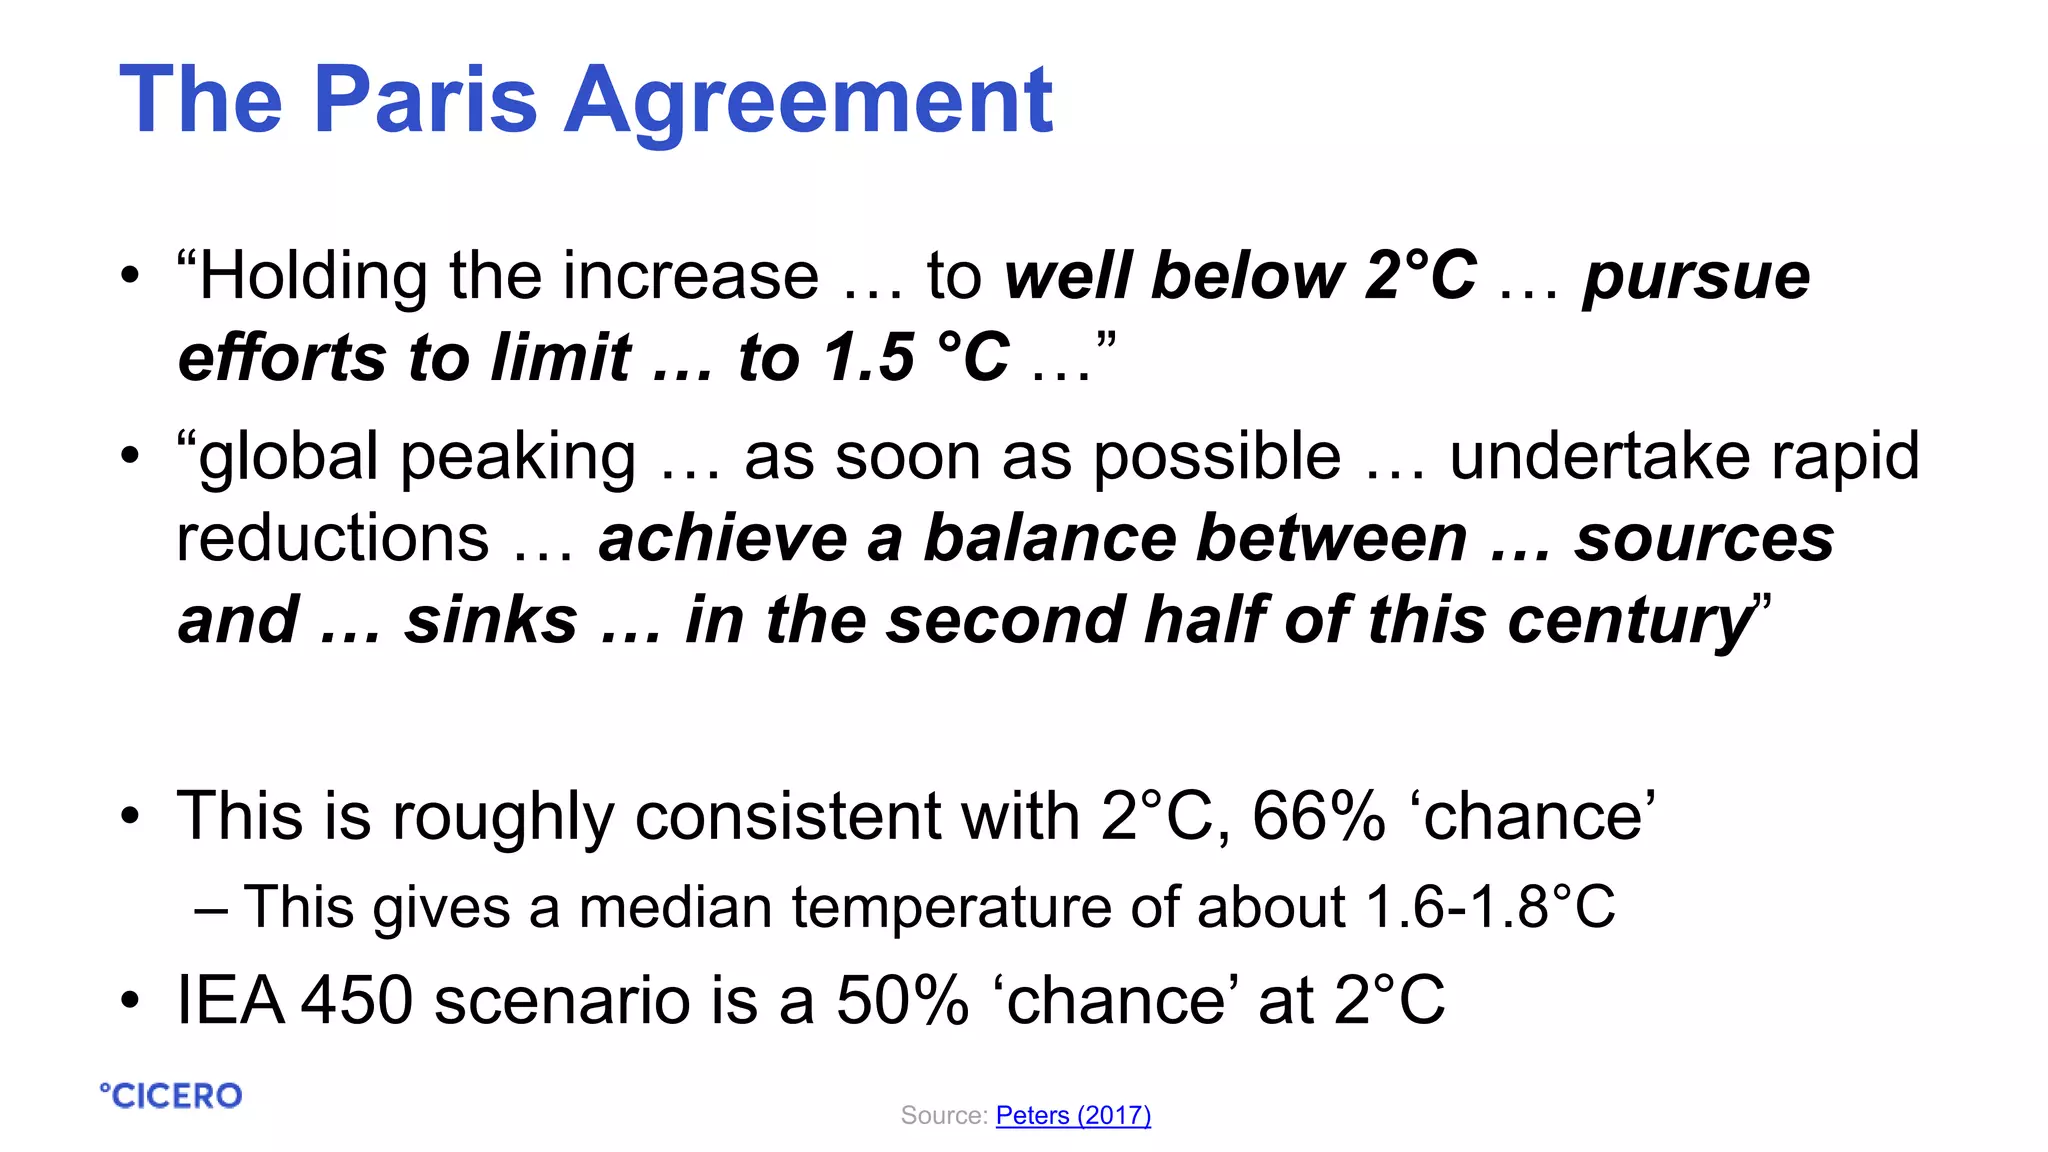
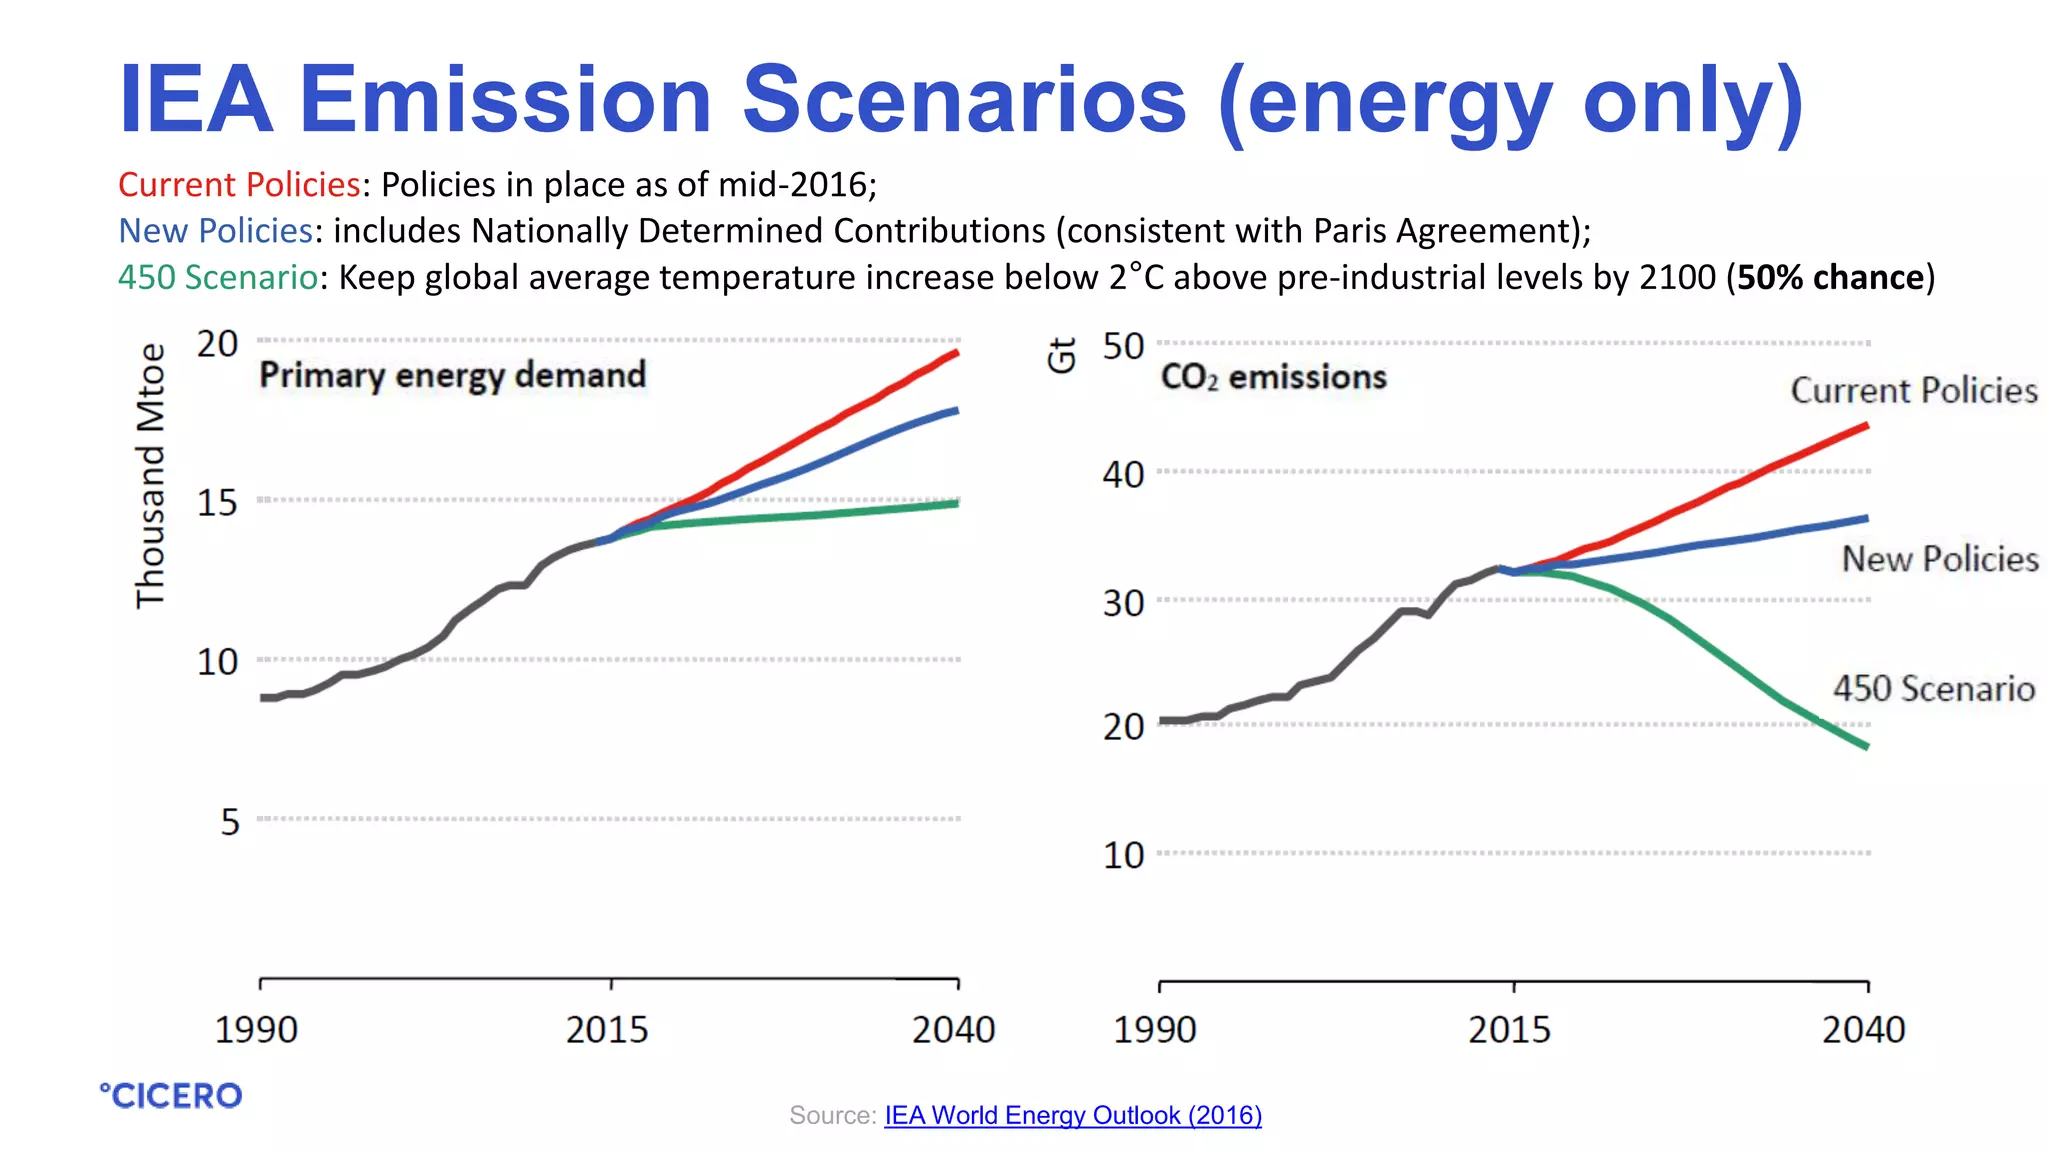
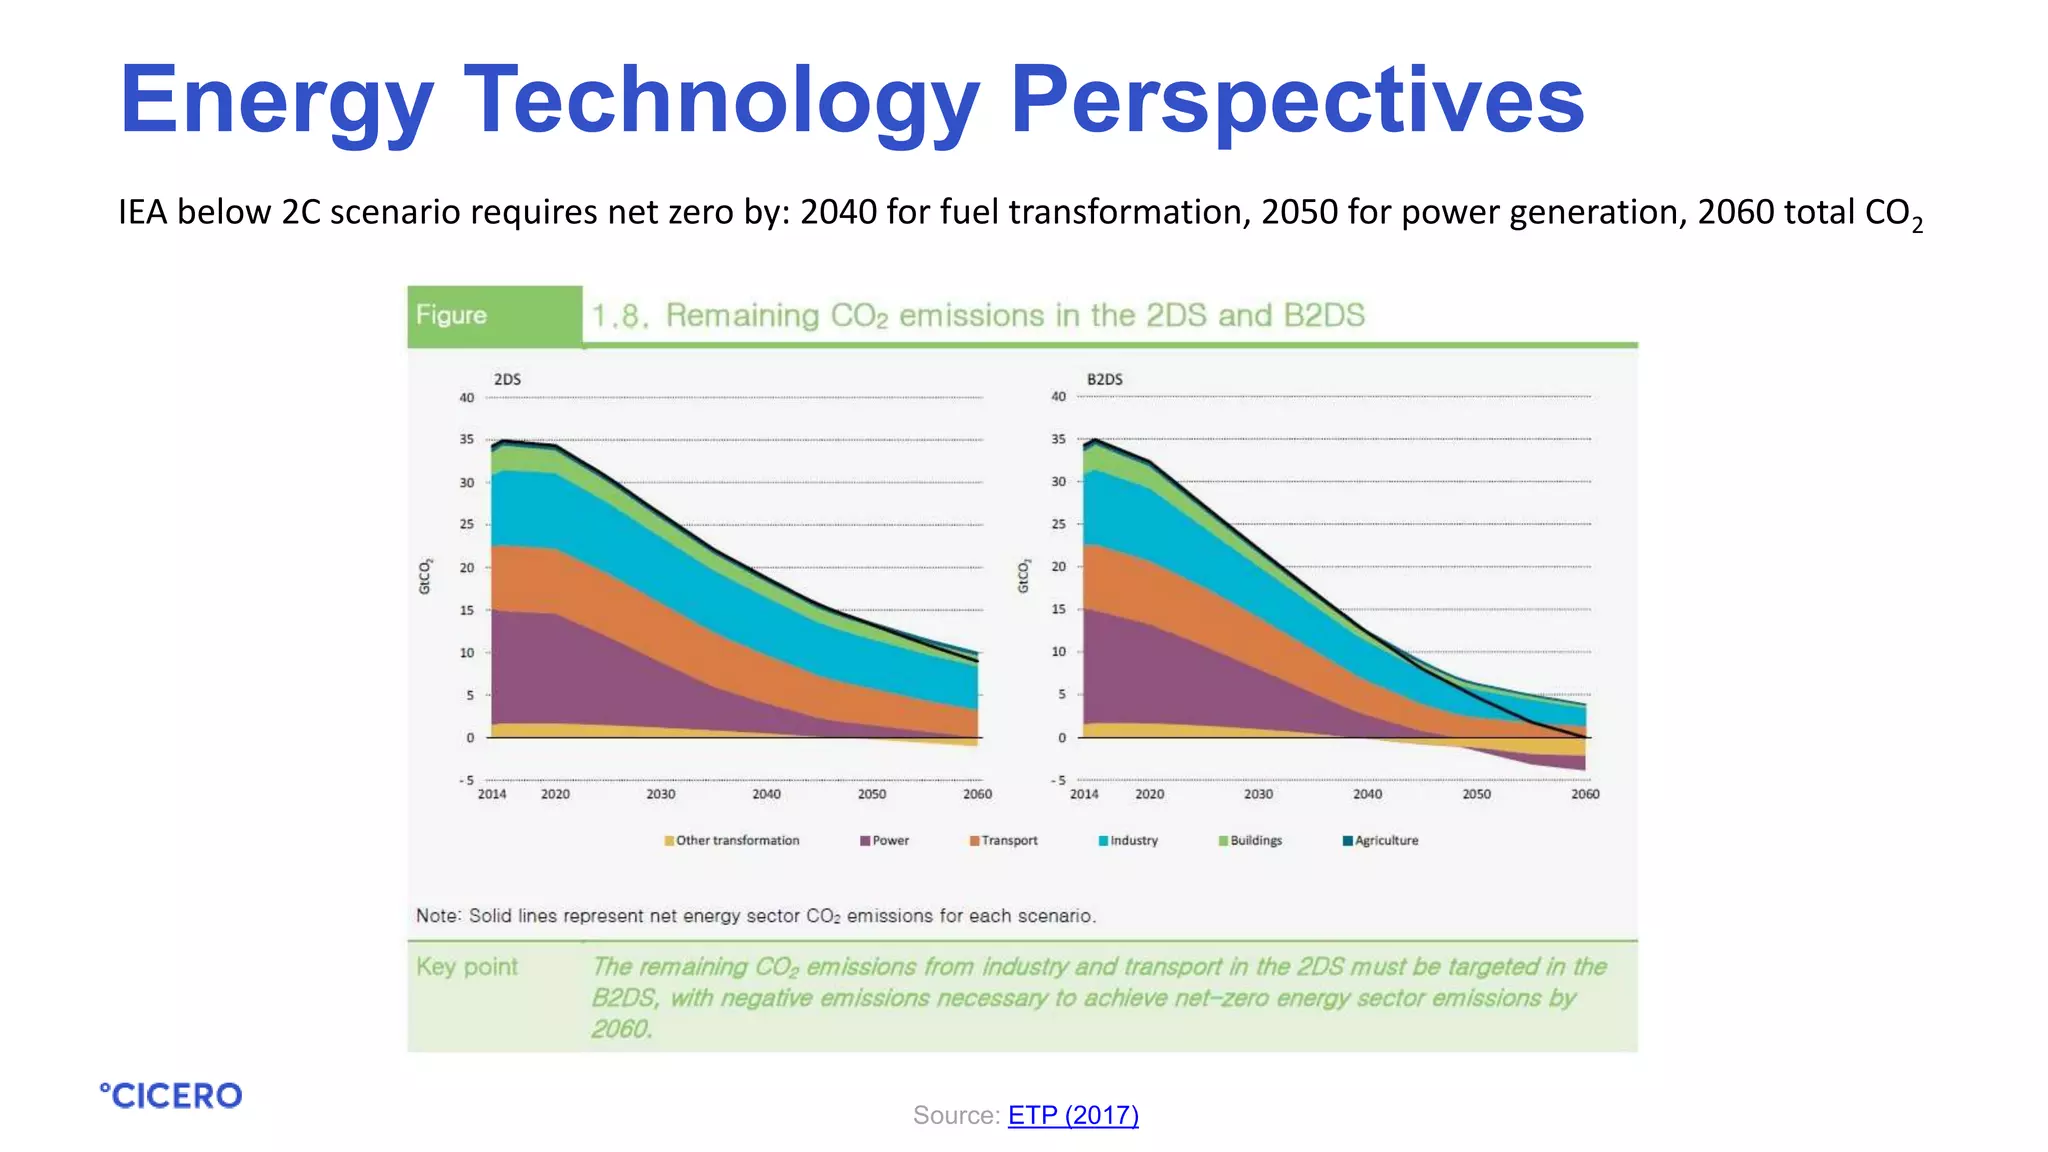
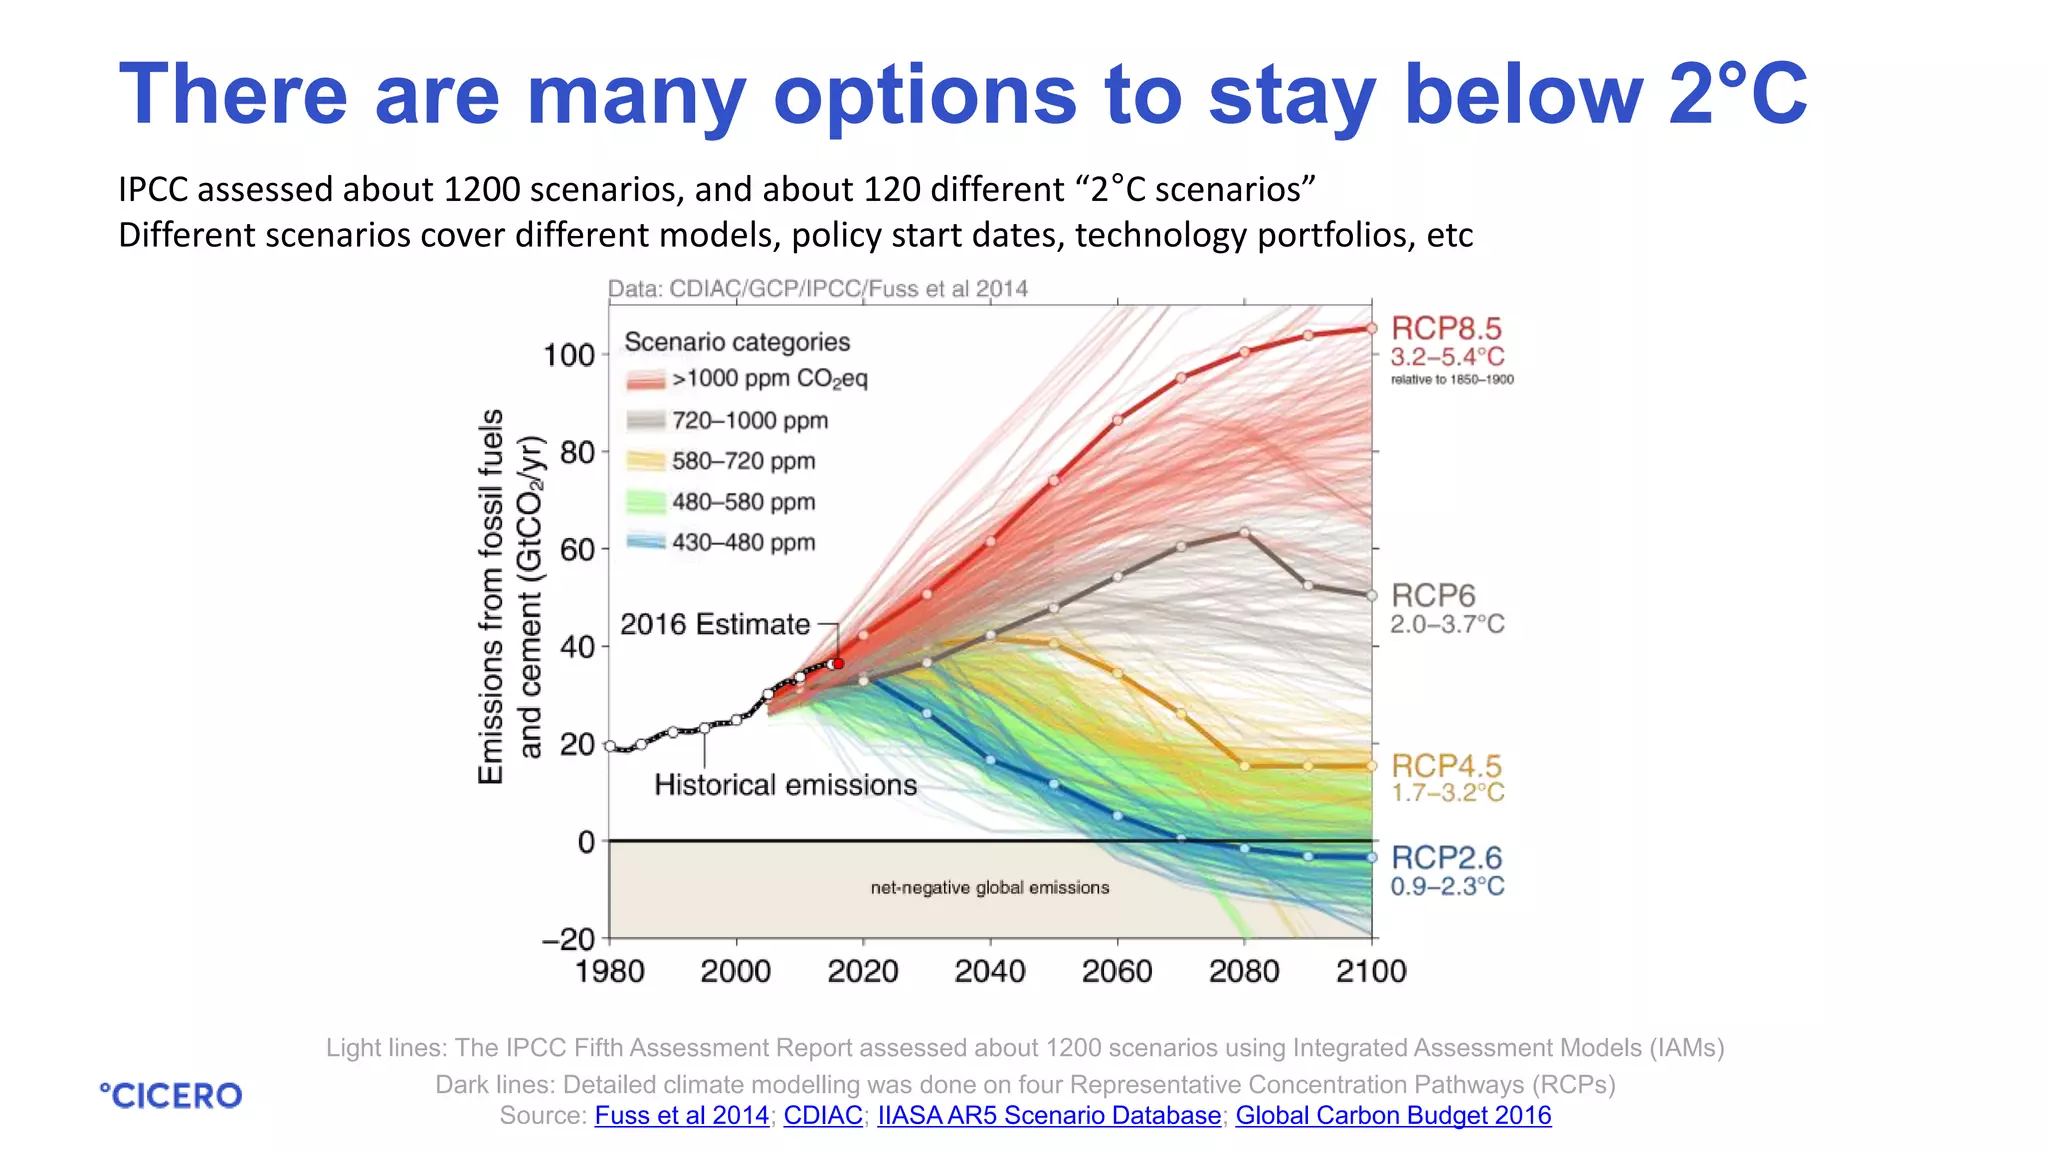
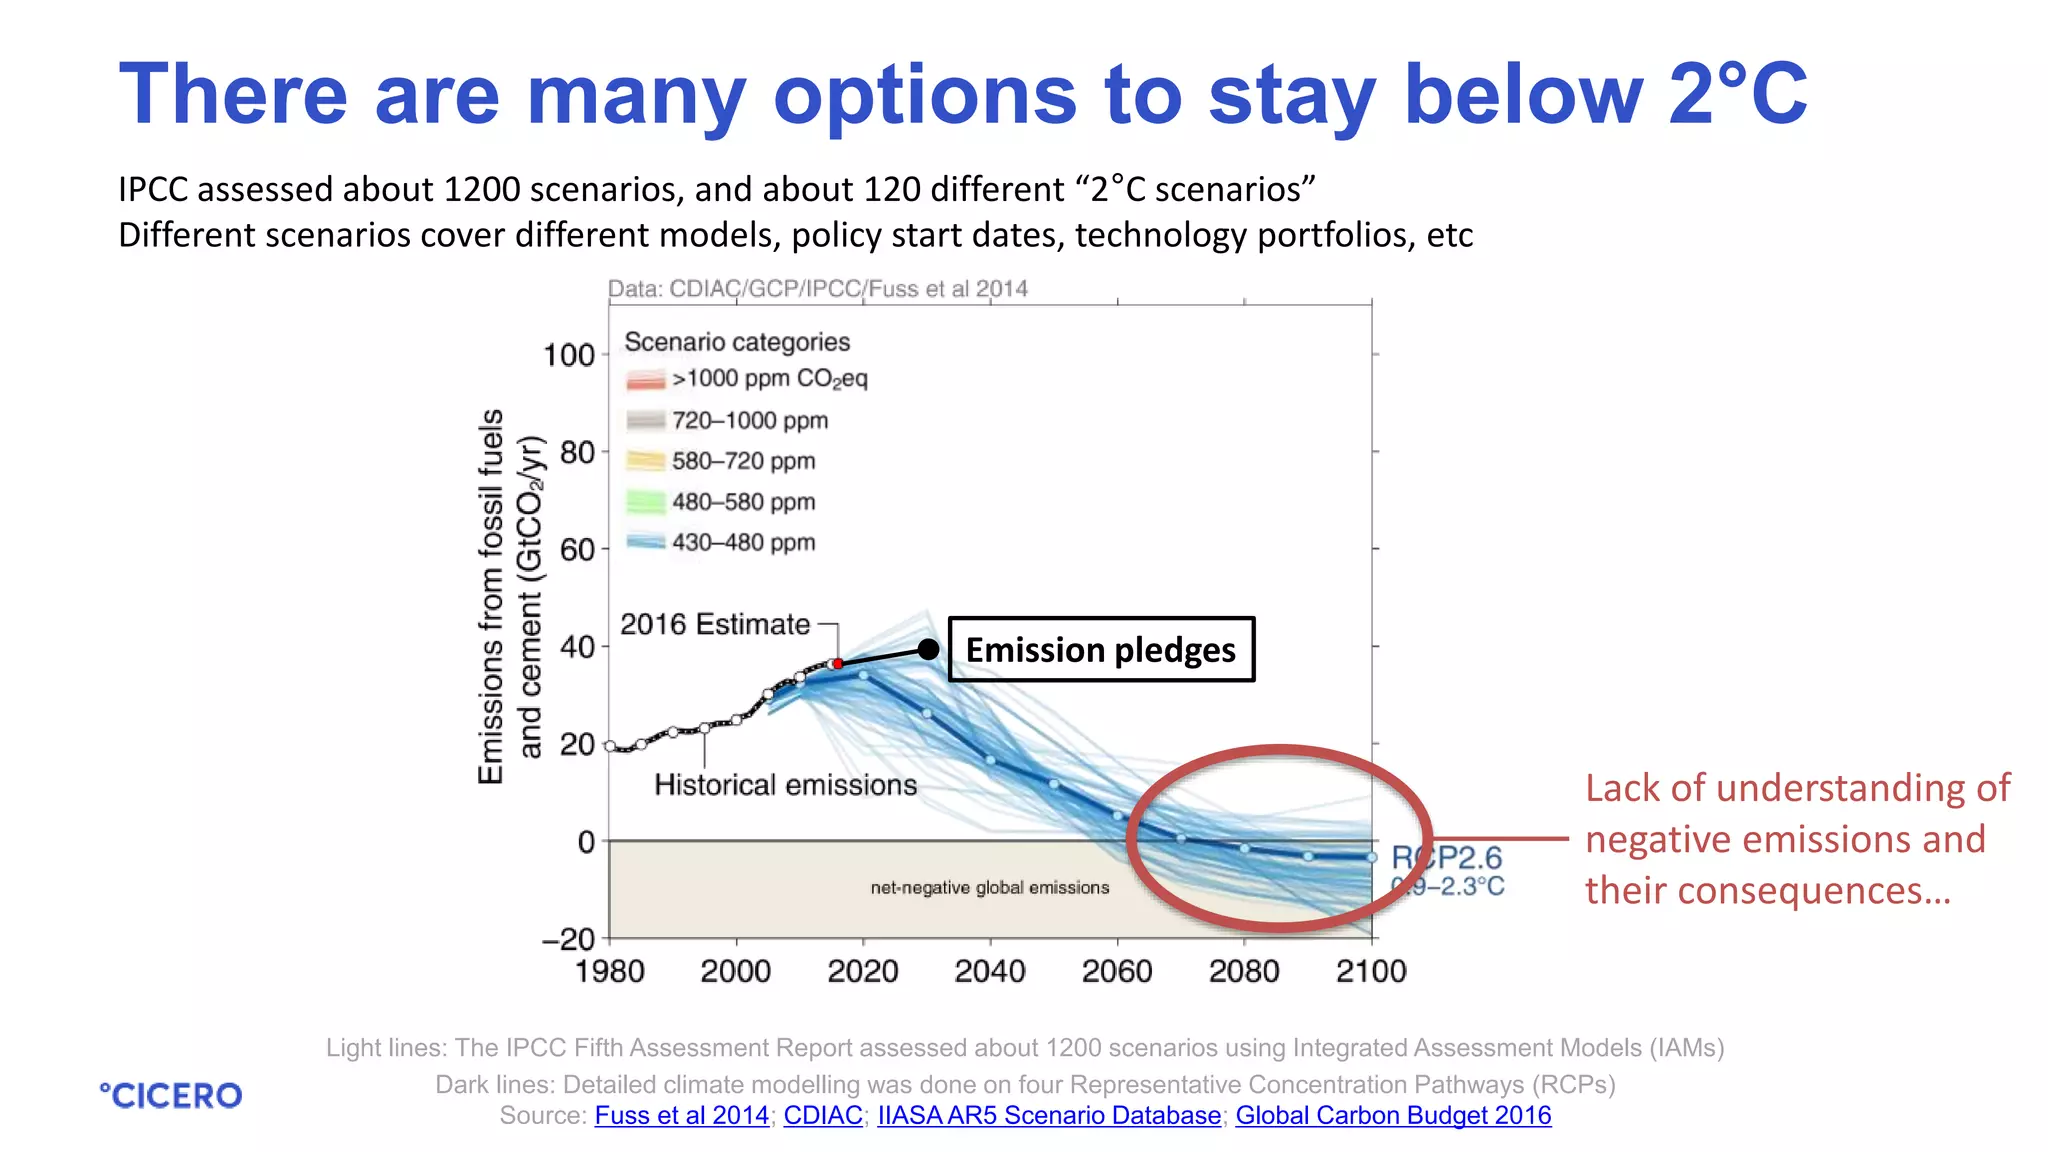

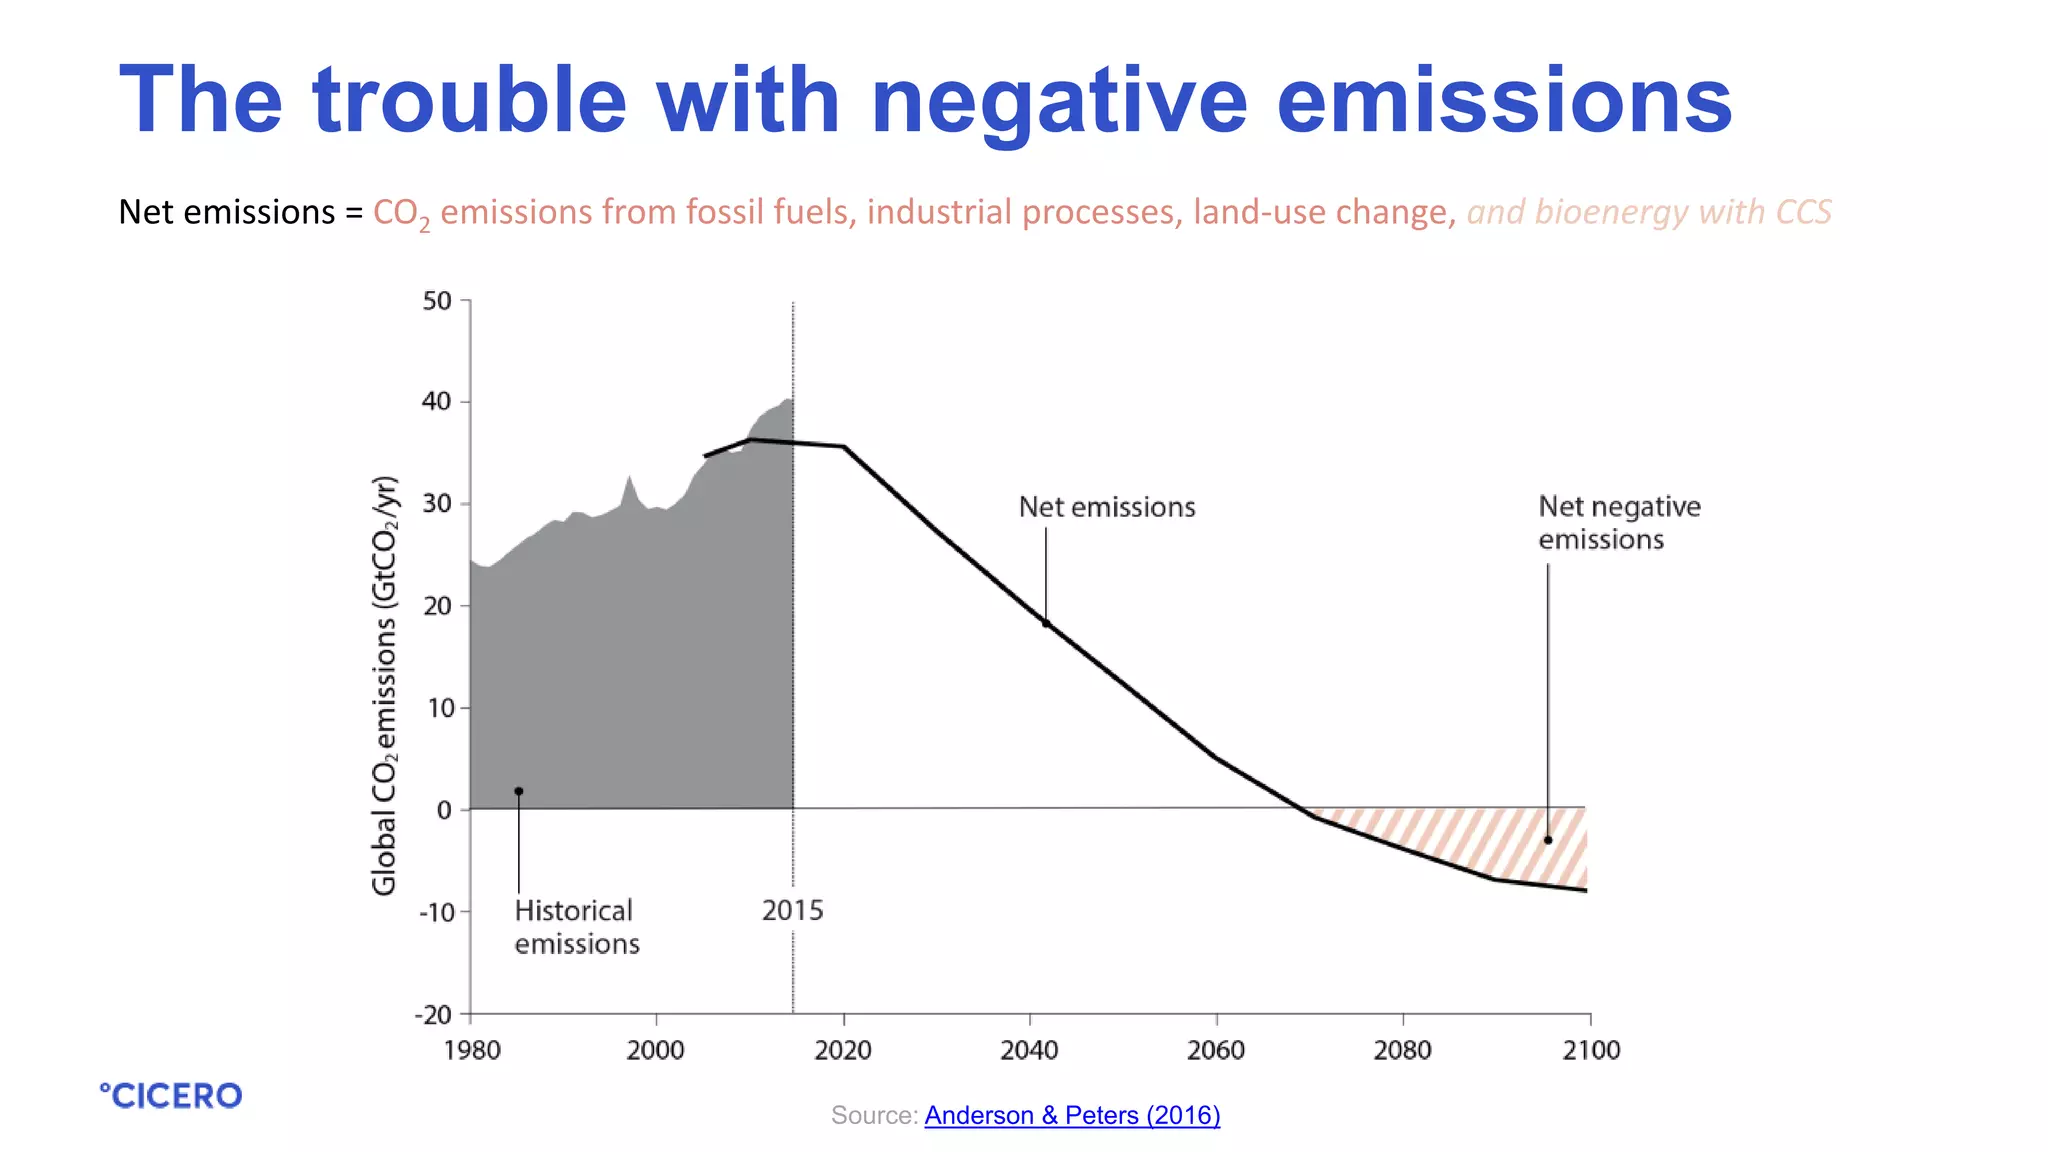
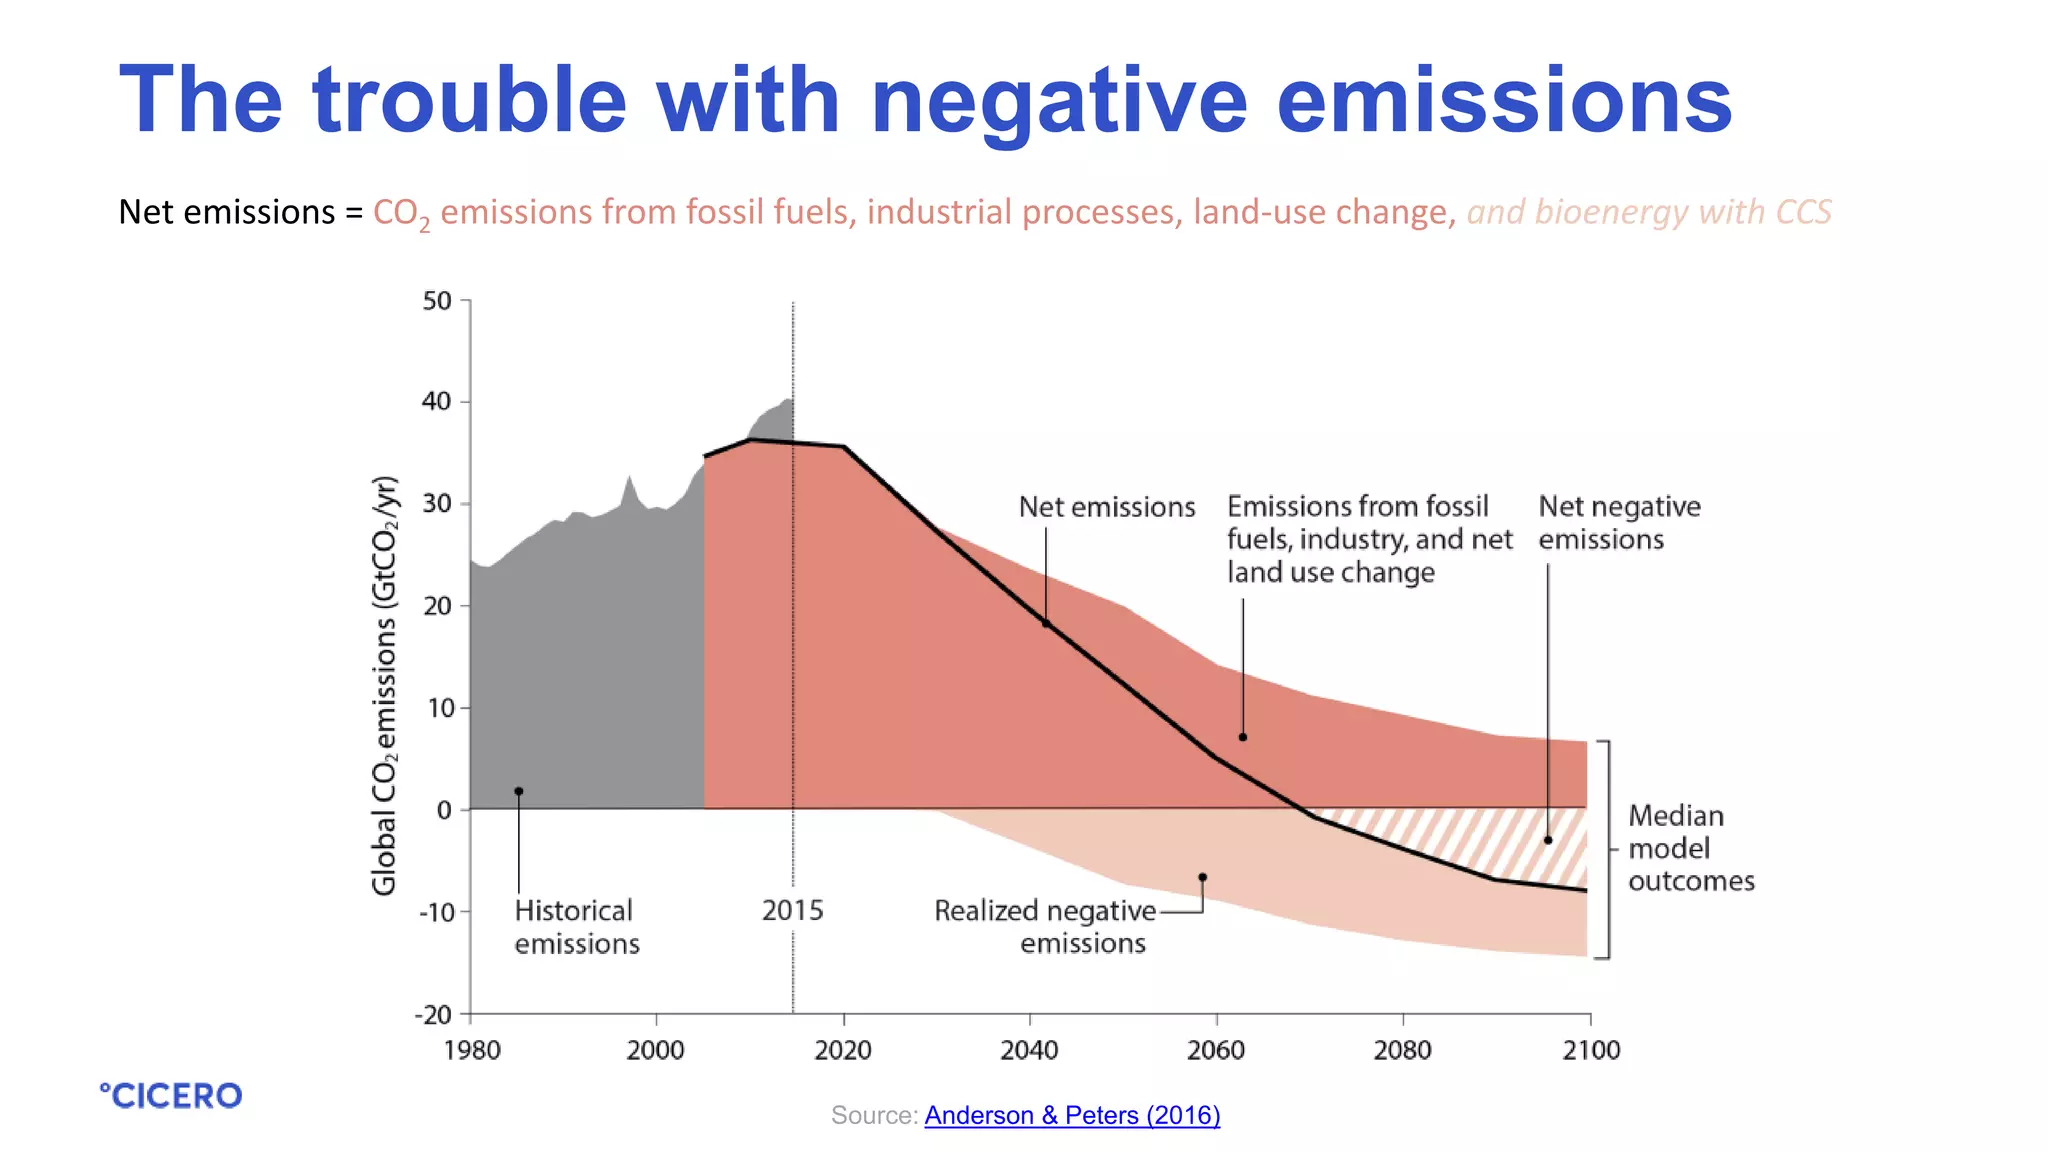
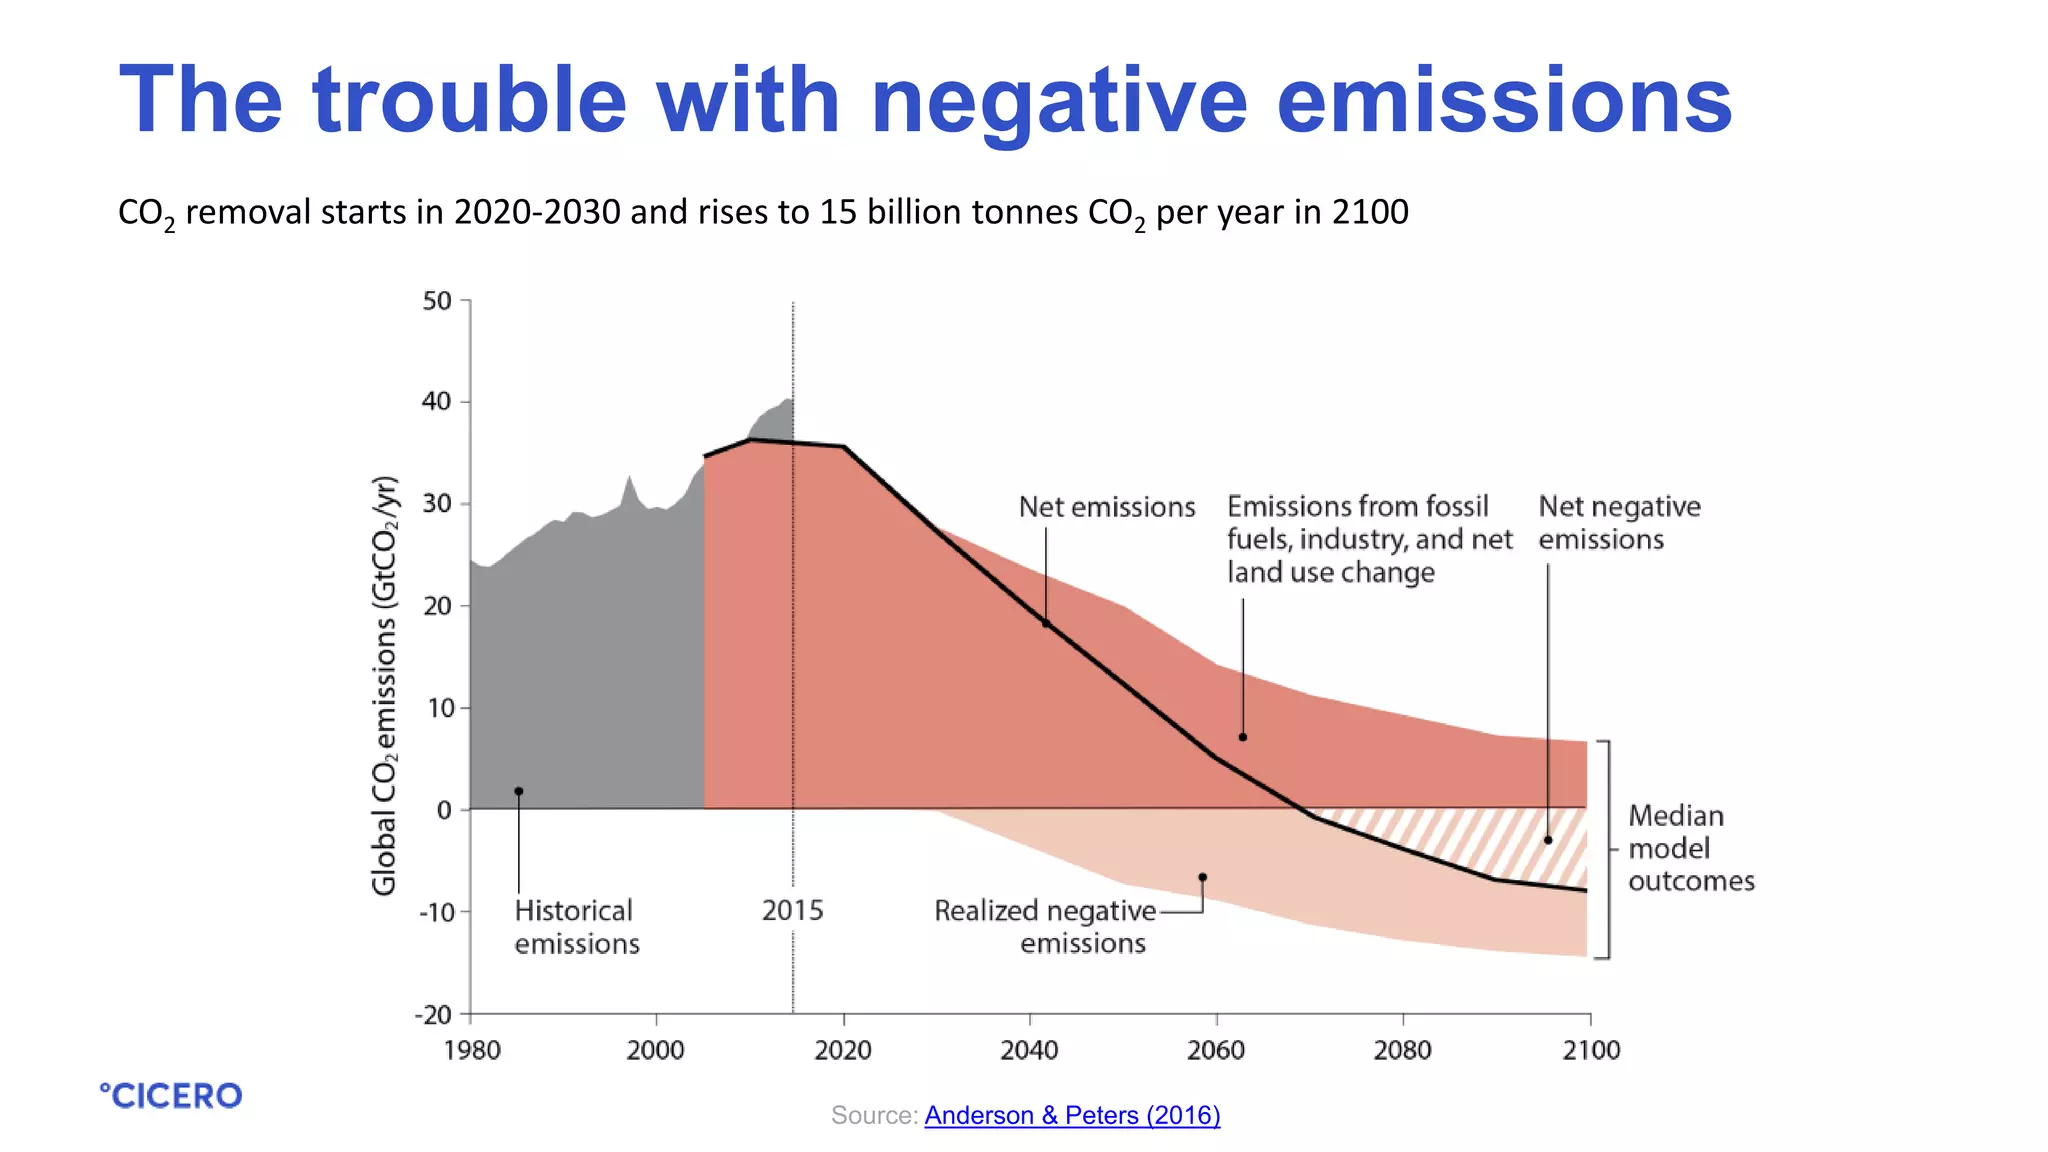
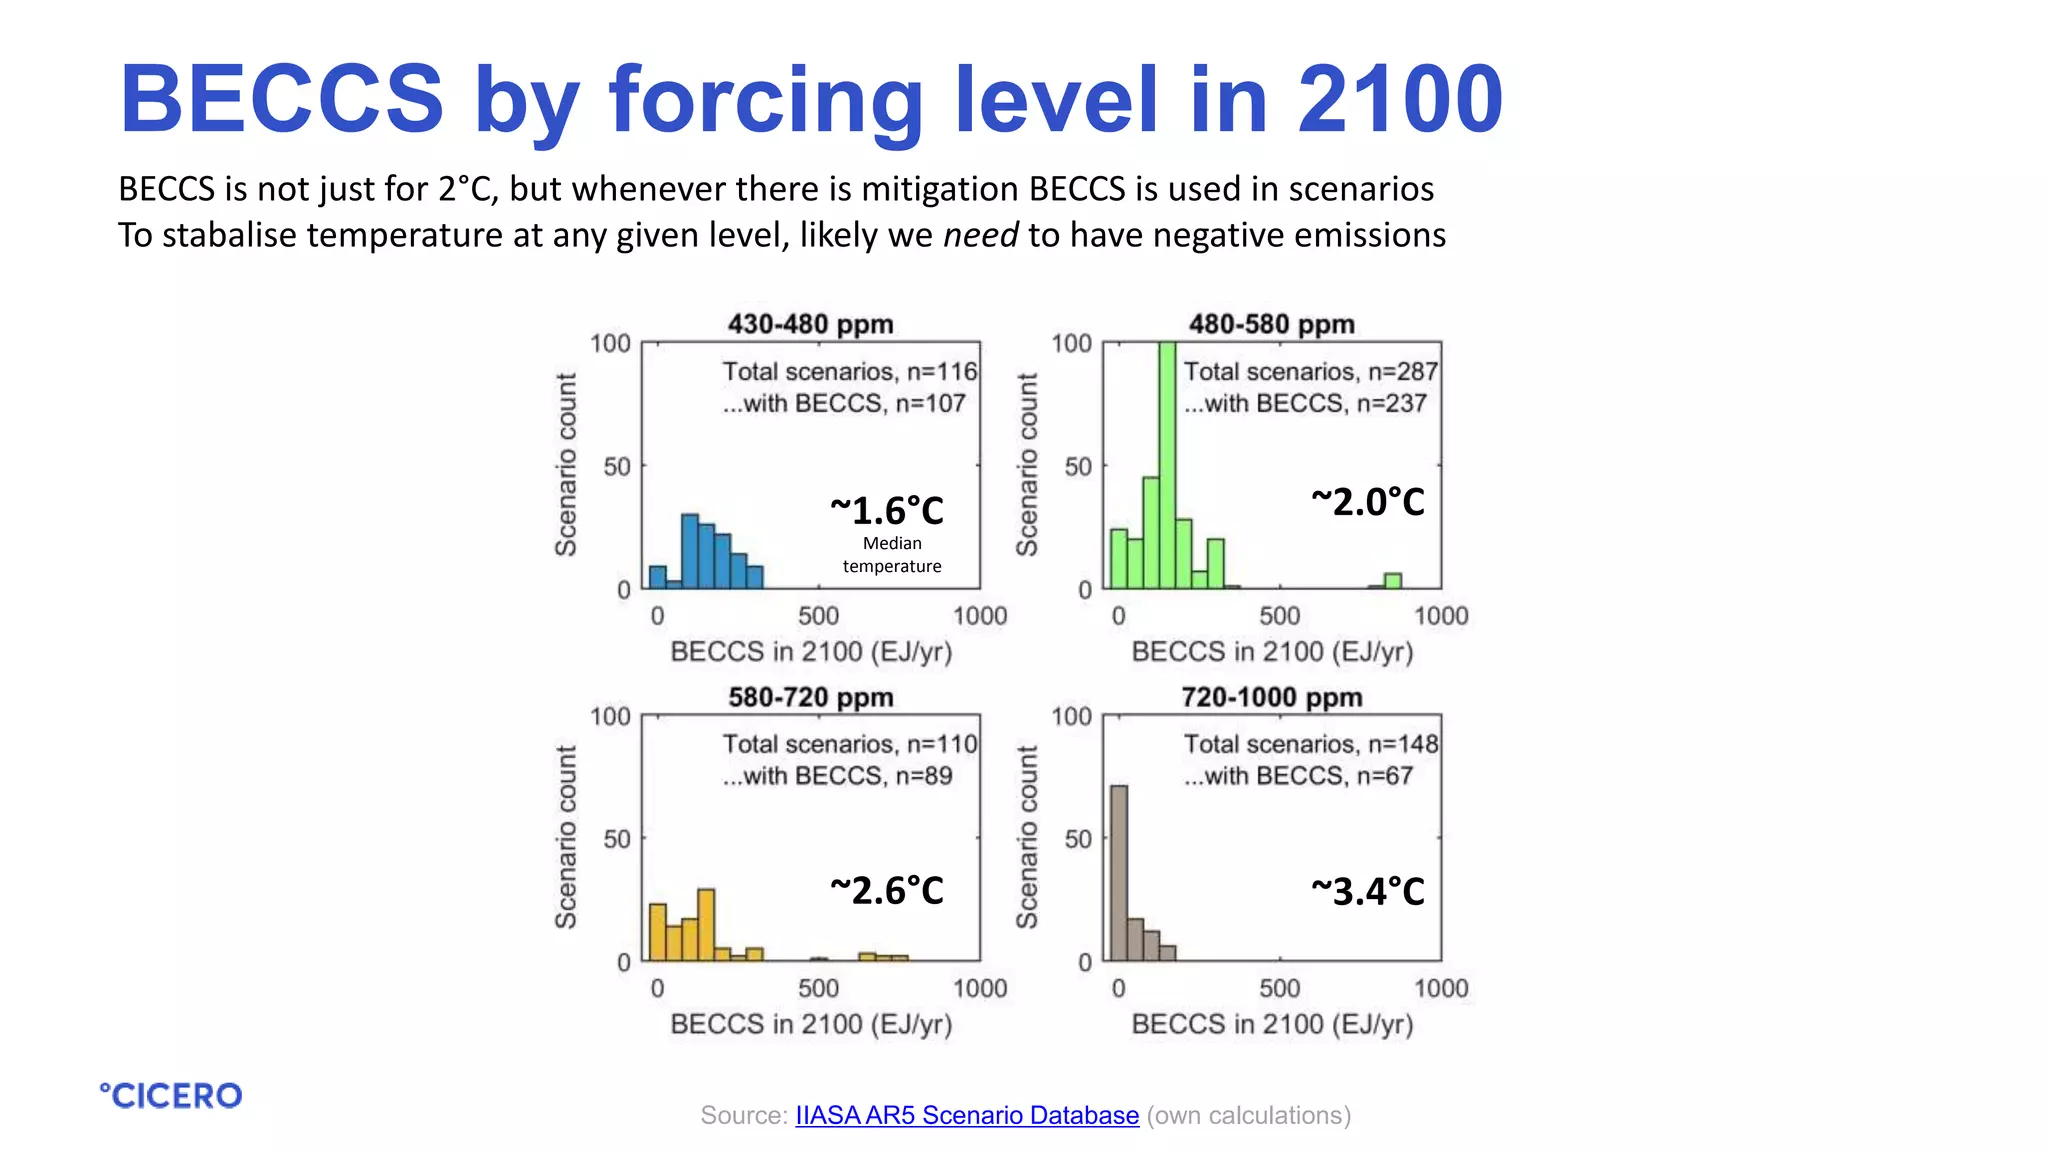
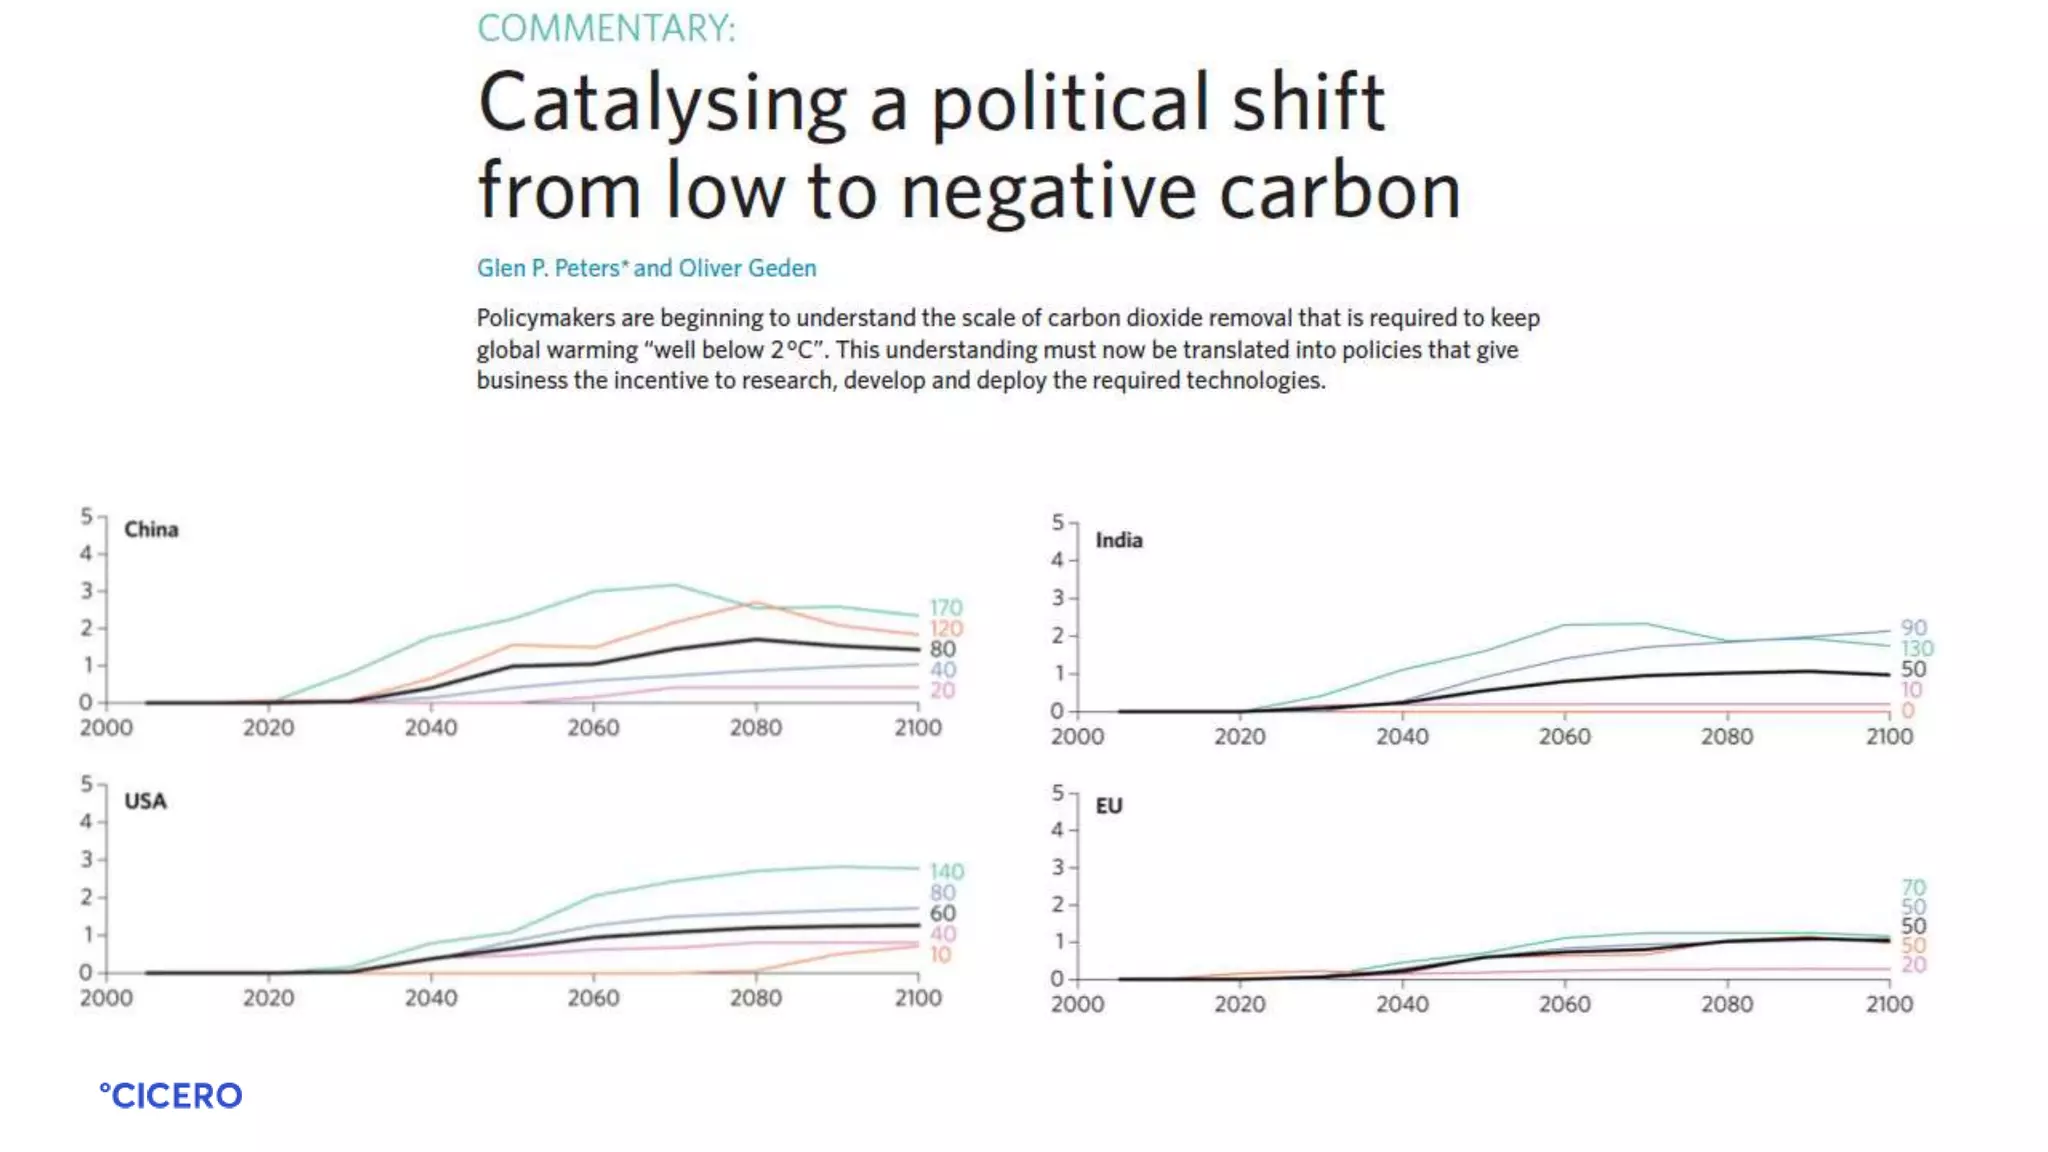

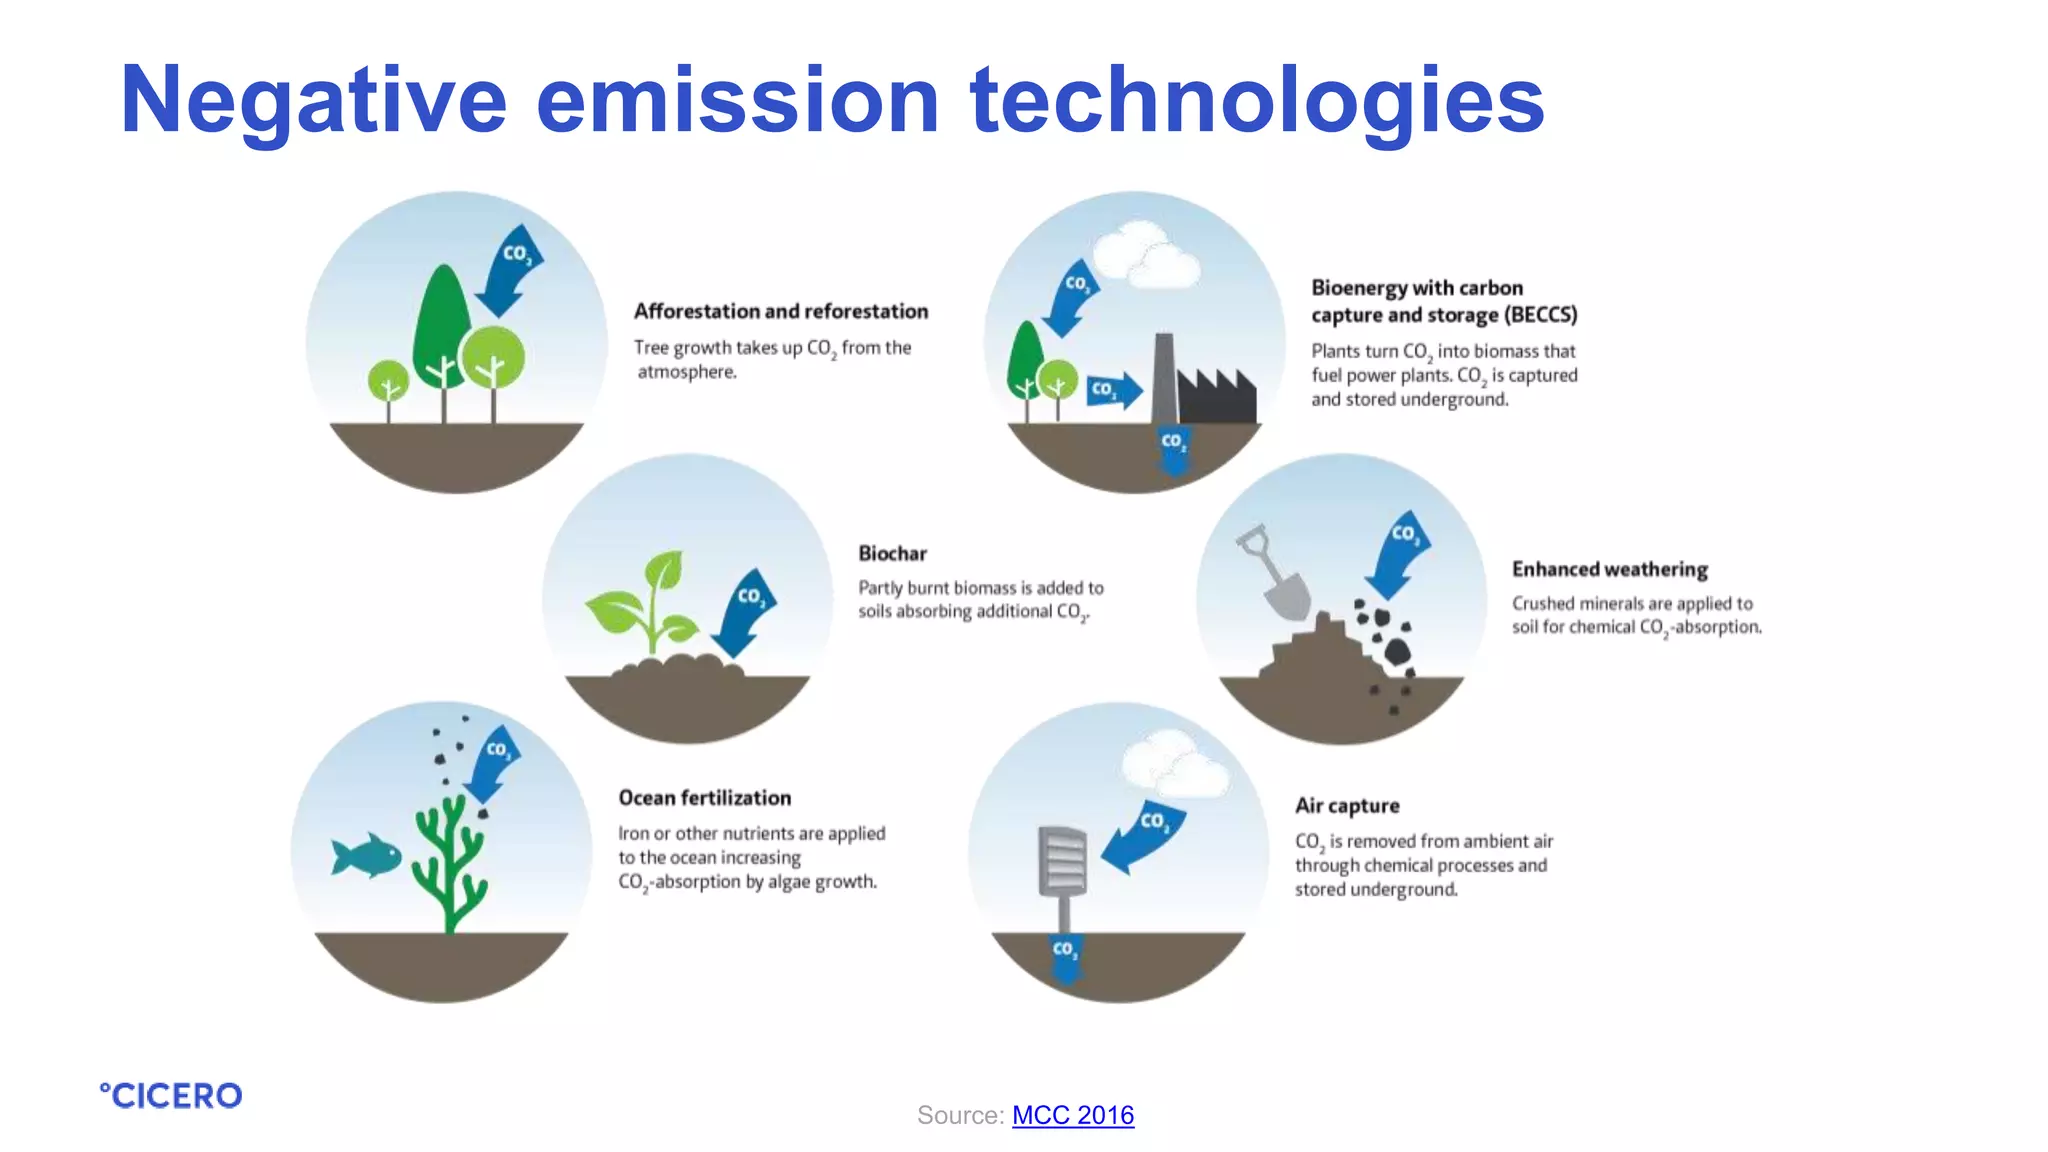

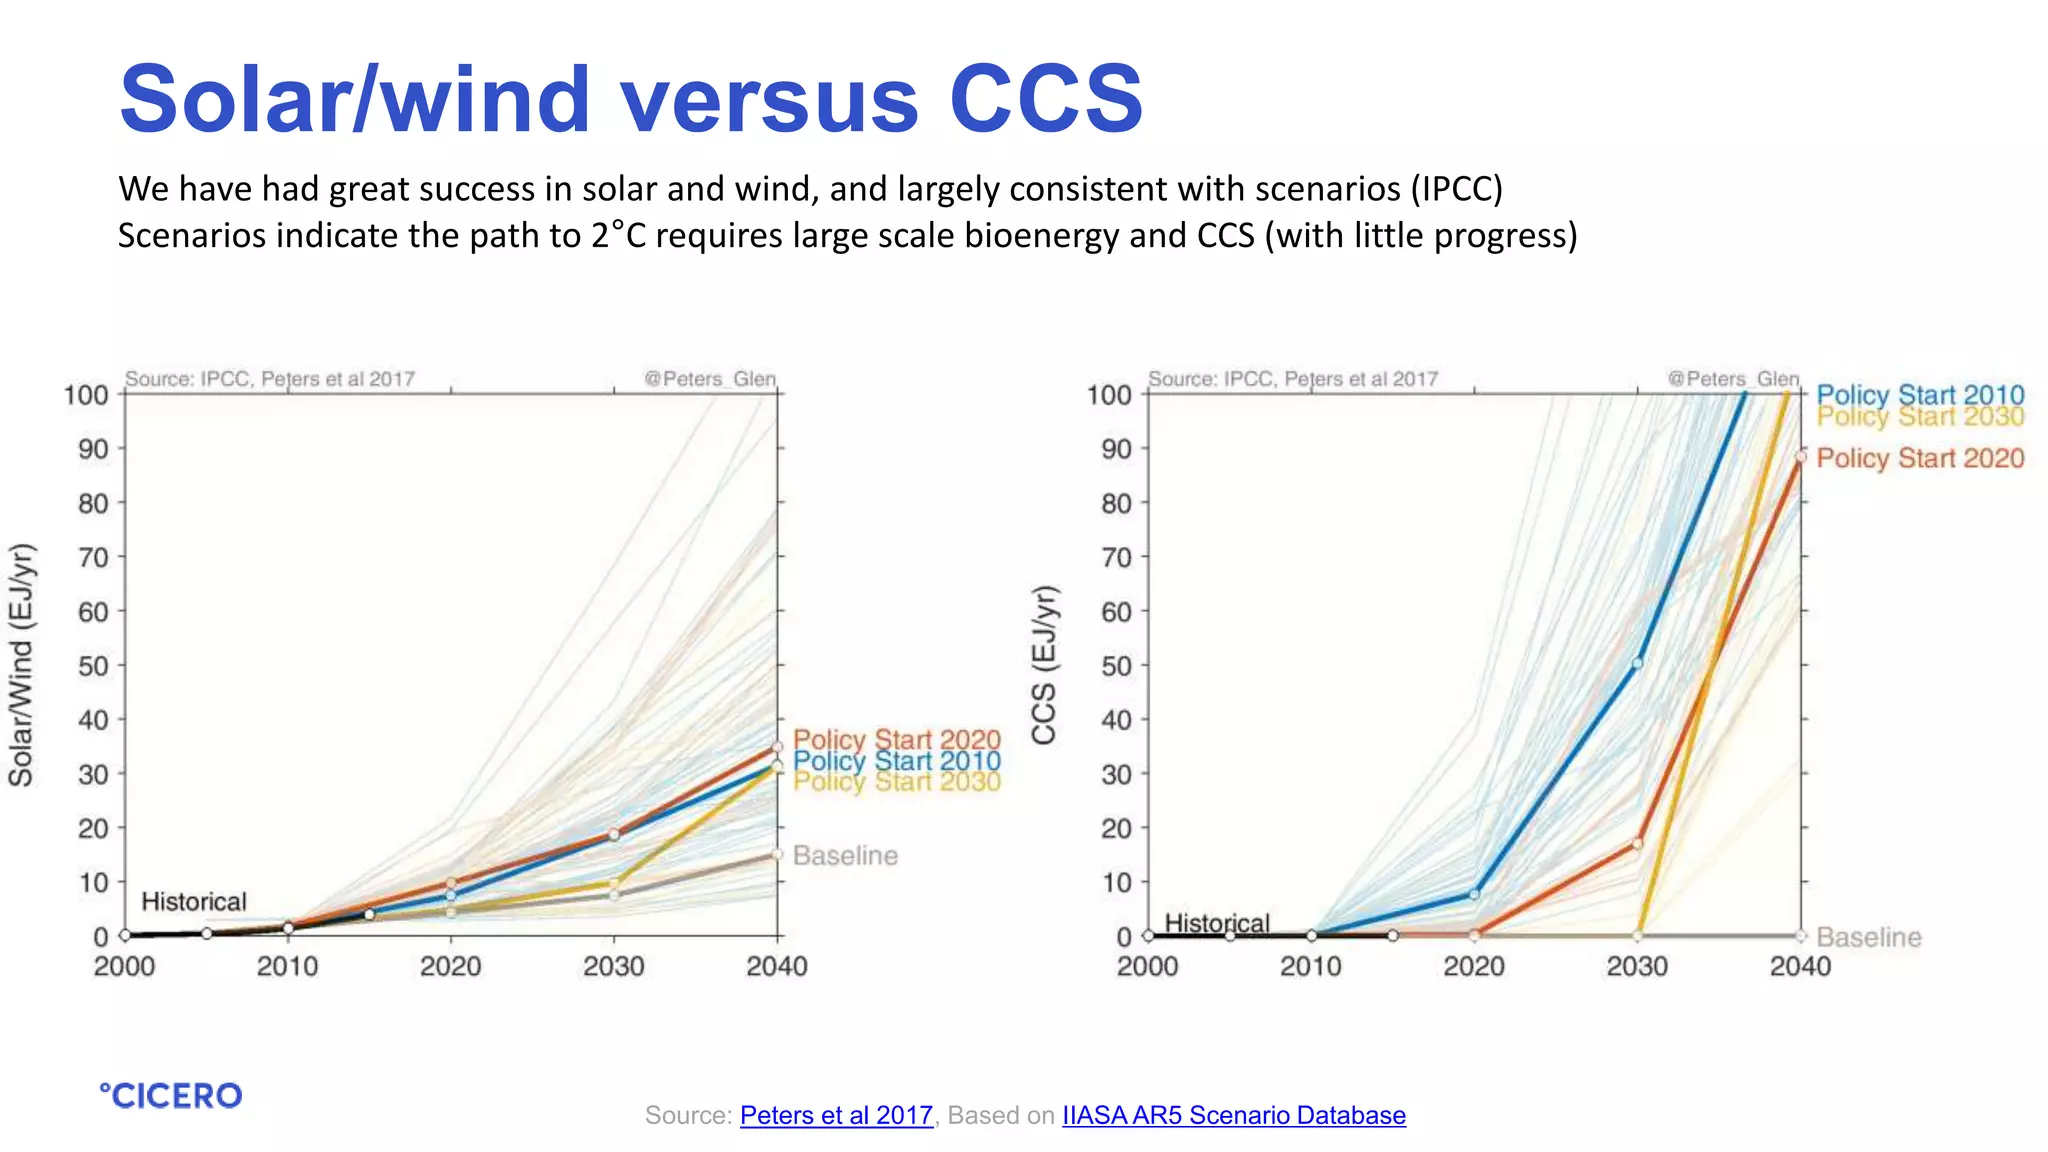
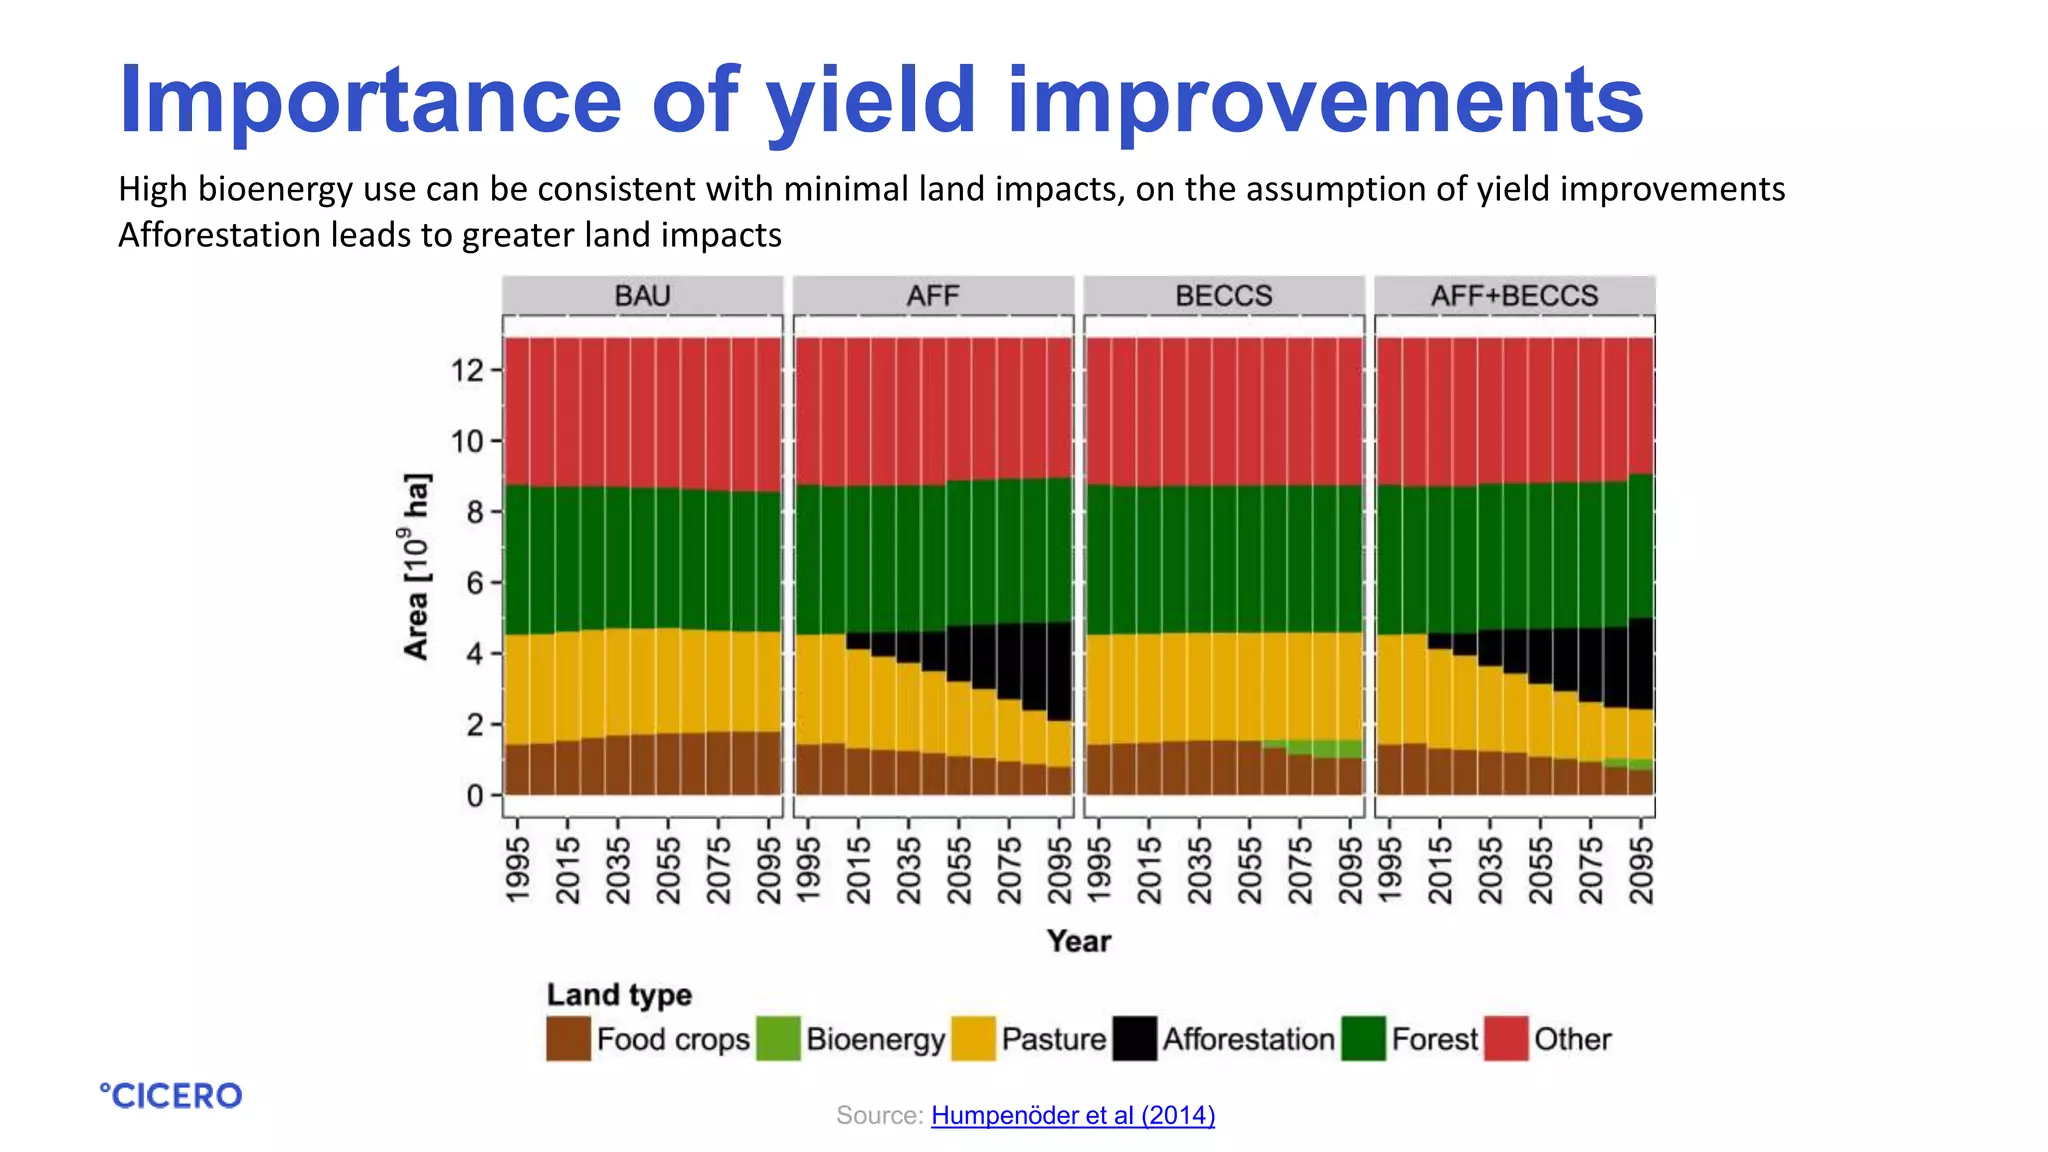
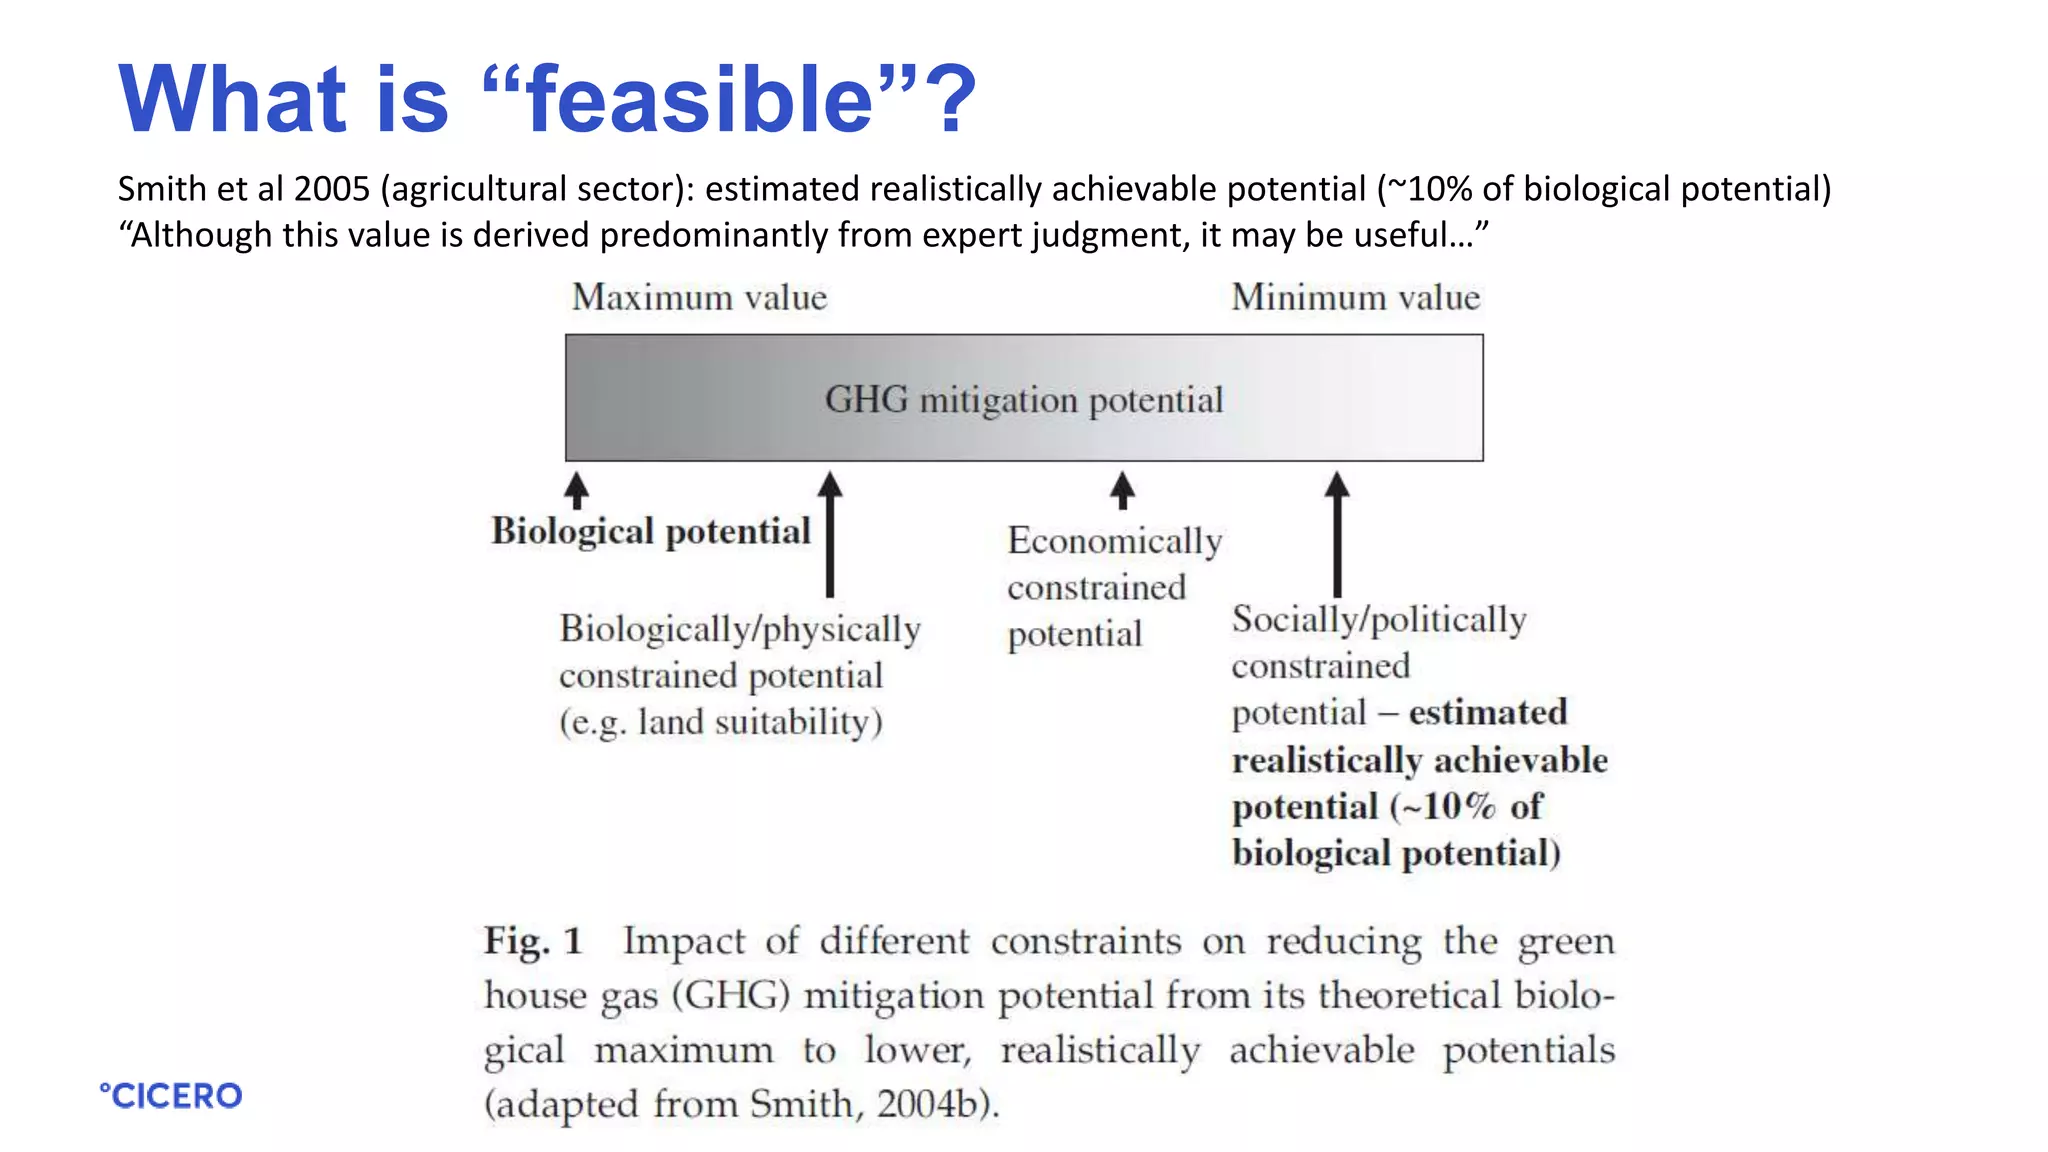


The document discusses global emissions trends and the potential pathways to limit temperature rise to 2°C, highlighting that emissions growth has flatlined recently but varies across countries. Key findings indicate that while some nations show positive progress, others like India are offsetting these gains, and there's considerable uncertainty regarding the role of negative emissions technologies. It emphasizes that achieving targets will require substantial reductions in fossil fuel emissions and advancements in carbon capture and storage technologies.


